-
Nicholas Financial Is Now Trading Below Book Value
Posted by Eddy Elfenbein on December 6th, 2007 at 3:27 pmShares of Nicholas Financial (NICK) are now down to $7.20. According to the most recent 10-Q, the company’s book value is $7.50 a share.
-
It Was Only a Matter of Time
Posted by Eddy Elfenbein on December 6th, 2007 at 1:12 pmTired of those socially responsible funds? Well, Focus Shares gives us a sin-based ETF. You guessed it…the Sindex.
*Groan*
The ticker symbol is PUF.
*Double Groan*
Here are the stocks in the Sindex:
ABV UN AmBev -PN (ADR)
AOI Alliance One International Inc.
ASCA Ameristar Casinos
BF.B Brown-Forman Corp.
BTI UA British American Tobacco (ADR)
BUD Anheuser-Busch
BYD Boyd Gaming Corp.
BYI Bally Technologies Inc
CEDC Central European Distribution
CG Loews Corp. – Carolina Group
DEO UN Diageo (ADR)
HET Harrah’s Entertainment
IGT International Game Technology
ISLE Isle of Capris Casinos Inc
LVS Las Vegas Sands
MGM MGM Mirage
MO Altria Group, Inc.
MPEL Melco PBL Entertainment Macau Ltd.
PENN Penn National Gaming Inc
PNK Pinnacle Entertainment
RAI Reynolds American Inc.
SGMS Scientific Games
SHFL Shuffle Master
STZ Constellation Brands
TAP Molson Coors Brewing Company
UST UST Inc.
UVV Universal Corp.
VGR Vector Group
WMS WMS Industries
WYNN Wynn Resorts Ltd -
High-Yield Defaults Could Quadruple
Posted by Eddy Elfenbein on December 6th, 2007 at 9:34 amHere’s a stunning story. Moody’s says that high-yield bond defaults will quadruple next year, and that’s assuming the economy doesn’t go into a recession. If it does fall into a recession, defaults could rise tenfold.
The global default rate will rise to 4.2 percent by November from 1 percent now, the lowest since 1981, Kenneth Emery, director of corporate default research at Moody’s, wrote in the report e-mailed today. His forecast is based on an assumption the U.S. economy slows without falling into recession. In a recession, defaults may approach 10 percent, he said.
“We’re certainly looking for an economic slowdown next year and a pick-up in default rates,” said Simon Ballard, macro credit strategist at ABN Amro Asset Management in London. “Any default rate above 3.5 percent would require a very bearish outlook on the U.S. economy.”
More than one in 10 of the borrowers to which Moody’s assigns ratings are treated as “distressed” by bond traders, the highest proportion since global defaults reached 10.5 percent in 2002. At that time, bondholders charged as much as 11.4 percentage points above government rates to buy high-risk, high-yield debt, double the current average of 5.73 percentage points, according to Merrill Lynch & Co. indexes. -
JOSB Same-Store Sales Up 15%
Posted by Eddy Elfenbein on December 6th, 2007 at 9:12 amFrom MarketWatch:
JoS. A. Bank Clothiers Inc., (JOSB) the Hampstead, Md., retailer, reported that for November, same-store sales rose 15% while total sales increased 25% to $63.1 million from $50.6 million in the year-earlier month. A survey of analysts by Thomson Financial produced a consensus estimate of same-store sales up 2.2% in the month.
-
The Incredible Power of Momentum Stocks
Posted by Eddy Elfenbein on December 6th, 2007 at 8:18 amI’m a big fan of Professor Ken French’s data library. I’ve used data from his library at this site many times.
If you’re not familiar with Dr. French, he’s a well-known finance professor at the Tuck School at Dartmouth. He’s also known for his long-time association with Eugene Fama at the University of Chicago.
I was digging around some of the files in the library and I was completely stunned by the incredible outperformance of stocks with high momentum, meaning stocks that are surging have a tendency to keep on surging. I was aware of some of the academic literature on this subject, but I have to confess that I was completely dumbfounded by the results.
I know that stocks with favorable valuation characteristics do better than the rest of the market. For example, stock in the lowest decile (or 10%) of price/earnings ratio have historically beaten the market. The same is true for stocks with higher dividend yields or low price/book ratios. Also, small-caps do better than large-caps (although I’m not particularly impressed by the small-cap premium). These phenomena are very well-known and have been documented countless times.
But simply put—high momentum creams them all.
At the data library, French has ten portfolios listed by momentum (see “10 Portfolios Formed on Momentum”). He gets his data from the Center for Research in Security Prices at the University of Chicago. I looked at the long-term returns of stocks with the greatest momentum.
From the beginning of 1927 through August of 2007, the overall market has returned an average of 10.10% a year. The highest momentum stocks returned an average of 17.76% a year.
What’s more, that’s just the value-weighted portfolio. By looking at the equal-weighted portfolio, which gives more say to smaller-cap stocks, the results are even more impressive. The equal-weighted high-momentum portfolio returned an average of 21.94% a year. Here’s the chart:
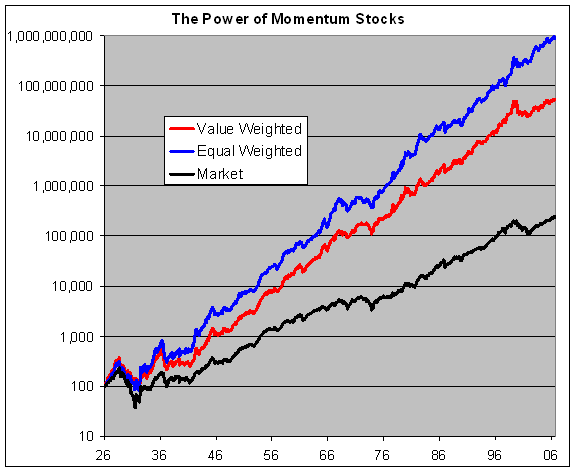
Wow.
Also, while the momentum portfolios are more volatile, they don’t strike me as being usually high. The monthly standard deviation for the value-weighted momentum stocks is about 20% greater than the rest of the market. The equal-weighted stocks are 37% more volatile.
The problem I have with many small-cap or value-related models is that the results are highly cyclical. It’s true that small-caps do well after several decades, but it’s not unusual to see underperformance for five years of more. That happened to small-caps in the 1990s and I think value is entering a down phase right now. With momentum, the results are much more consistent. Heck, just look at the red and blue lines.
There’s also the question of what we mean by stocks with high momentum. I called Dr. French just to make sure I had it right and he was very helpful in explaining it to me. By momentum stocks, he ranks every stock by how it did over an 11-month period, then skips a month and then tracks them for one month. At the end of the month, the whole thing is repeated.
Confusing?
He’s an example. On January 1, we take the top 10% of stocks by their performance for the previous January 1 through November 30. The stocks are held for exactly one month and the process is repeated again on February 1.
This system in completely mechanistic and all emotions are banished. I’ve known lots of people who are momentum investors but they rarely have the discipline to act by strict rules.
Another interesting aspect of a momentum strategy is the turnover probably isn’t that high. Since it encompasses the best returns for 11 months, many stocks will remain each month. Dr. French said that he thinks the turnover is 91%. That’s high, but not as high as many mutual funds.
There are lots of historically interesting strategies but many are very impractical. For example, the stock market has been net down on Monday, Tuesday and Thursday combined. But it’s highly impractical to sell all your stocks and buy them a few times each week. But I don’t think that’s the case with a momentum strategy. Also, I’m sure you could even use ETFs to mimic the high-momentum portfolios.
There’s also the question of why. Why do stocks with high momentum continue to outperform for a bit more? Is there something inefficient in their…frothiness? Can a person really play the height of their frothiness all the time by constantly shifting?
According to the Efficient Market Hypothesis, this outperformance would rationally be exploited away. I’m not a believer in efficient Market Theory (ironically, it was developed by Eugene Fama) but I do think stocks show a bias towards efficiency. Perhaps there’s something in a surging stock that causes the pre-requisites for an efficient market to break down (flow of information??).
Dr. French was careful to say that he’s not the discoverer of momentum premium. That award goes to Jegadeesh and Titman who in 1993 found that the best-performing stocks of the last six months outperform the worst over the six to twelve month. I’m very impressed. I’m planning to look into more of the academic literature. -
2008 Buy List
Posted by Eddy Elfenbein on December 5th, 2007 at 12:39 pmI’ll unveil the Buy List for 2008 on Monday, December 17. I’ll start tracking the new stocks on January 1 and use the December 31 close as my buy price. I do this so no one can claim that I have any impact on the shares.
There are also two more earnings reports before the end of the year. FactSet Research Systems (FDS) reports on December 13 and Jos. A Bank Clothiers (JOSB) reports on December 18. -
Gold and Iran
Posted by Eddy Elfenbein on December 5th, 2007 at 10:41 amI’m curious how much the National Intelligence Estimate’s report that Iran suspended its nuclear program four years ago will affect the price of gold. While gold is impacted by inflationary concerns, it’s also influenced by geo-political concerns as well.
I suspect that problems with Iran have helped boost gold, but I wonder how large the impact has been. When gold is priced in euros, its rise hasn’t been as dramatic, but it’s certainly higher.
I’m also curious if the surge in support for Ron Paul is a sign of a top for gold. When gold peaked 28 years ago, the Libertarians had their best presidential showing ever. That year, Ed Clark won close to a million votes, including 11.66% in Alaska. The Libertarians even won two statehouse seats in Alaska that year. Double-digit inflation and gold at $850 seem to be very good for the party.
Since 1980, however, the Libertarian presidential candidates have been lucky to get half what Clark did. Now Ron Paul is running in a perfect environment for Libertarians—gold is up, the dollar is way down. The crucial primary will be in New Hampshire, a state almost tailored-made for them (“Live Free or Die”).
If Paul breaks 10% in New Hampshire, then I think gold will soon plunge. And no, I’m not serious. -
Headline of the Day
Posted by Eddy Elfenbein on December 4th, 2007 at 3:44 pm -
Reader Q&A
Posted by Eddy Elfenbein on December 4th, 2007 at 1:53 pmI always like getting e-mails from readers. I get a lot so I try to respond to as many as I can. Please feel free to e-mail me if you have any questions or comments. If I do post you e-mail, I will not include your name.
Here’s a recent e-mail I got. I’m posting it because it’s a good question and slso because my responses kept getting bounced.I am a frequent reader of your blog and have enjoyed many of the entries. Your investment style appears sound and a handful of your tips and articles have been quite conducive to my financial situation. Thank you. I have a question for you. I would like to find a fairly simple means of playing a rally in the US dollar. It may be versus a basket or a particular currency, for example, the euro. This may not be your cup of tea and so a simple ‘I do not know’ will suffice. If you have an opinion please email me at this address.
Thanks for the kind words!
You’re in luck! There is a simple way to play the U.S. dollar. PowerShares has an exchange trade fund that tracks the dollar. It’s the PowerShares DB US Dollar Index Bullish (UUP).
Here’s the description from Yahoo Finance:
The investment seeks to track the price and yield performance, before fees and expenses, of the Deutsche Bank Long US Dollar Futures Index. The index is comprised solely of long futures contracts. The futures contract is designed to replicate the performance of being long the US Dollar against the Euro, Japanese Yen, British Pound, Canadian Dollar, Swedish Krona and Swiss Franc. The fund is nondiversified. -
Next Week’s Fed Meeting
Posted by Eddy Elfenbein on December 4th, 2007 at 12:30 pmThe Federal Reserve meets again next Tuesday and Wall Street expects another rate cut. According to the latest from the futures market, Wall Street thinks there’s about a 60% chance for a 0.25% rate cut and a 30% chance for a 0.50% rate cute.
I think the Fed erred last time by only cutting by 0.25%, and I would prefer to see the Fed cut by 0.50% this time. Unlike a lot of folks, I don’t think it’s absolutely critical for the Fed to get it exactly right all the time. Twenty-five basis points isn’t that big a deal in an economy this large. Still, the market needs some relief.
The odds of a recession have clearly increased over the past few weeks. Three months ago, Wall Street was expecting fourth-quarter earnings growth of 8.8%. Today that number is down to just 1.1%. Also, economically cyclical stocks have underperformed the market since July. I think that will continue.
It’s hard to overstate the importance of interest rates on stock prices. A few weeks ago, I looked at all the data going back to 1962. If you took all the days when the three-month T-bill rate fell, the S&P 500 rose over 2,000%. On days when rates rose—a nearly identical time frame—the S&P lost nearly 60%.
- Load More
What does it mean when Tom Cruise, (who believes that Lord Xenu sacrificed the thetans in a volcano—or something like that), appears to be the sanest person in Hollywood?
The S&P 500 just wrapped up its best May in 30 years.
Trump Media raised around $1.44 billion from selling stock and about $1 billion in convertible bonds to buy Bitcoin for its treasury
-
-
Archives
- May 2025
- April 2025
- March 2025
- February 2025
- January 2025
- December 2024
- November 2024
- October 2024
- September 2024
- August 2024
- July 2024
- June 2024
- May 2024
- April 2024
- March 2024
- February 2024
- January 2024
- December 2023
- November 2023
- October 2023
- September 2023
- August 2023
- July 2023
- June 2023
- May 2023
- April 2023
- March 2023
- February 2023
- January 2023
- December 2022
- November 2022
- October 2022
- September 2022
- August 2022
- July 2022
- June 2022
- May 2022
- April 2022
- March 2022
- February 2022
- January 2022
- December 2021
- November 2021
- October 2021
- September 2021
- August 2021
- July 2021
- June 2021
- May 2021
- April 2021
- March 2021
- February 2021
- January 2021
- December 2020
- November 2020
- October 2020
- September 2020
- August 2020
- July 2020
- June 2020
- May 2020
- April 2020
- March 2020
- February 2020
- January 2020
- December 2019
- November 2019
- October 2019
- September 2019
- August 2019
- July 2019
- June 2019
- May 2019
- April 2019
- March 2019
- February 2019
- January 2019
- December 2018
- November 2018
- October 2018
- September 2018
- August 2018
- July 2018
- June 2018
- May 2018
- April 2018
- March 2018
- February 2018
- January 2018
- December 2017
- November 2017
- October 2017
- September 2017
- August 2017
- July 2017
- June 2017
- May 2017
- April 2017
- March 2017
- February 2017
- January 2017
- December 2016
- November 2016
- October 2016
- September 2016
- August 2016
- July 2016
- June 2016
- May 2016
- April 2016
- March 2016
- February 2016
- January 2016
- December 2015
- November 2015
- October 2015
- September 2015
- August 2015
- July 2015
- June 2015
- May 2015
- April 2015
- March 2015
- February 2015
- January 2015
- December 2014
- November 2014
- October 2014
- September 2014
- August 2014
- July 2014
- June 2014
- May 2014
- April 2014
- March 2014
- February 2014
- January 2014
- December 2013
- November 2013
- October 2013
- September 2013
- August 2013
- July 2013
- June 2013
- May 2013
- April 2013
- March 2013
- February 2013
- January 2013
- December 2012
- November 2012
- October 2012
- September 2012
- August 2012
- July 2012
- June 2012
- May 2012
- April 2012
- March 2012
- February 2012
- January 2012
- December 2011
- November 2011
- October 2011
- September 2011
- August 2011
- July 2011
- June 2011
- May 2011
- April 2011
- March 2011
- February 2011
- January 2011
- December 2010
- November 2010
- October 2010
- September 2010
- August 2010
- July 2010
- June 2010
- May 2010
- April 2010
- March 2010
- February 2010
- January 2010
- December 2009
- November 2009
- October 2009
- September 2009
- August 2009
- July 2009
- June 2009
- May 2009
- April 2009
- March 2009
- February 2009
- January 2009
- December 2008
- November 2008
- October 2008
- September 2008
- August 2008
- July 2008
- June 2008
- May 2008
- April 2008
- March 2008
- February 2008
- January 2008
- December 2007
- November 2007
- October 2007
- September 2007
- August 2007
- July 2007
- June 2007
- May 2007
- April 2007
- March 2007
- February 2007
- January 2007
- December 2006
- November 2006
- October 2006
- September 2006
- August 2006
- July 2006
- June 2006
- May 2006
- April 2006
- March 2006
- February 2006
- January 2006
- December 2005
- November 2005
- October 2005
- September 2005
- August 2005
- July 2005
 Eddy Elfenbein is a Washington, DC-based speaker, portfolio manager and editor of the blog Crossing Wall Street. His