-
CWS Market Review – November 2, 2021
Posted by Eddy Elfenbein on November 2nd, 2021 at 10:45 pm(This is the free version of CWS Market Review. If you like what you see, then please sign up for the premium newsletter for $20 per month or $200 for the whole year. If you sign up today, you can see our two reports, “Your Handy Guide to Stock Orders” and “How Not to Get Screwed on Your Mortgage.”)
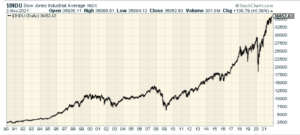
Today, the Dow Jones Industrial Average closed above 36,000 for the first time in history. This is noteworthy because of a book published 22 years ago called Dow 36,000.
In it, authors James K. Glassman and Kevin A. Haslett argued that the investing world had radically changed and that stock valuations were far too low. They claimed that the Dow, then around 9,000, needed to be four-fold higher to be properly valued.
They weren’t predicting that the Dow would eventually rise to 36,000. Instead, they said that it should be at 36,000 at the time, which was October 1999.
The authors have come in for a lot of ribbing which I think is mostly unfair. Make no mistake – they were completely and totally wrong, but I admire anyone who puts forth a heterodox position, especially so publicly.
These topics are very much what I’m interested in. Twenty-two years ago, I bought Dow 36,000 and read it in one day. My goal was to find the exact mistakes in their theory. I wrote up a book review and shopped it around to different publications. No takers.
This was a shame because I believe I’m the only person who has correctly identified where and how they’re wrong. I had an email exchange with the authors. (One was friendly. The other was not.)
In any event, now I don’t need the approval of a newspaper to get my views to the public. I have a newsletter. Below I’m reproducing my book review from 22 years ago. I should apologize in advance because I go deep into the weeds on some arcane topics so some of it may bore you. Still, I’m proud of what I wrote.
Here it is:
Why the Dow 36,000 Argument Doesn’t Work
Now that the Dow Jones Industrial Average has soared over 4,500 points since Alan Greenspan warned us of the market’s “irrational exuberance,” a mini-industry has evolved of publishing books that attempt to explain the “new market.” The latest addition to the genre is Dow 36,000 by James K. Glassman and Kevin A. Hassett, both of the American Enterprise Institute. To give you an idea of how crowded the field is becoming, two other books are titled Dow 40,000 and Dow 100,000.
Unfazed by the Dow’s stunning climb, mega-bulls Glassman and Hassett have developed their own theory as to why the market has risen so much and why it will continue to rise. Their theory isn’t the usual litany one hears from Wall Street bulls (demographics, triumph of capitalism). Instead, their “36,000” theory goes right to the heart of investment analysis by questioning one of its elemental suppositions: namely, the idea that investments in stocks should demand a premium over investments in bonds due to the riskier nature of stocks. This isn’t split hairs they’re taking on.
Reciting historical data, Glassman and Hassett show that over the long haul, there is no difference between the risks of stocks and Treasury bonds. Therefore, they reason, there should be no risk premium at all. The authors claim that with the risk premium excised from the market, the perfectly reasonable price, or PRP as they call it, for the Dow is 36,000 (more on that later). Mind you, they’re not merely saying the Dow will eventually hit this magic number sometime in the future. Instead, Glassman and Hassett claim that 36,000 is where the Dow ought to be right now. Or more precisely, that’s where the Dow should have been early this year when they started writing the book. Could they be onto something? At the time, the Dow was at 9000.
The Dow very well may head to 36K, but it will have little to do with Glassman and Hassett’s theory. Their theory is seriously flawed due to major methodological errors.
First, Glassman and Hassett err in their selection of an appropriate measure of risk for their purpose. The free market prices risk, just like it prices everything else. That price is included in the price of stocks. In order to measure risk, Glassman and Hassett should use a measurement that isolates risk from the price of stocks. They don’t do this. Instead, they compare the standard deviation of stock returns to the standard deviation of risk-free-bond returns. That’s a different animal. Sure enough, with progressively longer holding periods, stock returns’ standard deviations gradually get smaller. Upon realizing that at long term, the standard deviation of stock returns is the same as bond returns’, actually slightly less, Glassman and Hassett conclude that stocks are “no more risky” than Treasury bonds.
That’s a faulty conclusion. Even if the standard deviations are the same size, it doesn’t say anything about the risk that they’re looking for. The point is, that risk has still never been isolated: It’s inside those returns no matter how long term you go. The variability of risk’s part of all these returns may be diminishing as well. That can happen even if risk stays exactly the same size. With Glassman and Hassett’s method, we have no idea how big the risk inherent in stock ownership is.
Without all the mumbo-jumbo, think of two houses, identical in every way except one has a great view of the river, the other does not. How much does the river view cost? Easy. Compare the prices of the two homes, and the difference must be the price of the view. The fact that the prices paid may deviate from their own respective averages the same way, speaks nothing as to the price of the view. Glassman and Hassett are saying that since those deviations are the same, the river view is free.
Running with this assumption, Glassman and Hassett reason that since risk and reward are related, assets with the same risk will have the same return. Therefore, stocks and bonds will have the same returns. For this to happen, they claim, “the Dow should rise by a factor of four.” How do they get four?
Glassman and Hassett start with the “Old Paradigm” premise that bond returns plus a risk premium equals stock returns. With the risk premium “properly” removed, the yield on Treasuries—meaning their expected return—should be the same as the expected return for stocks. And that’s their dividend yield plus the dividend’s growth rate. So far, so good. Since the sum of these two is now about 1.5% above today’s Treasury yield, the yield on stocks needs to be adjusted downward in order to bring everything into balance. Specifically, it needs to drop from about 2% to 0.5%. With the yield dropping to one-fourth its previous level, stock prices will jump fourfold. Presto. That’s how we get from 9000 to 36000.
Not exactly. The authors have made another mistake. It’s impossible to have a one-time-only ratcheting down of the market’s dividend yield. The reason is that if long-term stock returns don’t change, as the authors do assume, a lower dividend yield will always create a commensurate increase in the dividend growth rate. As a result, there will always be a new higher dividend whose yield will always be in need of being notched back down. And as a result, the dividend growth rate will increase, and the cycle will continue ad infinitum. The correct conclusion from their model is not a one-time-only fourfold increase in stocks, but one-time-only infinite increase in stocks. This means the authors are actually insufficiently bullish and, moreover, they’ve mistitled their book.
Fortunately, the second half of the book is the more valuable by far. Once the authors stop making theories, they start making some sense. In this section, the authors discuss how investors can capitalize on the continuing market boom. The authors estimate the market has another three to five years perhaps before 36K is reached. In any case, their strategies are rather conservative: Buy and hold, diversify, don’t trade too much, don’t let market fluctuations rattle you, don’t time the market. All perfectly sound ideas and not specifically dependent on “Dow 36,000.”
Glassman and Hassett also give the names of stocks and mutual funds they like. There’s nothing wrong with their stocks in the realm of theory, but readers definitely ought to avoid the author’s so-called Perfectly Reasonable Prices, which invite comparison to the famous description of the Holy Roman Empire—not holy, not Roman, not an empire.
I’m not familiar with Kevin Hassett’s former work, but I’ve always liked James Glassman’s investing articles for The Washington Post. His articles are consistently incisive and informative. This book, however, is nothing of the sort. Dow 36,000 contains egregious errors and fallacious reasoning.
Still, I do admire their ambition. With this book, Glassman and Hassett challenged a well-entrenched perception of reality. Being that this perception underwrites trillions of dollars, it’s a very, very, very, well-entrenched perception. Glassman and Hassett lost, and they lost badly. Old paradigms die hard, but they do die.
Me again in 2021. Reading the review again, I wasn’t as clear as I could have been. The older Eddy today would be brief and point out their math error. The authors argue that the market needs a lower dividend yield but they overlook the fact that a lower yield will in turn lower returns going forward.
Mueller Industries Soars to a New High
In June, I told you about Mueller Industries (MLI). At the time, I wrote, “Keep an eye on Mueller. This could be a big winner in the months ahead.” In the last six weeks, Mueller is up 34%. This is one of those little stocks that have delivered tremendous gains, and no one knows about them.
So what does Mueller do? Let’s get to brass tacks…literally.
Mueller is a leading manufacturer of copper, brass, aluminum and plastic products. This is a classic small-cap cyclical stock. Once you realize the scope of their business, you understand that the use of Mueller’s products is seemingly endless. Mueller makes everything from copper tubing and fittings to brass and copper alloy bars and refrigeration valves.
You can find Mueller most anywhere. Some of the companies that rely on Mueller are in sectors like plumbing, heating, air conditioning, refrigeration, appliance, medical, automotive, military and defense, marine and recreational.
Over the last 30 years, the stock is up more than 150-fold.
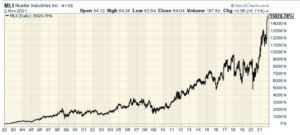
Mueller is pretty small. The market cap is about $3 billion. Two weeks ago, Muller reported very good earnings.
It helps that the price for copper is going up. Sales rose 59% to $982.2 million. Earnings rose from 76 cents per share for last year’s Q3 to $3.01 per share for this year’s Q3. Those aren’t exactly comparable since Mueller sold off some businesses. The company reduced its debt by $230 million. Even without the business sales, Mueller is doing well. MLI closed at another all-time high today.
That’s all for now. I’ll have more for you in the next issue of CWS Market Review.
– Eddy
P.S. Don’t forget to sign up for our premium newsletter.
-
No Buy List Earnings Today
Posted by Eddy Elfenbein on November 2nd, 2021 at 9:29 amThere are no Buy List earnings reports today. However, the Federal Reserve begins its two-day meeting today. The central bank will release its policy statement tomorrow afternoon. There are also local elections happening today.
Tomorrow, ADP will release its private payroll report. Then on Thursday, we’ll get another report on jobless claims. That leads us up to Friday when the government will release the official jobs report for the month of October.
The consensus on Wall Street is that the U.S. economy created 450,000 net new jobs last month. Also, economists expect that the unemployment rate to fell to 4.7%.
-
Morning News: November 2, 2021
Posted by Eddy Elfenbein on November 2nd, 2021 at 7:07 amEurope Fears That Rising Cost of Climate Action Is Stirring Anger
How Car Shortages Are Putting the World’s Economy at Risk
How the Supply Chain Crisis Risks Taking the Global Economy Down With It
Fed’s Bond-Buying Timeline: Roaring Entry, Boring Exit?
A Cryptocurrency Inspired by ‘Squid Game’ Crashes. The Industry Has Questions.
Earn 7.12% Risk-Free on Your Savings, No Crypto or Junk Bonds Needed
How the Pandemic Has Added to Labor Unrest
J&J, Teva Beat $50 Billion Opioid Case in First Industry Win
Yahoo Quits China, Ending a Rocky Relationship
DuPont to Buy Rogers for $5.2 Billion, Divest Part of Mobility Unit
Tesla Shares Slump After Musk Tweets That Hertz Deal Isn’t Done Yet
Rivian Automotive Targets IPO Valuation Just Above $60 Billion
Zillow Stock Falls Further After Report It Plans to Sell 7,000 Homes for $2.8 Billion
The McRib Is Back at McDonald’s. It’s Also An NFT.
How A Side Hustle Can Boost Performance at Your Regular Job
Be sure to follow me on Twitter.
-
Tesla Has Averaged a 1% Gain Every Week
Posted by Eddy Elfenbein on November 1st, 2021 at 12:19 pmTesla (TSLA) has gone up 1% per week, on average, for nearly 10 years.
Here’s how I got that. Tesla got to a high of $1154.40 today. On April 12, 2012, TSLA closed at $7.32. That’s a gain of 157.7-fold in exactly 500 weeks. That’s an average of 1.017% every week for 500 weeks. Not bad.
Middleby (MIDD) finally said when it will report its earnings. Their Q3 report will come out next Tuesday, November 9, before the market opens.
On our Buy List, we’ve had new highs today from Intercontinental Exchange (ICE), Moody’s (MCO), Thermo Fisher Scientific (TMO) and Zoetis (ZTS). Also, Abbott Labs (ABT) and FactSet (FDS) are very close to new highs.
I see that shares of Miller Industries (MLR) are creeping higher. The stock is up for the sixth day in a row. On October 5, MLR got to a low of $33.33. It’s up nearly 10% since then. The earnings report is due out on Wednesday.
The ISM Manufacturing Index came out this morning. It dropped from 61.1 to 60.8. That’s still a very good number. Recessions usually don’t happen until the ISM reaches the mid-40s.
The economy is struggling with shortages across industries as global supply chains remain clogged. Supply constraints, which were worsened by a wave of Covid-19 infections driven by the delta variant over summer, helped to restrain economic growth to its slowest pace in over a year in the third quarter.
The motor vehicle industry has been the hardest hit. Outside the shutdown in spring 2020, which severely depressed output, the third quarter was the worst period for motor vehicle production since early 2009. Economists and businesses expect supply chains could remain tight through 2022.
The ISM survey’s measure of supplier deliveries increased to a reading of 75.6 last month from 73.4 in September. A reading above 50% indicates slower deliveries. Longer waits for materials meant high inflation at the factory gate persisted. The survey’s measure of prices paid by manufacturers accelerated to 85.7 from a reading of 81.2 in September.
-
Barron’s on Fiserv
Posted by Eddy Elfenbein on November 1st, 2021 at 11:54 amBarron’s recently discussed stocks that are well-regarded on Wall Street but haven’t had a good year. That certainly describes Fiserv (FISV). Some analysts are still bullish on the stock.
Fiserv, for example, has been under pressure in part because of its debt load. But RW Baird analyst David Koning wrote in a recent note that Fiserv’s earnings and revenue growth “will likely be about the best it has been in multiple decades” over the next few years as the company chips away at its debt. While risks persist as the company integrates its 2019 acquisition of First Data, Raymond James analyst John Davis sees a company in the midst of a transformation, with a cheap valuation and prospects for earnings growth in the mid teens for the foreseeable future.
-
Morning News: November 1, 2021
Posted by Eddy Elfenbein on November 1st, 2021 at 7:00 amBanks Tried to Kill Crypto and Failed. Now They’re Embracing It (Slowly).
Thiel Says High Cryptocurrency Prices Show Inflation is Real
Inflation, Wage Data, Challenge Fed ‘Transitory’ Narrative
Treasury Set for Own Tapering With $1 Trillion in Debt Cuts Seen
Yellen Dismisses Treasury-Market Jitters, Sees ‘Solid’ Recovery
Metaverse Pioneers Unimpressed by Facebook Rebrand
Saudi Aramco Reports a $30 Billion Quarterly Profit as Oil Prices Soar
Russia’s Dirty Gas Is Keeping Europe From Freezing Over
China’s Popular Electric Vehicles Have Put Europe’s Automakers on Notice
Lab-Grown Diamonds Are Latest Victims of China’s Power Crisis
China Locks 34,000 Guests Inside Disneyland for Covid Tests
Angling for a Merry ‘Fishmas’ Despite Global Shipping Delays
Roblox Goes Down, Forcing Children Outside for Halloween
Let’s Put To Bed The Insulting Notion That Elon Musk Is A ‘Crony Capitalist’
Barclays CEO Jes Staley Quits After Investigation into Links with Jeffrey Epstein
Be sure to follow me on Twitter.
-
Earnings from Cerner and Church & Dwight
Posted by Eddy Elfenbein on October 29th, 2021 at 2:03 pmWe had two more earnings reports today. Cerner (CERN) has been stuggling for us this year, but we got some good news today. The healthcare-IT firm said it made 86 cents per share for its Q3. That’s up 19% from last year. Revenue rose 7% to $1.468 billion and free cash flow increased by 32% to $312 million.
“During the third quarter, we delivered solid revenue growth, expanded Adjusted Operating Margin (non-GAAP) by 150 basis points and increased Adjusted Diluted EPS (non-GAAP) by nearly 20%,” said Mark Erceg, Executive Vice President and Chief Financial Officer. “The organizational transformation and productivity measures implemented earlier this year and additional on-going product focus and cost control initiatives are strengthening our business. A clear focus on cash generation is also having a positive impact as evidenced by a 32% increase in Free Cash Flow (non-GAAP) for the quarter. The increase in Free Cash Flow (non-GAAP) and our strong balance sheet allowed us to repurchase $375 million of shares during the quarter, which brings our year-to-date purchases to $1.1 billion.”
Those are solid numbers. For Q4, Cerner expects revenue “to grow upper-mid-single digits.” For earnings, Cerner sees EPS growth of 10% to 13%.
Let’s do some math. Since Cerner made 78 cents per share for last year’s Q4, that implies earnings for this year’s Q4 of 86 to 88 cents per share. For the first three quarters of this year, Cerner has made $2.42 per share. The new guidance implies full year earnings of $3.28 to $3.30 per share. That’s an increase to the previous guidance of at least $3.25 per share.
The shares gapped up nearly 7% at today’s open, but it’s backed off some since then.
Three months ago, Church & Dwight (CHD) said that Q3 was going to be weak. The consumer-products company projected earnings of 70 cents per share which was well below Wall Street’s forecast. The official word was that they were “temporarily constrained by supply.”
Well, I guess they were a little conservative. Today we learned that C&D made 80 cents per share for its Q3.
Matthew Farrell, Chief Executive Officer, commented, “Our brands once again experienced strong consumption in Q3. Organic sales growth of 3.7% is on top of 9.9% organic growth in Q3 2020. In the U.S. we grew consumption in 12 of the 16 categories, with five categories exceeding double digit growth. Consumption continues to outpace shipments as supply chain disruptions continue. Global online sales grew 2.2% (on top of 102% growth in Q3 2020) and as a percentage of total sales has expanded to 14.3% in Q3.
Church & Dwight now expects full-year sales growth of 5.5% and 4% organic sales growth. For earnings, the company expects 61 cents per share. That would come to $3 per share for the entire year. The shares got a small pop after the report.
-
Morning News: October 29, 2021
Posted by Eddy Elfenbein on October 29th, 2021 at 7:02 amGreece Is Getting Rewired For The Future
The World’s Biggest Immigration System Offers Lessons for a Disrupted World
Detroit’s Chip Woes Drag on U.S. Economic Growth
How Apple is Gaining Smartphone Customers During a Chip Shortage
Microsoft Set to Be World’s Most Valuable Stock as Apple Slides
Oil Executives Grilled Over Industry’s Role in Climate Disinformation
Chevron Posts Highest Profit in 8 Years on Surging Oil, Gas Prices
ExxonMobil Posts Highest Quarterly Profit in Nearly Four Years
How a Mistake by YouTube Shows Its Power Over Media
Wall Street Starts to Doubt Facebook, Its Longtime Darling
Could a New Name Help Facebook After All?
Meta Shares Spike — But It’s a Canadian Materials Company, Not the Rebranded Facebook
Amazon Slaps a $9.95 Fee on Whole Foods Deliveries. And Walmart Pounces
The 37-Year-Olds Are Afraid of the 23-Year-Olds Who Work for Them
A $532 Million NFT Sale Was a Sham
How Cheesecake to Go Saved the Cheesecake Factory
Be sure to follow me on Twitter.
-
Stryker Earned $2.20 per Share
Posted by Eddy Elfenbein on October 28th, 2021 at 4:19 pmAfter the bell, Stryker (SYK) had a big earnings miss. For Q3, the company made $2.20 per share which was eight cents below Wall Street’s consensus.
Net sales increased 11.3% while organic net sales increased 4.5%.
“Our teams showed strong resilience and delivered solid quarterly financial results despite a resurgence of COVID-19 that intensified through the quarter,” said Kevin Lobo, Chair and Chief Executive Officer. “This latest spike mostly impacted our U.S. implant related businesses as scheduled procedures were deferred. Despite those impacts, we delivered strong growth in our MedSurg and NeuroTech businesses and are ready to support our customers as the pandemic recedes.”
For guidance:
We now expect 2021 organic net sales growth to be in the range of 7% to 8% from 2019, and now expect adjusted net earnings per diluted share(2) to be in the range of $9.08 to $9.15, including the full year impact of the acquisition of Wright Medical. If foreign currency exchange rates hold near current levels, we expect EPS will be positively impacted by approximately $0.05 to $0.10 for the full year.
That’s down from the previous guidance for organic sales growth of 9% to 10% and earnings between $9.25 and $9.40 per share.
We had new highs today from Intercontinental Exchange (ICE), Moody’s (MCO), Sherwin-Williams (SHW), Thermo Fisher Scientific (TMO) and Zoetis (ZTS).
-
More Earnings Reports Today
Posted by Eddy Elfenbein on October 28th, 2021 at 2:53 pmWe had a few more Buy List earnings report today.
This morning, Check Point Software (CHKP) said it made $1.65 per share. That was five cents better than estimates. Revenue grew 5% to $534 million. Analysts were expecting $530 million.
Check Point said it expects full-year earnings of $6.81 to $7.01 per share. That’s an increase from the previous guidance of $6.45 to 6.85 per share.
That works out to a Q4 range of $1.99 to $2.19 per share.
During Q3, Check Point bought back 2.64 million shares for $325 million. The company is expanding its buy back authorization by $2 billion.
The stock has been up as much as 4% today, although it’s trading off its high.
For Q3, Hershey (HSY) said it made $2.10 per share. That beat the Street by 10 cents.
The chocolate folks also increased their earnings guidance. Previously, Hershey said it expects earnings growth of 8% to 10%. Now they say it will be 11% to 13%. That works out to a range of $6.98 to $7.11 per share. That implies Q4 earnings of $1.49 to $1.62 per share.
Intercontinental Exchange (ICE) said it made $1.30 per share for Q3 while sales rose 28% to $1.8 billion. Earnings beat the Street by eight cents per share. The shares got to a new high today of $137.99. In March 2020, ICE traded as low at $63.51 per share.
Moody’s (MCO) earned $2.69 per share for Q3. Expectations were for $2.52 per share. Revenue increased 13% to $1.5 billion.
For the third time this year, Moody’s has raised its full-year guidance. The original range was $10.30 to $10.70 per share. Then it went to $11.00 to $11.30 per share. In July, it went to $11.55 to $11.85 per share. And now, it’s up to $12.15 to $12.35 per share.
That works out to a Q4 range of $2.18 to $2.38 per share. Moody’s is up over 3% today and it reached a new 52-week high.
- Load More
Good run:
“Common Sense,” by Thomas Paine (published January 10, 1776)
“The Decline and Fall of the Roman Empire” (Vol. 1), by Edward Gibbon (February 17, 1776)
“An Inquiry into The Wealth of Nations,” by Adam Smith (March 9, 1776)
“The Declaration of Independence,” by… -
-
Archives
- June 2025
- May 2025
- April 2025
- March 2025
- February 2025
- January 2025
- December 2024
- November 2024
- October 2024
- September 2024
- August 2024
- July 2024
- June 2024
- May 2024
- April 2024
- March 2024
- February 2024
- January 2024
- December 2023
- November 2023
- October 2023
- September 2023
- August 2023
- July 2023
- June 2023
- May 2023
- April 2023
- March 2023
- February 2023
- January 2023
- December 2022
- November 2022
- October 2022
- September 2022
- August 2022
- July 2022
- June 2022
- May 2022
- April 2022
- March 2022
- February 2022
- January 2022
- December 2021
- November 2021
- October 2021
- September 2021
- August 2021
- July 2021
- June 2021
- May 2021
- April 2021
- March 2021
- February 2021
- January 2021
- December 2020
- November 2020
- October 2020
- September 2020
- August 2020
- July 2020
- June 2020
- May 2020
- April 2020
- March 2020
- February 2020
- January 2020
- December 2019
- November 2019
- October 2019
- September 2019
- August 2019
- July 2019
- June 2019
- May 2019
- April 2019
- March 2019
- February 2019
- January 2019
- December 2018
- November 2018
- October 2018
- September 2018
- August 2018
- July 2018
- June 2018
- May 2018
- April 2018
- March 2018
- February 2018
- January 2018
- December 2017
- November 2017
- October 2017
- September 2017
- August 2017
- July 2017
- June 2017
- May 2017
- April 2017
- March 2017
- February 2017
- January 2017
- December 2016
- November 2016
- October 2016
- September 2016
- August 2016
- July 2016
- June 2016
- May 2016
- April 2016
- March 2016
- February 2016
- January 2016
- December 2015
- November 2015
- October 2015
- September 2015
- August 2015
- July 2015
- June 2015
- May 2015
- April 2015
- March 2015
- February 2015
- January 2015
- December 2014
- November 2014
- October 2014
- September 2014
- August 2014
- July 2014
- June 2014
- May 2014
- April 2014
- March 2014
- February 2014
- January 2014
- December 2013
- November 2013
- October 2013
- September 2013
- August 2013
- July 2013
- June 2013
- May 2013
- April 2013
- March 2013
- February 2013
- January 2013
- December 2012
- November 2012
- October 2012
- September 2012
- August 2012
- July 2012
- June 2012
- May 2012
- April 2012
- March 2012
- February 2012
- January 2012
- December 2011
- November 2011
- October 2011
- September 2011
- August 2011
- July 2011
- June 2011
- May 2011
- April 2011
- March 2011
- February 2011
- January 2011
- December 2010
- November 2010
- October 2010
- September 2010
- August 2010
- July 2010
- June 2010
- May 2010
- April 2010
- March 2010
- February 2010
- January 2010
- December 2009
- November 2009
- October 2009
- September 2009
- August 2009
- July 2009
- June 2009
- May 2009
- April 2009
- March 2009
- February 2009
- January 2009
- December 2008
- November 2008
- October 2008
- September 2008
- August 2008
- July 2008
- June 2008
- May 2008
- April 2008
- March 2008
- February 2008
- January 2008
- December 2007
- November 2007
- October 2007
- September 2007
- August 2007
- July 2007
- June 2007
- May 2007
- April 2007
- March 2007
- February 2007
- January 2007
- December 2006
- November 2006
- October 2006
- September 2006
- August 2006
- July 2006
- June 2006
- May 2006
- April 2006
- March 2006
- February 2006
- January 2006
- December 2005
- November 2005
- October 2005
- September 2005
- August 2005
- July 2005
 Eddy Elfenbein is a Washington, DC-based speaker, portfolio manager and editor of the blog Crossing Wall Street. His