-
The Fed Should Cut Rates By 0.25%
Posted by Eddy Elfenbein on June 26th, 2007 at 10:00 amThe Federal Reserve is meeting this week, as it’s almost universally expected that nothing will happen. I agree, the Fed won’t raise or lower rates, but I think it’s time that the Fed should lower interest rates. I’m not pushing for a big cut, just a small 25-basis-point cut for now, and we can see where that leads us.
Historically, there have been “fine tuning” measures from the Fed. Ten years ago, the Fed bumped up rates from 5.25% to 5.5%. That was the only move in nearly two-and-half years.
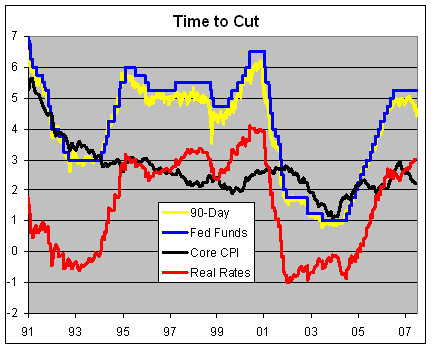
The main reason for my outlook is the sudden drop in short-term interest rates. The 90-day T-bill and the Fed Funds rates almost always track each, but not lately. Last week, the yield on short-term Treasuries dropped below 4.4%. That’s a difference of over 85 basis points from the Fed, and it’s the widest such spread in six years.
Clearly, the market wants a cut. I think the Fed has been most effective when it has given the market what it wants instead of trying to push it where it doesn’t want to go.
The other reason is that inflation seems to be cooling off. Last October, the core rate of inflation got to 2.9% and now it’s backed off to just 2.2%. Most surprisingly, that’s exactly what the Fed said will happen (here’s my exclusive coverage of Bernanke’s testimony from last July).
I know there are many concerns about the government’s measure of inflation, and the use of the core rate. I think these arguments are correct, however, my concern here isn’t the level of inflation but the direction. Inflation maybe higher than they’re telling us, but it’s lower than where it was. This means that the “real” Fed Funds rate, meaning the difference between the Fed’s target rate and inflation, has been increasing. So in effect, as inflation has cooled off, it’s been as if the Fed has continued to raise rates.
The real Fed Funds rate is now slightly over 3%. Historically, anything more than that is trouble for the economy. I also don’t get how gold can be around $650. With 3% real rates, that seems massively overpriced.
Here’s a chart of 90-day T-bills (yellow), the Fed Funds rate (blue), core inflation (black) and the real Fed Funds rate (red) going back to 1991.
-
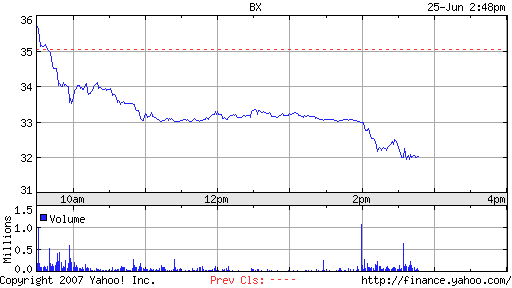
That Was Quick
Posted by Eddy Elfenbein on June 25th, 2007 at 3:14 pmBlackstone (BX) is about 10% below today’s open.
-
News Items
Posted by Eddy Elfenbein on June 25th, 2007 at 1:17 pmHere are a few news items over the past few days:
I’ll start with a positive article on Jos. A. Bank (JOSB). JOSB has been, by far, our best stock this year.
Medtronic (MDT) raised its dividend from 11 cents a share to 12.5 cents a share. The company has increased its dividend every year since 1978. Medtronic also increased its stock buyback plan by 50 million shares, which is about 4.4 % of the outstanding shares.
Shares of Harley-Davidson (HOG) got a boost on Friday due to rumors of a buyout from Honda. Please. There’s no way that would have happened. Honda officially squashed the rumor, and HOG is lower today.
Finally, Bed Bath & Beyond (BBBY) reports earnings on Wednesday. Earlier this month, the company issued its first-ever profit warning. The Street was expecting 39 cents a share, but BBBY said it will be between 36 and 38 cents a share. The stock is down over 8% since then. Historically, earnings for the first quarter make up about 15% of the full-year earnings. I wouldn’t be surprised to see EPS of 39 cents. -
Greenspan Comes Out Of Retirement For One More Interest Rate Hike
Posted by Eddy Elfenbein on June 25th, 2007 at 9:00 am
The Onion scoops Wall Street:Confirming a rumor that first appeared in March on the FDIC Fan Forum message board, former Federal Reserve chairman Alan Greenspan came out of retirement Tuesday to raise interest rates on federal funds by a quarter of a point.
“You may remember this one from 1989,” said Greenspan, barely audible above the roar of an estimated crowd of 20,000 gathered in front of the Marriner S. Eccles Building. “But before I start, I think I’m gonna need [current Federal Reserve chairman] Ben [Bernanke]’s help with this. C’mon up here, Ben.”
Greenspan refused to comment on buzz that he was planning a five-nation comeback tour to stabilize international housing markets.There really is a Fed meeting this week and I wouldn’t mind seeing a 0.25% cut.
-
Just Another Friday
Posted by Eddy Elfenbein on June 22nd, 2007 at 1:58 pmWe may be witnessing the end of capitalism as we know it.
I’m much more grateful for everything that I have, even just to have a pillow at night or food.
Here are the 10 largest IPOs:
Stock……………………………………………….Value…………..Date
AT&T Wireless Group……………………….$10,620.0…….26-Apr-00
Kraft Foods Inc……………………………….$8,680.0………12-Jun-01
UPS………………………………………………$5,470.0………9-Nov-99
KKR Private Equity Investors…………….$5,048.8………3-May-06
CIT Group Inc…………………………………$4,866.2………1-Jul-02
Conoco………………………………………….$4,403.5………21-Oct-98
Travelers Ppty Casualty Corp…………….$4,273.5……..21-Mar-02
Agere Systems Inc…………………………..$4,140.0………27-Mar-01
Blackstone Group LP………………………$4,133.3……..21-Jun-07
Charter Communications Inc………………$3,714.5………8-Nov-99 -
SEI Investments Splits 2-for-1
Posted by Eddy Elfenbein on June 22nd, 2007 at 10:03 amOne of our Buy List stocks, SEI Investments (SEIC), split 2-for-1 this morning.
For tracking purposes, the number of shares will double from 839.4896 to 1678.9792 and the initial price falls from $59.56 to $29.78.
For more details on how I track the Buy List, see here. -
Blackstone is LIVE
Posted by Eddy Elfenbein on June 22nd, 2007 at 9:53 amBlackstone (BX) opened at $36.45 at $17 million shares. That’s 17% higher than the offer price.
Interestingly, Stephen Schwarzman is not on the floor, but guess who is? Tom Wolfe! -
Firefox
Posted by Eddy Elfenbein on June 21st, 2007 at 8:54 pmI just downloaded Firefox—oh my god! OMG! It’s waaay better than IE. I mean WAY better.
C’mon people…how come no one told me? Why am I always the last person to know about these things?
If you’ve read this blog for any amount of time, you ought to know that I can’t be trusted with anything technomological.
Now if you’ll excuse, I have to get back to an exciting game of Parsec on my T1-99. -
Blackstone Priced at $31 a Share
Posted by Eddy Elfenbein on June 21st, 2007 at 5:52 pmHold on, folks. Trading in BX will begin tomorrow. At $31 a share, Stephen Schwarzman’s stake is worth about $7.7 billion. The entire company is worth about $30 billion. Impressive, but it’s still about one-fifth the size of Berkshire Hathaway (BRKA).
-
The Cyclical-Stock Party Is Ending
Posted by Eddy Elfenbein on June 21st, 2007 at 12:59 pmMy latest at RealMoney on the last gasp of the cyclical rally. It’s a paid link, but here’s a sample:
The CYC is up over 22% this year and up over 40% in the past 11 months. Going back to the March 2003 low, the CYC has jumped 180%, which doubles the S&P 500. Not too shabby.
But the best has come recently.
This year, the CYC has already set an amazing 40 new highs. In April it burst through 1000, and it’s quickly closing in on 1100. Like all good rallies, however, this must come to an end, and I’m afraid it won’t be pretty.
-
Archives
- July 2026
- June 2026
- May 2026
- April 2026
- March 2026
- February 2026
- January 2026
- December 2025
- November 2025
- October 2025
- September 2025
- August 2025
- July 2025
- June 2025
- May 2025
- April 2025
- March 2025
- February 2025
- January 2025
- December 2024
- November 2024
- October 2024
- September 2024
- August 2024
- July 2024
- June 2024
- May 2024
- April 2024
- March 2024
- February 2024
- January 2024
- December 2023
- November 2023
- October 2023
- September 2023
- August 2023
- July 2023
- June 2023
- May 2023
- April 2023
- March 2023
- February 2023
- January 2023
- December 2022
- November 2022
- October 2022
- September 2022
- August 2022
- July 2022
- June 2022
- May 2022
- April 2022
- March 2022
- February 2022
- January 2022
- December 2021
- November 2021
- October 2021
- September 2021
- August 2021
- July 2021
- June 2021
- May 2021
- April 2021
- March 2021
- February 2021
- January 2021
- December 2020
- November 2020
- October 2020
- September 2020
- August 2020
- July 2020
- June 2020
- May 2020
- April 2020
- March 2020
- February 2020
- January 2020
- December 2019
- November 2019
- October 2019
- September 2019
- August 2019
- July 2019
- June 2019
- May 2019
- April 2019
- March 2019
- February 2019
- January 2019
- December 2018
- November 2018
- October 2018
- September 2018
- August 2018
- July 2018
- June 2018
- May 2018
- April 2018
- March 2018
- February 2018
- January 2018
- December 2017
- November 2017
- October 2017
- September 2017
- August 2017
- July 2017
- June 2017
- May 2017
- April 2017
- March 2017
- February 2017
- January 2017
- December 2016
- November 2016
- October 2016
- September 2016
- August 2016
- July 2016
- June 2016
- May 2016
- April 2016
- March 2016
- February 2016
- January 2016
- December 2015
- November 2015
- October 2015
- September 2015
- August 2015
- July 2015
- June 2015
- May 2015
- April 2015
- March 2015
- February 2015
- January 2015
- December 2014
- November 2014
- October 2014
- September 2014
- August 2014
- July 2014
- June 2014
- May 2014
- April 2014
- March 2014
- February 2014
- January 2014
- December 2013
- November 2013
- October 2013
- September 2013
- August 2013
- July 2013
- June 2013
- May 2013
- April 2013
- March 2013
- February 2013
- January 2013
- December 2012
- November 2012
- October 2012
- September 2012
- August 2012
- July 2012
- June 2012
- May 2012
- April 2012
- March 2012
- February 2012
- January 2012
- December 2011
- November 2011
- October 2011
- September 2011
- August 2011
- July 2011
- June 2011
- May 2011
- April 2011
- March 2011
- February 2011
- January 2011
- December 2010
- November 2010
- October 2010
- September 2010
- August 2010
- July 2010
- June 2010
- May 2010
- April 2010
- March 2010
- February 2010
- January 2010
- December 2009
- November 2009
- October 2009
- September 2009
- August 2009
- July 2009
- June 2009
- May 2009
- April 2009
- March 2009
- February 2009
- January 2009
- December 2008
- November 2008
- October 2008
- September 2008
- August 2008
- July 2008
- June 2008
- May 2008
- April 2008
- March 2008
- February 2008
- January 2008
- December 2007
- November 2007
- October 2007
- September 2007
- August 2007
- July 2007
- June 2007
- May 2007
- April 2007
- March 2007
- February 2007
- January 2007
- December 2006
- November 2006
- October 2006
- September 2006
- August 2006
- July 2006
- June 2006
- May 2006
- April 2006
- March 2006
- February 2006
- January 2006
- December 2005
- November 2005
- October 2005
- September 2005
- August 2005
- July 2005
 Eddy Elfenbein is a Washington, DC-based speaker, portfolio manager and editor of the blog Crossing Wall Street. His