-
The Magazine Cover Indicator
Posted by Eddy Elfenbein on May 3rd, 2007 at 10:33 amIn August 1979, BusinessWeek ran its famous “Death of Equities” cover. The bull market began three years later (to the day).
Now three finance professors have looked at the impact of magazine covers on stock prices. As you might guess, it’s a contrary indicator:A recent article in The Financial Analysts Journal by Thomas Arnold, John H. Earl Jr. and David S. North, all finance professors at the University of Richmond, called “Are Cover Stories Effective Contrarian Indicators?” offers an intriguing finding.
The professors look at how a company’s stock responds to a cover story in BusinessWeek, Fortune and Forbes. They find that positive stories follow periods of positive performance and negative stories follow periods of negative performance, which admittedly is not too surprising. More interesting, they also find that the appearance of a cover story tends to signal the end of the abnormal performance. Hence, individuals who trade on such “news” are not likely to do well.
This is not to say that articles in the financial press are not worth reading. Quite the contrary. They often provide insightful reporting and in-depth analysis. But by the time the articles have been researched, written and published, they are no longer news — the market price of the stock already reflects the company’s future prospects.
Taken together, this research offers yet more support for the time-tested investment strategy of buy and hold. Anything that you think is news is old hat to the professionals. Trying to outguess the market is a sucker’s game. -
Productivity Growth Slows
Posted by Eddy Elfenbein on May 3rd, 2007 at 9:51 amThe Labor Department reported that productivity growth slowed to 1.7% in the first quarter. That’s not a very good number, and productivity has been a bit sluggish in the past three years.
Still, today’s report marks an important milestone. The “American Productivity Miracle” began exactly ten years ago. This reversed a 24-year slide in productivity.
Despite weaker numbers in recent years, productivity has grown by an annual rate of 2.77% for the last ten years. To put that in perspective, in the ten years prior to that, productivity grew by just 1.56% a year. And in the ten years before that, it grew by just 1.23% a year.
It’s hard to overstate the importance of improved productivity. It allows workers to do more with less. Inflation is also kept down due to higher productivity, and by extension, interest rates are lowered. -
The Subprime Fallout hits GM
Posted by Eddy Elfenbein on May 3rd, 2007 at 9:14 amHow’s this for subprime fallout? Profits at GM (GM) dropped 90% from last year due to bad loans at its GMAC unit.
This is sad because GM was improving so nicely. Last year, the company only lost $2 billion compared with the $10 billion it lost in 2005.
But now the subprime mess has caught up with GM. Last year, GMAC’s Residential Capital earned $201 million. This year, it lost $905 million. GM had recently sold 49% of its stake in GMAC to Cerberus Capital Management.
Bloomberg noted that the yield on GM bonds due in 2033 fell to 9.2%. -
Dual-Class Share Structure
Posted by Eddy Elfenbein on May 2nd, 2007 at 1:09 pmJust a quick note on Murdoch’s bid for Dow Jones (DJ). I can’t think of a better argument against dual-class shares than the Bancroft family’s public rift over the offer.
The family’s super shares have ten times the voting power of the Class A shares (by the way, the same thing exists at many other companies like Google). There are at least 35 family members with super shares.
A Bancroft family representative said that “slightly more than 50%” of DJ’s voting power is against the deal. Breaking out the math, that means that about 80% of the family’s 64% is voting “No.” But still, we now know that some in family are for it, and “some” is all we need to make a point. The idea of super shares is so families can maintain control, but families don’t act as a single unit.
The idea of family control is turning back on itself. Couldn’t it be said that the family members in favor of the deal are speaking in the family’s interest? I certainly think so. Dear lord, it’s a 67% premium for a stock that hasn’t moved in eons. Before the offer, the stock was lower than where it was 24 years before while the Dow is up more than 10-fold. How much more evidence do we need that something needs to be done.
The family can’t hold back change forever. The company will have to be revamped, and hopefully it will happen before the Dow Jones Murdoch Industrial Average goes up another 10-fold. -
“They were able to manage through that fantastically.”
Posted by Eddy Elfenbein on May 1st, 2007 at 8:44 pmIt’s hard to avoid: If a firm’s costs go up, its profits go down.
Amphenol (APH) has impressed investors by bucking this logic.
The firm makes connectors, the thousands of different products that link electronic gizmos. Its connectors end up in cars, planes and almost any device that uses electric or fiber optic signals. It also makes cables.
To manufacture all this, it needs raw materials. They include gold, aluminum, copper and oil-based resin. Prices of those commodities have skyrocketed.
Yet with material costs rising, the firm managed to boost profits.
Raw materials were a “big head wind,” Shawn Harrison of Longbow Research said. “They were able to manage through that fantastically.” -
No Comment
Posted by Eddy Elfenbein on May 1st, 2007 at 4:37 pm -
The Portfolio Pile On
Posted by Eddy Elfenbein on May 1st, 2007 at 10:54 amConde Nast’s Portfolio has not gotten off to a great start. Now Dan Gross calls Tom Wolfe’s piece about hedge funders “astonishingly lame.”
When Wolfe does give us a name, the piece reads like a clip job. He introduces us to Thomas Hudson’s Pirate Capital and Daniel Loeb’s acid pen—both nicely described in Steve Fishman’s New York piece three years ago. As BusinessWeek did four years ago, Wolfe describes Stevie Cohen’s mammoth house: “32,000-square-foot clubhouse and 14 acres of grounds! Next to Stevie’s art collection—which is nothing less than a world class museum!—Stevie’s indoor basketball court, year-round swimming pool under glass, his gym, his spa facility, his theatre for movies and every other electronic medium, his hair salon, two putting greens complete with sand traps and a fairway in between, and, as the piece de resistance, an ice rink the size of Rockefeller Center’s with a 36-by-24-foot rink house for the Zamboni!” This is like a Wolfe parody, a laundry list punctuated by exclamation points!!
Indeed, there’s little evidence that Wolfe has any firsthand experience with these people. Yes, he attended the Robin Hood Foundation gala, and describes a scene at the wedding of Carl Icahn’s stepdaughter. But I don’t think he knows many of the young guys he so self-assuredly describes. (Maybe it’s because he doesn’t know where to look. At one point, he refers to “Merrill Lynch’s 41-story building in Times Square.” Perhaps he means Morgan Stanley‘s.) -
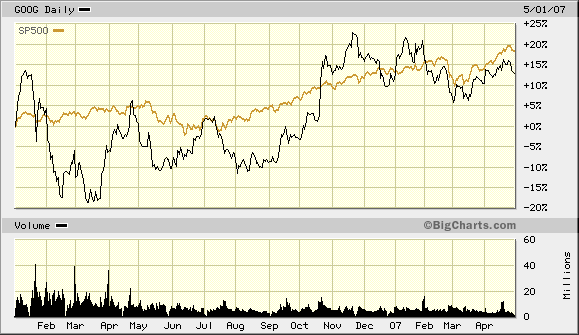
Great Business, Bad Stock
Posted by Eddy Elfenbein on May 1st, 2007 at 10:25 amDespite great business results, Google‘s (GOOG) stock hasn’t been such a winner. Since the beginning of last year, the stock is trailing the S&P 500, although there have been better entry points along the way.
-
Chase Throws Away Customers’ Info
Posted by Eddy Elfenbein on May 1st, 2007 at 9:50 am
Scary. -
Sysco’s Earnings
Posted by Eddy Elfenbein on April 30th, 2007 at 11:49 pmThe Dow was in the black for much of Monday, but after about 2:30, it slipped into negative territory and eventually finished 58 points lower. That ended the Dow’s chances of marking an historic first—20 of 22 up days.
Before the bell, Sysco (SYY) reported earnings of 35 cents a share. That was a nice improvement over last year’s total of 30 cents, but it was a penny short of Wall Street’s forecast. The market wasn’t pleased and the shares tumbled 4.6% lower. That seems like an overreaction. Nothing seems to be going Sysco’s way this year. The stock is down nearly 11% for 2007. That’s unusual for a stock that’s historically been so stable.
I also noticed that our favorite micro-cap, Nicholas Financial (NICK), seems to be waking up. The stock doesn’t normally move very much, but it rose 4% on Friday and another 2.6% today. That’s a lot for NICK. Both days had much higher-than-normal trading volume. The company should be reporting earnings soon, but it hasn’t said what day yet.
-
Archives
- June 2026
- May 2026
- April 2026
- March 2026
- February 2026
- January 2026
- December 2025
- November 2025
- October 2025
- September 2025
- August 2025
- July 2025
- June 2025
- May 2025
- April 2025
- March 2025
- February 2025
- January 2025
- December 2024
- November 2024
- October 2024
- September 2024
- August 2024
- July 2024
- June 2024
- May 2024
- April 2024
- March 2024
- February 2024
- January 2024
- December 2023
- November 2023
- October 2023
- September 2023
- August 2023
- July 2023
- June 2023
- May 2023
- April 2023
- March 2023
- February 2023
- January 2023
- December 2022
- November 2022
- October 2022
- September 2022
- August 2022
- July 2022
- June 2022
- May 2022
- April 2022
- March 2022
- February 2022
- January 2022
- December 2021
- November 2021
- October 2021
- September 2021
- August 2021
- July 2021
- June 2021
- May 2021
- April 2021
- March 2021
- February 2021
- January 2021
- December 2020
- November 2020
- October 2020
- September 2020
- August 2020
- July 2020
- June 2020
- May 2020
- April 2020
- March 2020
- February 2020
- January 2020
- December 2019
- November 2019
- October 2019
- September 2019
- August 2019
- July 2019
- June 2019
- May 2019
- April 2019
- March 2019
- February 2019
- January 2019
- December 2018
- November 2018
- October 2018
- September 2018
- August 2018
- July 2018
- June 2018
- May 2018
- April 2018
- March 2018
- February 2018
- January 2018
- December 2017
- November 2017
- October 2017
- September 2017
- August 2017
- July 2017
- June 2017
- May 2017
- April 2017
- March 2017
- February 2017
- January 2017
- December 2016
- November 2016
- October 2016
- September 2016
- August 2016
- July 2016
- June 2016
- May 2016
- April 2016
- March 2016
- February 2016
- January 2016
- December 2015
- November 2015
- October 2015
- September 2015
- August 2015
- July 2015
- June 2015
- May 2015
- April 2015
- March 2015
- February 2015
- January 2015
- December 2014
- November 2014
- October 2014
- September 2014
- August 2014
- July 2014
- June 2014
- May 2014
- April 2014
- March 2014
- February 2014
- January 2014
- December 2013
- November 2013
- October 2013
- September 2013
- August 2013
- July 2013
- June 2013
- May 2013
- April 2013
- March 2013
- February 2013
- January 2013
- December 2012
- November 2012
- October 2012
- September 2012
- August 2012
- July 2012
- June 2012
- May 2012
- April 2012
- March 2012
- February 2012
- January 2012
- December 2011
- November 2011
- October 2011
- September 2011
- August 2011
- July 2011
- June 2011
- May 2011
- April 2011
- March 2011
- February 2011
- January 2011
- December 2010
- November 2010
- October 2010
- September 2010
- August 2010
- July 2010
- June 2010
- May 2010
- April 2010
- March 2010
- February 2010
- January 2010
- December 2009
- November 2009
- October 2009
- September 2009
- August 2009
- July 2009
- June 2009
- May 2009
- April 2009
- March 2009
- February 2009
- January 2009
- December 2008
- November 2008
- October 2008
- September 2008
- August 2008
- July 2008
- June 2008
- May 2008
- April 2008
- March 2008
- February 2008
- January 2008
- December 2007
- November 2007
- October 2007
- September 2007
- August 2007
- July 2007
- June 2007
- May 2007
- April 2007
- March 2007
- February 2007
- January 2007
- December 2006
- November 2006
- October 2006
- September 2006
- August 2006
- July 2006
- June 2006
- May 2006
- April 2006
- March 2006
- February 2006
- January 2006
- December 2005
- November 2005
- October 2005
- September 2005
- August 2005
- July 2005
 Eddy Elfenbein is a Washington, DC-based speaker, portfolio manager and editor of the blog Crossing Wall Street. His