-
Today’s CPI Report
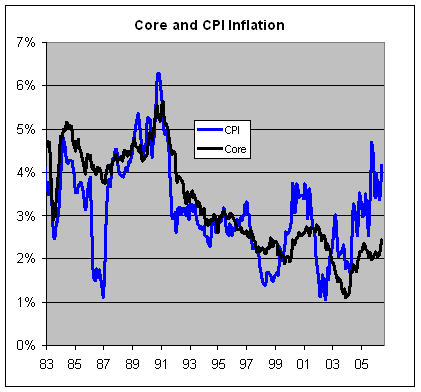
Posted by Eddy Elfenbein on June 14th, 2006 at 12:21 pmThe government reported that consumer inflation rose by 0.4% last monht, and the “core rate” rose 0.3%. This pretty much gurantees that the Fed will raise rates in two weeks.
Over the last twelve months, the CPI has risen by 4.2% and the core rate is up 2.4%. Here’s what inflation has looked like since 1983:
-
Gold’s Worst Day in 15 Years
Posted by Eddy Elfenbein on June 14th, 2006 at 7:04 amTo quote Bud Fox quoting Sun-tzu:
If your enemy is superior, evade him. If angry, irritate him. If equally matched, fight, and if not split and reevaluate.
This here’s the splittin’ and now we’re reevaluatin’:
Sorry to run this hideous chart again, but it’s the best way to show yesterday’s breakdown in gold. The metal hasn’t dropped like this since the air war began in the First Gulf War. That time, however, the stock market soared. This time, it sank.
Here’s a thought: Maybe Sptizer went after the wrong guys. If only he had looked in the commodity pits. Which is crazier, the Nasdaq at 5000 or gold at $730?
Of course, you can’t frogmarch a rock, Buddy boy. -
World Wrestling Profit Falls 35%
Posted by Eddy Elfenbein on June 13th, 2006 at 4:13 pmFrom AP:
For the quarter ended April 30, the company reported net income of $10.6 million, or 15 cents per share, compared with profits of $16.1 million, or 23 cents per share, a year ago. Revenue declined to $114.3 million from $118.3 million in the year earlier period.
Wall Street had forecast a profit of 13 cents per share, the average estimate of six analysts surveyed by Thomson Financial, on projected sales of $114.3 million.
“The earnings for the quarter were just as expected, but these guys really had to fight to get there,” said Dennis McAlpine, managing director of McAlpine Associates in Scarsdale, N.Y. “They’re fighting hard for every nickel they get.”I blame Mark Henry
-
More Goals Please
Posted by Eddy Elfenbein on June 13th, 2006 at 1:36 pmI’m watching the World Cup game between France and Switzerland. It looks like it’s headed to a 0-0 tie. This will be the second 0-0 tie in this year’s tournament.
I’m sorry, but there needs to be more scoring. I’m an America. We need action. Someone needs to be scoring, or at least inflicting pain, to keep our attention. That’s just how we are.
In the 13 games so far, there have been just 30 goals. That’s a little over two a game, or one every 45 minutes. Teams that have scored one goal are 3-4. There’s only been one come-from-behind victory (the South Koreans 2-1 over Togo). The only game that came close to an offensive explosion was Germany’s 4-2 win over Costa Rica.
I suggest a few rule changes (downs, set plays, use of hands, cheerleaders). Every sport in the world could benefit from more end zone celebrations.
OK, now the Brazilians are set to play. I’m expecting them to pound Croatia. They need this win. EWZ is down 34% in a month. -
The Last Seven Months
Posted by Eddy Elfenbein on June 13th, 2006 at 11:27 am
The index bounced off 1230 this morning. -
Goldman’s Earnings
Posted by Eddy Elfenbein on June 13th, 2006 at 11:13 amGoldman Sachs (GS) had even more impressive earnings than Lehman Brothers (LEH), but like Lehman, the stock is down.
Don’t miss John Carney at DealBreaker blogging the GS conference call. Also, we know that Blankfein will replace Paulson, Charlie Gasparino looks at who will take Blankfein’s place. -
Dissecting the Bear
Posted by Eddy Elfenbein on June 13th, 2006 at 7:28 am
Since May 5, the S&P 500’s market value has fallen by $807 billion. That’s a nice chunk of change. Percentage-wise, it comes to -6.74%.
What’s interesting to note is that since the stock market peaked, long-term interest rates have actually declined. Gold is down by $100 an ounce. This is not a market worried about inflation. If we use some reasonable assumptions, in just five weeks, the market has become convinced that around $50 billion of next year’s corporate profits will not materialize.
The Big Bad Bear, however, hasn’t treated everyone equally. Here’s the performance of the 10 industry sectors since May 5:
Utilities………………..+0.78%
Staples………………..-1.61%
Telecom………………-2.00%
Health Care………….-2.28%
Financials…………….-5.60%
Discretionary……….-5.68%
Industrials……………-8.71%
Energy………………..-11.41%
Tech…………………..-12.12%
Materials…………….-13.30%
Two observations. First, it’s almost the mirror image of the market before May 5. The other is that it’s a pretty wide gap. The bottom three groups, combined, make up just 27% of the S&P 500’s value, but have contributed more than half the losses. The rest of the market has suffered nary a scratch.
So is this a major turning point? A new period of leadership for defensive stocks? It’s hard to say. These turning points don’t make their appearances widely known. Afterall, the energy stocks have been outperforming the S&P 500 for over seven years, and materials stocks have been ahead of the index for nearly six years. The trends last a long time.
The two major defensive sectors, staples and health care, have been almost completely ignored by the bull market. Since mid-October 2002, the health care sector is up 7.2% and staples are up 10.9%, while the S&P 500 has grown by 38%.
A month ago, the market was beginning to think that the Fed would hold off raising rates at the end of June. But now, it’s convinced that another rate hike is coming. Interestingly, the yield on the 30-year T-bond now closely follows the price of oil. The correlation is up to 80%, which is a 15-year high.
Today, the PPI report showed that wholesale prices rose 0.2% in May. The core rate was up 0.3%, slightly above expectations of a 0.2% increase. Gold is below $600 an ounce, and copper has lost 13% in the last four days.
While the market is somewhat concerned about inflation, the main reason for the correction is a growing concern about the health of the economy. -
Crossing Broadway
Posted by Eddy Elfenbein on June 13th, 2006 at 7:18 am
Burleigh Grimes, a musical comedy about Wall Street, opens today off Broadway.
The show features music from (the very brillant) David Yazbek and stars Wendie Malick (Nina from Just Shoot Me), Mark Moses (Paul Young from Desperate Housewives) and James Badge Dale (Chase Edmunds from 24)Set in a world where no bad deed goes unrewarded, BURLEIGH GRIME$ follows George Radbourn (James Badge Dale), a Wall Street newbie who doesn’t recognize that his mentor, Burleigh Grimes (Mark Moses), may not be entirely sincere in appearance or agenda. A hard-driving stock market force, Grimes is a relentless man of infinite calculation, further assisted in his financial schemes by media powerhouse Elizabeth Bigley (Wendie Malick).
In an arena where the naive and sentimental face ruin, George struggles for survival under the hand of Grimes’ flexible business tactics, while also dealing with the arrival of his college sweetheart, Grace Redding (Ashley Williams), who will soon have to face some difficult choices of her own.That’s not all. Guess who else shows up?
The production also features a series of specially scripted guest video cameos by Jim Cramer, host of CNBC’s “Mad Money.”
And here I was worried that Cramer was going to go Hollywood!
Burleigh Grimes is playing at New World Stages/Stage 3, 340 West 50th Street, between 8th and 9th Avenues. -
Penny Stock Buyer Winds up CEO
Posted by Eddy Elfenbein on June 13th, 2006 at 6:26 amA penny-stock investor’s unusual path to the CEO’s office.
-
The NYT vs. Math
Posted by Eddy Elfenbein on June 12th, 2006 at 9:48 pmA recent New York Times article makes a big deal about the one-week falloff of the Dow. Robert Ferguson, a newbie blogger, shows that it’s really no big deal (warning: math ahead):
Roughly, the DJI has a mean weekly return of about zero. Its annual standard deviation of return is about 15%, more or less. Assuming weekly returns are independent as an approximation, a 15% annual volatility corresponds to a 2.08% weekly volatility. A weekly return of -3.2% is only 1.54 standard deviations from the mean.
Assuming normality, the probability of a result 1.54 standard deviations below the mean or worse is 6.2%. This sounds pretty low, but Mr. Sommer did not pick this week at random. He scoured recent history for the worst week and found that it was the worst since about a year ago.
The real question is how likely is at least one weekly decline of at 3.2% or worse in a year.
Roughly this size negative return or worse should occur about three times a year (0.062*52=3.2). In fact, the probability that it would occur at least one week a year is about (1-(1-0.062)^52)=0.964, or about 96.4%.
Something that is expected to happen at least once a year with probability 96.4% is not unusual.
-
Archives
- June 2026
- May 2026
- April 2026
- March 2026
- February 2026
- January 2026
- December 2025
- November 2025
- October 2025
- September 2025
- August 2025
- July 2025
- June 2025
- May 2025
- April 2025
- March 2025
- February 2025
- January 2025
- December 2024
- November 2024
- October 2024
- September 2024
- August 2024
- July 2024
- June 2024
- May 2024
- April 2024
- March 2024
- February 2024
- January 2024
- December 2023
- November 2023
- October 2023
- September 2023
- August 2023
- July 2023
- June 2023
- May 2023
- April 2023
- March 2023
- February 2023
- January 2023
- December 2022
- November 2022
- October 2022
- September 2022
- August 2022
- July 2022
- June 2022
- May 2022
- April 2022
- March 2022
- February 2022
- January 2022
- December 2021
- November 2021
- October 2021
- September 2021
- August 2021
- July 2021
- June 2021
- May 2021
- April 2021
- March 2021
- February 2021
- January 2021
- December 2020
- November 2020
- October 2020
- September 2020
- August 2020
- July 2020
- June 2020
- May 2020
- April 2020
- March 2020
- February 2020
- January 2020
- December 2019
- November 2019
- October 2019
- September 2019
- August 2019
- July 2019
- June 2019
- May 2019
- April 2019
- March 2019
- February 2019
- January 2019
- December 2018
- November 2018
- October 2018
- September 2018
- August 2018
- July 2018
- June 2018
- May 2018
- April 2018
- March 2018
- February 2018
- January 2018
- December 2017
- November 2017
- October 2017
- September 2017
- August 2017
- July 2017
- June 2017
- May 2017
- April 2017
- March 2017
- February 2017
- January 2017
- December 2016
- November 2016
- October 2016
- September 2016
- August 2016
- July 2016
- June 2016
- May 2016
- April 2016
- March 2016
- February 2016
- January 2016
- December 2015
- November 2015
- October 2015
- September 2015
- August 2015
- July 2015
- June 2015
- May 2015
- April 2015
- March 2015
- February 2015
- January 2015
- December 2014
- November 2014
- October 2014
- September 2014
- August 2014
- July 2014
- June 2014
- May 2014
- April 2014
- March 2014
- February 2014
- January 2014
- December 2013
- November 2013
- October 2013
- September 2013
- August 2013
- July 2013
- June 2013
- May 2013
- April 2013
- March 2013
- February 2013
- January 2013
- December 2012
- November 2012
- October 2012
- September 2012
- August 2012
- July 2012
- June 2012
- May 2012
- April 2012
- March 2012
- February 2012
- January 2012
- December 2011
- November 2011
- October 2011
- September 2011
- August 2011
- July 2011
- June 2011
- May 2011
- April 2011
- March 2011
- February 2011
- January 2011
- December 2010
- November 2010
- October 2010
- September 2010
- August 2010
- July 2010
- June 2010
- May 2010
- April 2010
- March 2010
- February 2010
- January 2010
- December 2009
- November 2009
- October 2009
- September 2009
- August 2009
- July 2009
- June 2009
- May 2009
- April 2009
- March 2009
- February 2009
- January 2009
- December 2008
- November 2008
- October 2008
- September 2008
- August 2008
- July 2008
- June 2008
- May 2008
- April 2008
- March 2008
- February 2008
- January 2008
- December 2007
- November 2007
- October 2007
- September 2007
- August 2007
- July 2007
- June 2007
- May 2007
- April 2007
- March 2007
- February 2007
- January 2007
- December 2006
- November 2006
- October 2006
- September 2006
- August 2006
- July 2006
- June 2006
- May 2006
- April 2006
- March 2006
- February 2006
- January 2006
- December 2005
- November 2005
- October 2005
- September 2005
- August 2005
- July 2005
 Eddy Elfenbein is a Washington, DC-based speaker, portfolio manager and editor of the blog Crossing Wall Street. His