-
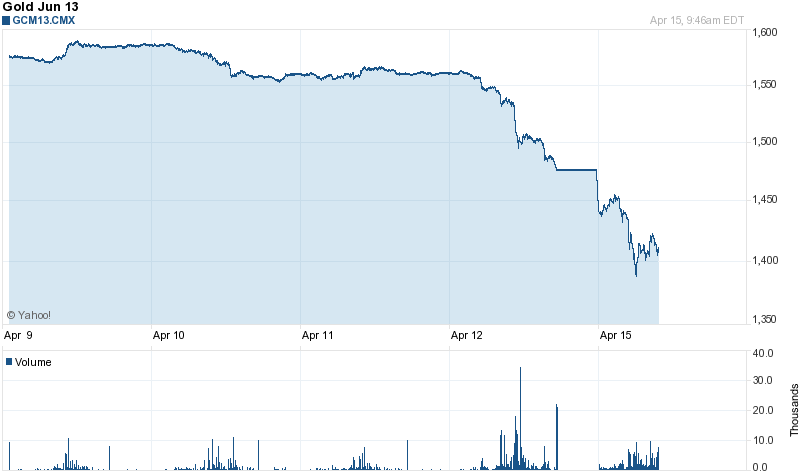
Gold Is Crashing
Posted by Eddy Elfenbein on April 15th, 2013 at 9:59 amThe yellow is getting slammed again. Gold has been as low as $1,385 an ounce this morning.
-
New Ticker Symbol for WEX Inc.
Posted by Eddy Elfenbein on April 15th, 2013 at 9:45 amJust a reminder that WEX Inc. no longer trades under WXS. The new ticker is WEX. This may cause some confusion today with quote services.
-
Morning News: April 15, 2013
Posted by Eddy Elfenbein on April 15th, 2013 at 7:46 amJapan Gets Calls From U.S. to Europe Not to Drive Down Yen
Soft China GDP Explains Slow Commodity Import Growth
Gold Price Falls Below $1,400 For First Time Since March 2011; Chinese Figures Weigh On Stocks
Greece on Track to Receive Next Aid Tranche
Europe to Face Washington Disbelief With Economic Claims
Treasury Bears in Uphill Battle Against BOJ, Fed
EVERYONE Should Be Thrilled By The Gold Crash
Bitcoin Mining Is Not A Real World Environmental Disaster
Dish Launches $25.5 Billion Bid for Sprint
Thermo Life Technology Bid Said to Exceed $75 Per Share
EADS In Talks To Buy Back 1.56 Percent From French State
Intel Tries to Secure Its Footing Beyond PCs
Liberty Global’s $15.8 Billion Virgin Media Deal Cleared In EU
Joshua Brown: Q1 Earnings Season Kickoff – Here’s What You Should Know
Jeff Miller: Weighing the Week Ahead: A Critical Eye on Earnings
Be sure to follow me on Twitter.
-
Remarkable Stats for the Dow
Posted by Eddy Elfenbein on April 14th, 2013 at 7:01 pmThe invaluable FRED database run by the Federal Reserve Bank of St. Louis recently added Saturday closings to its data series of daily closings for the Dow Jones Industrial Average. The data runs all the way back to the beginning of the index in 1896. I’ve often found the numbers going back to the beginning but they usually exclude Saturday trading which ended in 1952, so this find has a datahead like me pretty excited.
I downloaded all the numbers and crunched some interesting results. I’ll present some here and add more later on during the week.
First, let’s look at average daily returns by Days of the Week:
Day Count Average Daily Gain Monday 5,662 -0.0961% Tuesday 5,904 0.0388% Wednesday 5,963 0.0484% Thursday 5,867 0.0221% Friday 5,845 0.0599% Saturday 2,601 0.0525% Mondays have been the worst day by far, but Mondays performed a lot better after Meltdown Monday in 1987. Consider this fact: Since November 13, 1987, Monday and Tuesdays combined are up 595.68% for the Dow, while Wednesday, Thursday and Friday combined are up 9.72%. For more a quarter of a century, nearly the Dow’s entire gain has come during the first 40% of the week.
Here are the cumulative gains by each day of the week. With my version of Excel, I could only make a chart going back to 1912.
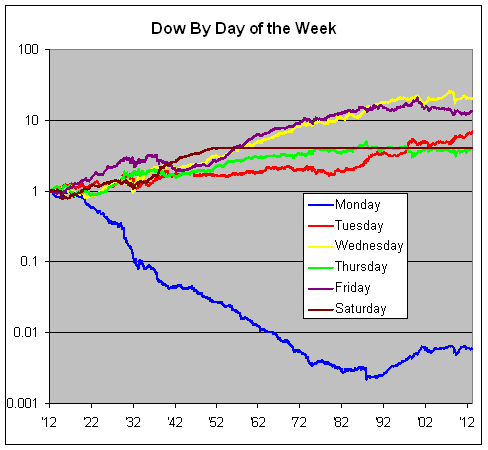
You can see how poorly Monday has done, although it’s done much better since 1987. Tuesday has also improved.
I’m struck by how poorly the other three days have done in recent years. Going back to July 1995, all the Thursdays combined are flat; the same for Fridays going back to April 1983, and Thursdays haven’t made a single dime for the Dow going back to January 1976. Since March 22, 1979, Tuesdays have returned more than the other four days of the week combined.
After 117 years, there have been 31,842 trading days. The average daily gain is 0.02458%. In simpler terms, that’s roughly a one penny gain each day for every $40 invested. The standard deviation is 1.10018%. This means that the Dow swings, on average, 45 times its average daily gain. Think about that at the end of each trading day.
The Dow’s total gain after 117 years is equal to its best 98 days combined, or its best 0.3%, those 98 days when the index gained 4.54% or more. Fifty-four of those days came between 1929 and 1933, and ten more came during a six-month span from late 2008 to early 2009. There hasn’t been one since.
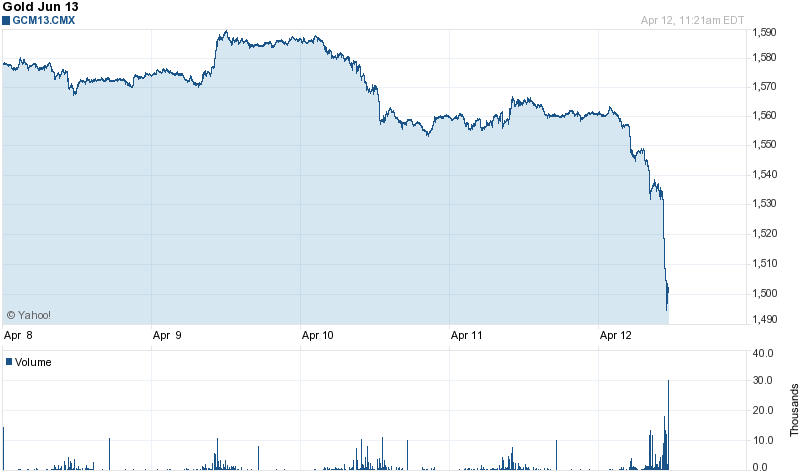
Gold Drops Below $1,500
Posted by Eddy Elfenbein on April 12th, 2013 at 11:50 amGold is getting crushed today. The metal is currently down over $60 per ounce. For the first time since July 5, 2011, gold fell below $1,500 per ounce today. On September 6, 2011, gold got as high as $1,923.70. At the same time, the S&P 500 was at 1,165.
Market Drops on Weak Retail Sales
Posted by Eddy Elfenbein on April 12th, 2013 at 11:35 amThe stock market is lower this morning after the Commerce Department reported weak retail sales numbers for March. The expiration of the payroll tax holiday is probably taking a bite out of consumer spending. Last month, retail sales fell by 0.4% which is the lowest in nine months. Another report showed that consumer confidence for April dropped to 72.3 from 78.6 last month.
Sales at automobile and parts dealers fell 0.6 percent after a 1.3 percent gain the prior month, today’s report showed. Industry figures, which are the ones used to calculate gross domestic product, showed car and light truck sales dipped in March, falling to a 15.2 million annual rate from 15.3 million the prior month, according to Ward’s Automotive Group. The first quarter sales average was the highest since 2008.
Retail sales excluding autos decreased 0.4 percent, today’s report showed. They were projected to be little changed, according to the Bloomberg survey median.
The retail sales figures, which aren’t adjusted for prices, reflected less expensive gasoline. The average cost of a gallon of regular fuel at the pump dropped about 13 cents to end last month at $3.63, the first decrease in March since AAA, the biggest U.S. auto group, began keeping data in 2004. Filling- station receipts dropped 2.2 percent last month, according to the Commerce Department data.
The retail sales category used to calculate GDP, which excludes auto dealers, building-material stores and service stations, sales fell 0.2 percent after a 0.3 percent increase in the previous month.
In two weeks, we’ll get our first look at Q1 GDP. Wall Street currently expects that the economy grew by 3%.
CWS Market Review – April 12, 2013
Posted by Eddy Elfenbein on April 12th, 2013 at 7:04 am“The main purpose of the stock market is to make
fools of as many men as possible.” – Bernard BaruchThat’s so true, Bernie. The market’s been making fools of lots of folks this year. Despite the lousy jobs report from last week, the stock market continues to march ever higher.
The market has easily jumped over every hurdle the bears have thrown its way. Fiscal Cliff? No problem. Debt ceiling? Not a chance. Cyprus? Trader, please.
Even the fabled Great Rotation turned out to be a dud. Investors seem to be buying both stocks and bonds while they’re leaving commodities behind. On Thursday, the S&P 500 jumped as high as 1,597.35. Dear lord, we’re nearly at 1,600, and I thought I was being bold last year when I predicted the index would break 1,500 sometime early in 2013. Since the last major low shortly after the election, the S&P 500 has added more than 18%. The index has been above its 50-day moving average every day so far this year.
Let’s enjoy the good times, but always be mindful that the market gods are a fickle bunch. I urge all investors to be conservative and focus on top-quality stocks such as the ones you can find on our Buy List.
In this week’s CWS Market Review, we’ll look at the good earnings report from Bed Bath & Beyond ($BBBY). The home furnisher beat earnings by a penny, and the shares gapped up on Thursday morning…and then back down on Thursday afternoon. Also on Thursday, Ross Stores ($ROST) jumped nearly 6% after the deep discounter said that earnings would come in above expectations. I really like Ross Stores right now. Later on, I’ll highlight the upcoming earnings reports from Microsoft ($MSFT). But first let’s look at the good news from Bed Bath & Beyond.
Buy Bed Bath & Beyond up to $68 per Share
After the close on Wednesday, Bed Bath & Beyond ($BBBY) reported fourth-quarter earnings of $1.68 per share. This was for the months of December, January and February quarter, so it included the important holiday season. Comparable-store sales rose by a healthy 2.5%. For the entire year, the company earned $4.56 per share. One small note: BBBY’s 2012 fiscal year was 53 weeks long, so that slightly distorts some of the comparisons. I like BBBY a lot, and this earnings report confirms my view that it’s a well-run outfit.
Now that BBBY’s fiscal year is over, this is a good time to go back to last June and remind ourselves of how irrational traders can be. On June 21st, BBBY got slammed for a 17% loss after the company gave an earnings warning that ultimately amounted to 1.5%. At the time, Wall Street had been expecting full-year earnings of $4.63 per share which represented 14% growth over 2011. Instead, BBBY said that earnings growth would be in “the high single digits to low double digits.” Disaster, right? You would have thought so from listening to panicked investors. But as I mentioned before, BBBY earned $4.56 per share for 2012, which was up 12% for the year, and only 1.5% below Wall Street’s original forecast. Yet that was the news that caused a 17% riot in June.
In December, BBBY told us that Q4 earnings would range between $1.60 and $1.67 per share. The market also didn’t take that news well, since Wall Street’s consensus had been for $1.75 per share. So the good news for this earnings report was that BBBY exceeded its own range for Q4. Since the market greatly overreacted to BBBY’s lower guidance, the upshot for us is that the shares have rebounded impressively, and BBBY is currently the fifth-best-performing stock on our Buy List.
For Q1, Bed Bath & Beyond sees earnings coming in between 88 cents and 94 cents per share. Notice how much lower the profit is in Q1 compared with Q4. Retailers live and die by the holidays. Wall Street had been expecting 95 cents per share, and frankly I had been expecting a little more as well. For the full year, the company sees earnings rising “by a mid single to a low double digit percentage range.” If we assume that means 4% to 11%, that gives us a range of $4.74 to $5.06 per share, and Wall Street had been expecting $5.06 per share. That’s decent growth.
On Thursday, BBBY jumped up to a 4.3% gain in the morning but gradually retreated the rest of the day. The stock eventually closed at $64 for a 2.3% loss. Despite the intra-day wobbles, I really like what I’m seeing at BBBY. The company has zero debt, tons of cash and a share-purchase program that actually reduces the number of shares outstanding. Don’t let the volatility rattle you. I’m raising my Buy Below price to $68 per share.
Ross Stores Says It Will Exceed Guidance
Three weeks ago, Ross Stores ($ROST) reported very good results for their fiscal fourth quarter, and the shares rallied. This wasn’t a big surprise to anyone who follows the company. Ross is a solid business, and it has a great track record of delivering strong earnings. On the Q4 conference call, Ross said that Q1 earnings should come in between $1 and $1.04 per share. That’s up from 93 cents per share for Q1 of 2012.
Well, it looks like business at Ross is going better than expected. On Thursday, they said that April comparable-store sales rose by 2%. Internally, they were expecting a decrease between 1% and 2%. Thanks to the good sales numbers, Ross said they should exceed the upper limit of their previous guidance.
Traders loved that news. At one point on Thursday, shares of ROST touched $65. At the closing bell, the shares settled at $63.80 for a 5.9% gain. Earnings for Q1 won’t come out until the middle of next month, but I don’t want folks left behind. I’m raising my Buy Below on Ross to $70 per share.
Upcoming Earnings Reports
Many other Buy List stocks are doing well. I was pleased to see Ford Motor ($F) break out to a two-month high. The company reported excellent sales for March. Our healthcare stocks have been doing especially well. Both Medtronic ($MDT) and Stryker ($SYK) just hit new 52-week highs. Stryker is our top-performing stock on the year, with a 21.9% YTD gain, and Medtronic comes in at #4 with a 16.3% gain. Healthcare stocks have done well as the market has taken on an increasingly defensive posture, which is unusual for such a robust rally. Outside of healthcare, Fiserv ($FISV), the financial-services tech firm, also hit a new 52-week high. I was also happy to see quiet little Moog ($MOG-A) come oh so close to making a new 52-week high.
I’m writing this week’s newsletter early on Friday morning. Later today our two big banking stocks, JPMorgan ($JPM) and Wells Fargo ($WFC), are due to report earnings, and the results are probably out by the time you’re reading this. Nevertheless, I continue to expect great things from JPM and WFC. Over the last decade, JPM has traded for an average of two times its tangible book value. Right now, it’s only at 1.3 times. Wells has beaten earnings for the last five quarters in a row.
We’re coming up to a slow patch in the middle of a very busy earnings season. The only earnings report on tap for next week will be from Microsoft ($MSFT). However, the week after next will be jammed packed with Buy List earnings reports. Let me add that this is going on the info I have right now. Earnings reporting dates often change, and many companies aren’t very forthcoming with that information.
Next Thursday, April 18th, Microsoft will release its earnings for the first three months of the year. That is the third quarter of their fiscal year. The last earnings report, which was in January, beat estimates by one penny per share. This time around, the consensus is that Microsoft will earn 76 cents per share. That’s a 26.7% increase over last year’s fiscal Q3. I think there’s a very good chance Microsoft will beat earnings again.
Shares of Microsoft had been rallying recently, but that upturn abruptly ended on Thursday when the bears skinned MSFT for a 4.4% loss. The catalyst was a report that PC sales have been dismal lately. Goldman downgraded the stock to “Sell.” The good news was that the shares bounced off the 200-day moving average, so the stock has defenders out there. The stock is going for just over nine times next year’s earnings. I’m expecting a big dividend increase in September. Microsoft remains a buy up to $30.
Washington’s Sequester Nails Harris
After the closing bell on Thursday, Harris Corp. ($HRS) dropped a bomb on investors. The company said that purchase delays due to the federal government’s sequester will take a bite out of their fiscal Q3 earnings (January, February and March). Harris’s CEO said, “Operating under a continuing resolution followed by sequestration and the related indecision surrounding how sequestration budget cuts will be implemented has delayed U.S. Government procurement decisions and reduced spending.” Ugh.
Harris said they’re expecting to earn $1.12 per share for fiscal Q3 which is 14 cents below the Street’s consensus. They previously had said that full-year earnings would range between $5.00 and $5.20 per share. But due to the delays, Harris now expects $4.60 to $4.70 per share. The CEO also said, “The uncertainty is unprecedented, and the political budgetary process is progressing slowly. As a result, we are not anticipating a return to typical procurement processes before the end of our fiscal year.” Full-year revenue is expected to fall by 6% to 7%.
Harris said that they’ll take a charge in the fourth quarter so they can streamline operations, consolidate facilities and pay down debt. That’s a smart move. The stock got dinged for a 7% loss in after-hours trading. This is very frustrating news for Harris, especially since it doesn’t reflect poor execution on their part. The company will report earnings on April 30th. For now, I want to take a wait-and-see approach. I’m lowering my Buy Below to $45 per share.
That’s all for now. Stay tuned for more earnings next week. Microsoft reports on Thursday. Don’t forget that on Monday, WEX Inc. will change its ticker symbol to WEX. The old symbol was WXS. On Tuesday, the government will release important reports on inflation and industrial production. Be sure to keep checking the blog for daily updates. I’ll have more market analysis for you in the next issue of CWS Market Review!
– Eddy
Morning News: April 12, 2013
Posted by Eddy Elfenbein on April 12th, 2013 at 6:38 amLondon Push to Tame Foreign Oligarchs May Trim City IPOs
Future Looks Bleaker Than Anticipated in Cyprus, Its Creditors Claim
Russia Skips Hybrids in Push for Cars Using Natural Gas
India Industrial Output Expands In February By 0.6 Percent
IMF Trims U.S. Growth Outlook in Draft Report Citing Fiscal Cuts
Economy Bears Turn Bulls Seeing 3% GDP for U.S. Few Saw in 2012
Analysts Discuss Paradigm Shift: Breaking Up Banks
JPMorgan Profit Increases 33%, Beats Estimate on Mortgage Fees
JAB to Buy Coffee Maker for $10 Billion
Checking Into What’s Behind Foursquare’s $41 Million Infusion
Infosys Shares Plunge On Weak Outlook
Former KPMG Partner Is Charged With Insider Trading
Roger Nusbaum: “Beating the Market” Makes for an Incomplete Discussion
Cullen Roche: Thoughts on the “Value” of Fiat Money
Be sure to follow me on Twitter.
Ross Stores Jumps on Strong Sales
Posted by Eddy Elfenbein on April 11th, 2013 at 10:27 amThe S&P 500 broke above 1,593 this morning. We had more good news from our Buy List stocks. Thanks to its good earnings report, Bed Bath & Beyond ($BBBY) got up to $68.30 today, although it’s pulled back since then.
Ford Motor ($F) is up on news of strong sales out of China. The shares are close to making a two-month high.
Our big winner for today is Ross Stores ($ROST). The discount retailer is currently up 7% thanks to a better-than-expected sales report for March. Same-stores sales jumped 2% last month. Ross had been expecting a decrease between 1% and 2%. Ross also said that it expects to top its previous earnings forecast of $1 to $1.04 per share. For April, Ross sees same-store sales rising by 5% to 6%.
Our bum stock today is Microsoft ($MSFT) which had been doing well. The shares are currently down about 4%. The catalyst for today’s sell-off was news of lousy PC sales:
On Wednesday, the research firm IDC reported that worldwide PC shipments declined 13.9 percent during the first three months of the year compared with the same period a year earlier.
To put those numbers into perspective, that is the most severe decline in the PC market since IDC began tracking the business almost two decades ago and almost double the rate of decline that the firm was expecting for the quarter.
Gartner, another research firm, had estimates that were only slightly better, showing an 11.2 percent decline in PC shipments for the first quarter.
Microsoft is due to report earnings next week.
Does the Stock Market Really Return 7% Per Year?
Posted by Eddy Elfenbein on April 11th, 2013 at 9:31 amI want to revisit the Ibbotson data again to look at the often-cited claim that the stock market has historically returned (capital gains and dividends) 7% per year greater than inflation. This claim has been repeated so much by Jeremy Siegel that some have called it Siegel’s Constant.
Here’s the long-term real return in blue, with a 6.9% trendline in black.
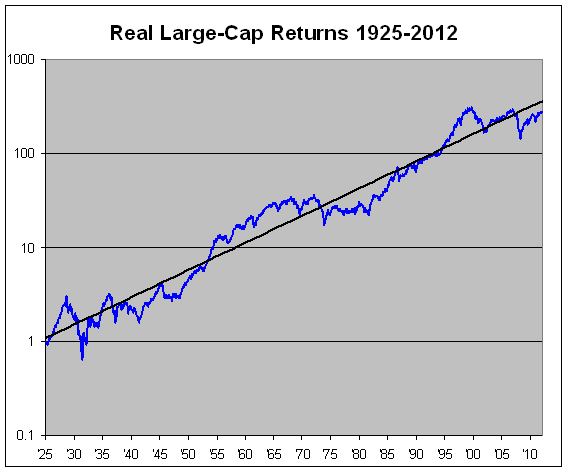
I think this is a dangerous idea for several reason. For one, the long-term real return of stocks is no longer 7%. Thanks to two giant market crashes in less than a decade, the long-term number has fallen to 6.67% (that’s since 1925). Furthermore, much of that gained comes from the post-war boom. Over that last 50 years, that real return has been a much more reasonable 5.45%.
Another problem is that this data series is highly volatile. Too volatile to call the results a constant. There have been long periods when investors haven’t made a dime from the stock market in real terms.
Looking at the data, there seem to be periods of 15 to 20 years when stocks boom, or when they bust. Notice how the blue line runs above or below the black line for long periods at a time. Still, I would say that we don’t have enough data to make the claim that the stock market does this regularly.
Here’s how the market has done versus its long-term trend. The chart below is the same as the chart above but it shows the blue line divided by the black line. When the line is rising, stocks are outperforming their long-term average. When it’s falling, stocks are trailing their long-term average. I chose a 6.9% trend line because that seems to sync up the three major peaks.
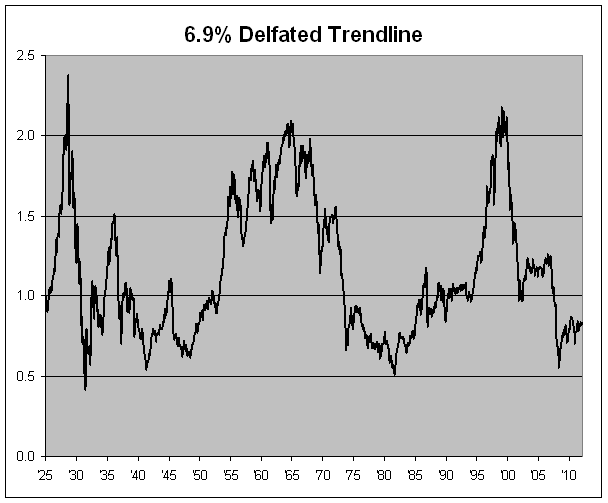
What’s interesting is that the chart above appears to be similar (though not exact) to a long-term chart of price/earnings ratios. This shouldn’t be a surprise since long-term growth in corporate profits doesn’t vary very much.
- Load More
China has 105 cities with over 1 million people.
In 1940, Ida May Fuller got the first social security check. The check number was 00-000-001. She lived to 100 and collected $22,888 in benefits.
Airline fares are cheaper than they were 25 years ago.
-
-
Archives
- May 2025
- April 2025
- March 2025
- February 2025
- January 2025
- December 2024
- November 2024
- October 2024
- September 2024
- August 2024
- July 2024
- June 2024
- May 2024
- April 2024
- March 2024
- February 2024
- January 2024
- December 2023
- November 2023
- October 2023
- September 2023
- August 2023
- July 2023
- June 2023
- May 2023
- April 2023
- March 2023
- February 2023
- January 2023
- December 2022
- November 2022
- October 2022
- September 2022
- August 2022
- July 2022
- June 2022
- May 2022
- April 2022
- March 2022
- February 2022
- January 2022
- December 2021
- November 2021
- October 2021
- September 2021
- August 2021
- July 2021
- June 2021
- May 2021
- April 2021
- March 2021
- February 2021
- January 2021
- December 2020
- November 2020
- October 2020
- September 2020
- August 2020
- July 2020
- June 2020
- May 2020
- April 2020
- March 2020
- February 2020
- January 2020
- December 2019
- November 2019
- October 2019
- September 2019
- August 2019
- July 2019
- June 2019
- May 2019
- April 2019
- March 2019
- February 2019
- January 2019
- December 2018
- November 2018
- October 2018
- September 2018
- August 2018
- July 2018
- June 2018
- May 2018
- April 2018
- March 2018
- February 2018
- January 2018
- December 2017
- November 2017
- October 2017
- September 2017
- August 2017
- July 2017
- June 2017
- May 2017
- April 2017
- March 2017
- February 2017
- January 2017
- December 2016
- November 2016
- October 2016
- September 2016
- August 2016
- July 2016
- June 2016
- May 2016
- April 2016
- March 2016
- February 2016
- January 2016
- December 2015
- November 2015
- October 2015
- September 2015
- August 2015
- July 2015
- June 2015
- May 2015
- April 2015
- March 2015
- February 2015
- January 2015
- December 2014
- November 2014
- October 2014
- September 2014
- August 2014
- July 2014
- June 2014
- May 2014
- April 2014
- March 2014
- February 2014
- January 2014
- December 2013
- November 2013
- October 2013
- September 2013
- August 2013
- July 2013
- June 2013
- May 2013
- April 2013
- March 2013
- February 2013
- January 2013
- December 2012
- November 2012
- October 2012
- September 2012
- August 2012
- July 2012
- June 2012
- May 2012
- April 2012
- March 2012
- February 2012
- January 2012
- December 2011
- November 2011
- October 2011
- September 2011
- August 2011
- July 2011
- June 2011
- May 2011
- April 2011
- March 2011
- February 2011
- January 2011
- December 2010
- November 2010
- October 2010
- September 2010
- August 2010
- July 2010
- June 2010
- May 2010
- April 2010
- March 2010
- February 2010
- January 2010
- December 2009
- November 2009
- October 2009
- September 2009
- August 2009
- July 2009
- June 2009
- May 2009
- April 2009
- March 2009
- February 2009
- January 2009
- December 2008
- November 2008
- October 2008
- September 2008
- August 2008
- July 2008
- June 2008
- May 2008
- April 2008
- March 2008
- February 2008
- January 2008
- December 2007
- November 2007
- October 2007
- September 2007
- August 2007
- July 2007
- June 2007
- May 2007
- April 2007
- March 2007
- February 2007
- January 2007
- December 2006
- November 2006
- October 2006
- September 2006
- August 2006
- July 2006
- June 2006
- May 2006
- April 2006
- March 2006
- February 2006
- January 2006
- December 2005
- November 2005
- October 2005
- September 2005
- August 2005
- July 2005
 Eddy Elfenbein is a Washington, DC-based speaker, portfolio manager and editor of the blog Crossing Wall Street. His