-
Procter & Gamble Lowers Guidance. Again.
Posted by Eddy Elfenbein on June 20th, 2012 at 11:35 amOne of Wall Street’s most respected blue chips announced more bad news today. Procter & Gamble ($PG) had previously told us to expect fiscal fourth-quarter earnings to range between 79 cents and 85 cents per share. Now P&G says that range is 75 cents to 79 cents per share.
The market is not pleased as the shares are currently down about 3.3% today. Procter & Gamble is already in Wall Street’s doghouse. In April, they delivered lousy earnings and seemed to have a litany of excuses. Analysts were quick to point out that P&G’s competitors seemed to be doing a good job of avoiding these issues:
“It strikes me that from an execution perspective, P&G isn’t delivering,” said Citigroup analyst Wendy Nicholson.
“There’s so many excuses: Not our fault, competition didn’t follow the pricing; not our fault, Venezuela changed; not our fault, the developed consumer isn’t robust,” she continued. “And I just say to myself, God, where is the mea culpa?”
In April, P&G lowered their full-year forecast (which ends at the end of June) from $3.93 – $4.03 per share to $3.82 – $3.88 per share. Today’s news brings the range down to $3.78 – $3.82 per share.
For 2012, P&G expects core earnings to rise by mid-single digits. Let’s say that means 5%. If the company makes $3.80 per share this year, then we should expect earnings of $3.99 per share for 2013. Wall Street had been expecting $4.11 per share. My simple stock valuation method gives P&G a fair value of $46 per share which means that the current price is more than 30% too much. Stay away from P&G.
-
Today is Fed Day
Posted by Eddy Elfenbein on June 20th, 2012 at 11:09 amToday is Fed day. At 12:30, the Federal Reserve will release its latest policy statement. I don’t expect any major change, but traders will closely scrutinize today’s statement for any hint of more quantitative easing. I’m not holding my breath.
Our Buy List continues to do well. Reynolds American ($RAI) is at another new high. After the close, Bed Bath & Beyond ($BBBY) will report its earnings. I’m expecting good news.
The market has an odd wait-and-see attitude today. Stocks aren’t doing much of anything.
-
Morning News: June 20, 2012
Posted by Eddy Elfenbein on June 20th, 2012 at 8:10 amHollande Says Europe Mulling Having ESM Buy Italian Bonds
Hollande Wants French Fin Min To Become Eurogroup Chief – Report
Greece May Still Become An Emerging Market – Again
Wiggle Room Emerges in Greece’s Bailout Deal
BOE Seen Likely to Increase Stimulus
Brent Premium To Dubai Oil Narrows To 21-Month Low
Fed Seen Extending Operation Twist While Avoiding Bond Buying
Could Congress Compromise on Taxmageddon?
Dimon, Testifying Before House, Stays on Message
Europe Debt Crisis Restrains Rebound In Japan’s Exports
Walgreen Shares Fall On Alliance Boots Deal
FedEx Gains After Pledging Cuts As Economy Presses Profit
Phil Pearlman: Social Momentum and Price Momentum in Arena Pharmaceuticals
Be sure to follow me on Twitter.
-
Oracle’s Q2 Guidance: 51 to 55 Cents Per Share
Posted by Eddy Elfenbein on June 19th, 2012 at 2:58 pmHere’s the key part from Oracle’s conference call — their guidance for Q2:
I’m going to move to the guidance. I will say in advance, obviously, I do read the same newspapers you all do and do keep up with the news of the economy, et cetera, and so I have tried to keep that in mind in my guidance regardless of our achievements in the fourth quarter. So assuming exchange rates remain where they are at current levels, which right now is a negative 5% currency impact on license growth rate and on total revenue growth rate, our guidance for Q1 is as follows. New software license revenue growth on a non-GAAP basis is expected to range, these are in constant dollars, 5% to 15% in constant currency or 10 — 0% to 10% on current rates. On a GAAP basis, we expect new software license growth range to be anywhere from 4% to 14% in constant currency and negative 1% to positive 9% under current rates. Hardware product revenue growth is expected to range from negative 12% to negative 2% in constant currency and negative 17% to negative 7% in current rates, and that doesn’t include the hardware support revenue.
Total revenue growth on a GAAP and non-GAAP basis is expected to range from 3% to 6% in constant currency and negative 2% to positive 1% in current rate. The non-GAAP EPS is expected to be anywhere from $0.54 to $0.58 in constant currency or $0.51 to $0.55 at current rate, up from $0.48 last year. GAAP EPS is expected to be $0.40 to $0.44 in constant currency and $0.37 to $0.41 at current rate. This guidance assumes a GAAP and non-GAAP tax rate of 23.5%. Of course, it may end up being different.
I suspect that Oracle is being conservative with this guidance.
-
It’s a Big Stock World….
Posted by Eddy Elfenbein on June 19th, 2012 at 2:06 pm…the rest of us are just paying rent. The biggest stocks on Wall Street have been outperforming everyone else at a steady clip for over a year now.
The graph below shows the S&P 100 ($OEX), which is the largest 100 stocks in the S&P 500, in black. There’s also the S&P 500 in gold and the small-cap Russell 2000 ($RUT) in blue. Large stocks have been leading the market since May 28, 2011.
Part of this is what we’ve seen in the bond market — a rush away from risk. Just as bond investors have pushed Treasury yields to all-time lows, stock investors have fled to the most secure names which tend to be the largest stocks on the market.
“A lot of these companies have exposure to Europe and that certainly is a factor to consider,” Todd said in a June 14 phone interview. “Depending on what happens in the market and with Europe, if it doesn’t get resolved, they’ll still get hammered.”
The biggest companies in the S&P 500 derive more business from around the world, getting about 49 percent of sales from outside the Americas, data compiled by Bloomberg show. That compares with the 46 percent for the broader index.
S&P 100 stocks may prove more resilient than their smaller peers during a slower economic expansion because they are more established companies that don’t depend on high-growth markets for their main business. The U.S. advance was led by a 42 percent surge in Apple this year, a rally that boosted its market value by $160.4 billion, more than the individual values of Oracle Corp. and JPMorgan Chase & Co. Bank of America climbed 42 percent, leading financial companies in the S&P 500 to the index’s fourth-biggest advance.
(…)
Dividend yields in the S&P 100 reached 2.3 percent this month, the highest of 2012, while the valuation has declined to 12.7 times annual earnings, 31 percent below the average since 1997. That compares with profit multiples of 28.9 in the Russell 2000 Index (RTY) of small-cap stocks and 17.2 in the S&P Midcap 400 Index. The large-cap gauge is up almost twice as much as both measures this year.
-
The Return of Financial Dividends
Posted by Eddy Elfenbein on June 19th, 2012 at 10:39 amDividends are slowly making a comeback, and they’re even returning to the financial sector. Thanks to the TARP program, many financials firms weren’t allowed to pay dividends, or they cut them down to a trivial amount.
The Financial Sector ETF ($XLF) just paid out its June dividend of 6.8 cents per share. That’s a 28% increase over the 5.3 cents from one year ago. This is still well below the peak when the XLF regularly paid out more than 20 cents every quarter.
Profits are returning and so are dividends. If all goes well, I think the XLF could pay out 30 cents per share this year. At $15, that’s a yield of 2% which is lower than many stocks. However, the XLF has the ability to increase its dividends at a rapid clip for the next few years.
-
Oracle Jumps Thanks to Earnings Report
Posted by Eddy Elfenbein on June 19th, 2012 at 9:55 amThe stock market just broke above 1,350 for the first time since May 14th. This could be the fourth up day in a row.
The good economic news is that housing starts rose last month. The Commerce Department said that 3.2% more single-family homes were started in May. The figure for April was revised higher. The very volatile Homebuilder ETF ($XHB) is up to $20.72. It was under $13 last October.
Everyone was worried about what would happen if bond yields in Spain broke 7%. They did and they’re going even higher. The yield for Spanish 10-years got as high as 7.27% today. The country just sold a bunch of one-year bills at 5.2% and 18-month bills at 5.35%. At some point, Spain will be the next Greece. The European Central Bank has been able to keep yields down after it flooded Europe with euros. But the impact of that move has faded away.
Thanks to Oracle’s ($ORCL) strong earnings report, the stock is up more than 5% this morning. The company gave first-quarter guidance of 51 to 55 cents per share which strikes me as too low. The Street was at 53 cents per share. On the conference call, Larry Ellison noted that Oracle is the #2 cloud software firm.
Finally, I’ll note that Bed Bath & Beyond ($BBBY) and Reynolds American ($RAI) are both at new fresh 52-week highs this morning.
-
Morning News: June 19, 2012
Posted by Eddy Elfenbein on June 19th, 2012 at 7:31 amEuro Crisis Shifts To Spain As Merkel Faces G-20 Pressure
Spanish Short-Term Borrowing Costs Rise Sharply
German Economic Morale Dive Is Sharpest Since 1998
India’s BPCL Starts Rupee Payments For Iran Oil
Oil Declines A Second Day On Europe Concern, Iran Talks
Time for the Fed to Twist and Shout Again
Fiscal-Cliff Concerns Hurting Economy As Companies Hold Back
Microsoft Unveils Surface Tablet Computer, Taking On IPad
Electronics Retailers Scramble to Adapt to Changing Market
Walgreen to Spend $6.7 Billion on Alliance Boots Stake
Air Products Buys Indura Stake, Expands in Latin America
Morgan Stanley Was ‘Driver’ on Facebook’s Wild IPO Ride
Mark Cuban on His Facebook Shares: ‘I Took a Beating’
Loopholes Abound Despite New Rules
Stone Street: Damodaran: Passive Value Investing – Screening for Bargains (Key Points/Takeaways)
Howard Lindzon: Momentum Monday…Owning what you Hate…Are Verizon and AT&T the New Tobacco Stocks?
Be sure to follow me on Twitter.
-
Oracle Earns 82 Cents Per Share
Posted by Eddy Elfenbein on June 18th, 2012 at 5:11 pmOracle ($ORCL) surprised Wall Street by releasing its earnings report early. For the fiscal fourth quarter, Oracle earned 82 cents per share which is four cents more than Wall Street’s consensus. The company had told us to expect earnings to range between 76 cents and 81 cents per share.
Oracle Corporation today announced fiscal 2012 Q4 GAAP total revenues were up 1% to $10.9 billion, while non-GAAP total revenues were up 1% to $11.0 billion. Both GAAP and non-GAAP new software license revenues were up 7% to $4.0 billion. Both GAAP and non-GAAP software license updates and product support revenues were up 5% to $4.2 billion. Both GAAP and non-GAAP hardware systems products revenues were down 16% to $977 million. GAAP operating income was up 5% to $4.6 billion, and GAAP operating margin was 42%. Non-GAAP operating income was up 5% to $5.5 billion, and non-GAAP operating margin was 50%. GAAP net income was up 8% to $3.5 billion, while non-GAAP net income was up 7% to $4.1 billion. GAAP earnings per share were $0.69, up 11% compared to last year while non-GAAP earnings per share were up 10% to $0.82. GAAP operating cash flow for fiscal year 2012 was $13.7 billion, up 23% compared to last year.
Without the impact of the US dollar strengthening compared to foreign currencies, Oracle’s reported Q4 GAAP earnings per share would have been $0.03 higher at $0.72, up 16%, and Q4 non-GAAP earnings per share would have been $0.04 higher at $0.86, up 15%. Both GAAP and non-GAAP total revenues also would have been up 5%, GAAP new software license revenues would have been up 11%, non-GAAP new software license revenues would have been up 12% and both GAAP and non-GAAP hardware systems products revenues would have been down 13%.
For fiscal year 2012, GAAP total revenues were up 4% to $37.1 billion, while non-GAAP total revenues were up 4% to $37.2 billion. GAAP new software license revenues were up 7% to $9.9 billion. Non-GAAP new software license revenues were up 8% to $9.9 billion. GAAP software license updates and product support revenues were up 10% to $16.2 billion, while non-GAAP software license updates and product support revenues were up 9% to $16.3 billion. Both GAAP and non-GAAP hardware systems products revenues were $3.8 billion. GAAP operating income was up 14% to $13.7 billion, and GAAP operating margin was 37%. Non-GAAP operating income was up 8% to $17.2 billion, and non-GAAP operating margin was 46%. GAAP net income was up 17% to $10.0 billion, while non-GAAP net income was up 10% to $12.5 billion. GAAP earnings per share were $1.96, up 18% compared to last year while non-GAAP earnings per share were up 11% to $2.46.
“Our record-breaking fourth quarter featured several all-time highs for Oracle: new software license sales of $4 billion, total software revenue of $8 billion, total revenue of $11 billion, and EPS of 82 cents,” said Oracle President and CFO, Safra Catz. “For the fiscal year, we also set all-time highs for operating margins of 46%, and operating cash flow of $13.7 billion.”
“Our engineered systems business is now operating at well over a billion dollar revenue run rate,” said Oracle President, Mark Hurd. “For the year, the Exadata, Exalogic, Exalytics, SPARC SuperCluster and the Oracle Big Data Appliance product group grew over 100% year-over-year.”
“The development of Oracle Cloud is strategic to increasing the size and profitability of Oracle’s software business,” said Oracle Chief Executive Officer, Larry Ellison. “Our Oracle Cloud SaaS business is nearly at a billion dollar revenue run rate, the same size as our engineered systems hardware business. The combination of engineered systems and the Oracle Cloud will drive Oracle’s growth in FY 2013.”
The Board of Directors also declared a quarterly cash dividend of $0.06 per share of outstanding common stock. This dividend will be paid to stockholders of record as of the close of business on July 13, 2012, with a payment date of August 3, 2012.
Oracle also announced that its Board of Directors authorized the repurchase of up to an additional $10.0 billion of common stock under its existing share repurchase program in future quarters.
After hours, the stock is up to $28.40.
-
Are We in a Recession?
Posted by Eddy Elfenbein on June 18th, 2012 at 11:16 amFormer President Bill Clinton recently said that the U.S. economy is already in a recession. I view that as more of a political statement rather than an economic one, but let’s explore the question, “Is the U.S. economy currently in a recession?”
The frustrating answer is: we don’t know. To be more scientific, we can say that there’s currently no solid evidence that the U.S. economy is either in a recession or about to go into a recession. Obviously, that can quickly change.
In the most-recent CWS Market Review, I wrote that Wall Street has been paring back its forecasts for Q2 GDP: “Goldman lowered their GDP growth forecast from 1.8% to 1.6%. Morgan Stanley lowered theirs from 2% to 1.8%. JPM dropped theirs to 2% from 2.5%, and BofA Merrill went from 2.4% to 1.9%.” The catalyst was the poor retail sales report.
Let me make a few points. By recession, we mean that the real GDP is actually receding. As in, it’s getting smaller. Oftentimes, people will say that a bad but growing economy is in a recession. Yet we want to stick to the technical definition.
The commonly accepted standard for dating recession comes from the National Bureau of Economic Research (NBER). The media often says that an official recession is two or more consecutive quarters of negative real GDP growth. That’s not correct. This is what NBER looks at when deciding if the economy is expanding or receding:
The Committee does not have a fixed definition of economic activity. It examines and compares the behavior of various measures of broad activity: real GDP measured on the product and income sides, economy-wide employment, and real income. The Committee also may consider indicators that do not cover the entire economy, such as real sales and the Federal Reserve’s index of industrial production (IP). The Committee’s use of these indicators in conjunction with the broad measures recognizes the issue of double-counting of sectors included in both those indicators and the broad measures. Still, a well-defined peak or trough in real sales or IP might help to determine the overall peak or trough dates, particularly if the economy-wide indicators are in conflict or do not have well-defined peaks or troughs.
So the keys are real GDP, employment and income, and we also want to look at sales and industrial production. The problem with looking at the entire economy is that the GDP data series is quarterly. In a perfect world, it would be monthly and highly accurate. Since it’s not, we have to rely on the other indicators listed by NBER.
Recessions and expansions tend to be symmetrical, meaning a sharp recession often leads to a sharp recovery. Shallow recessions lead to shallow recoveries. This time around is different—a sharp recession has led to a very mediocre recovery.
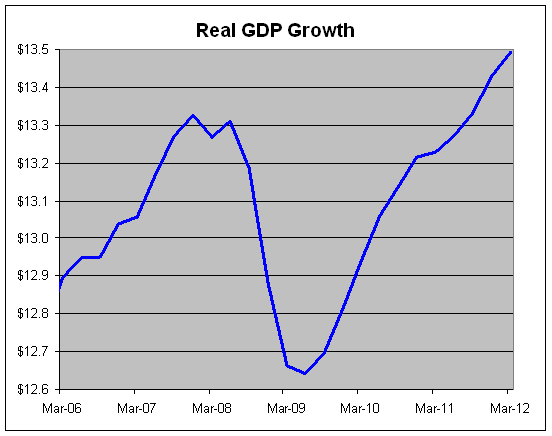
Keeping with NBER’s methodology, let’s first look at real GDP.
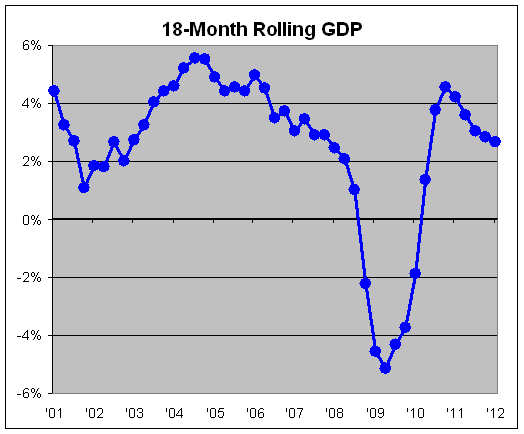
During the recession, real GDP fell for four quarters in a row, and for five out of six. We then had one mildly positive quarter followed by three goods ones. Since then, however, we’ve had very tepid growth. The last seven quarters have averaged less than 2% growth which isn’t enough to push down the unemployment rate. Growth for Q1 came in at just 1.9%.
Interestingly we can see the clearest evidence for a trend by looking at real GDP over the trailing six quarters.
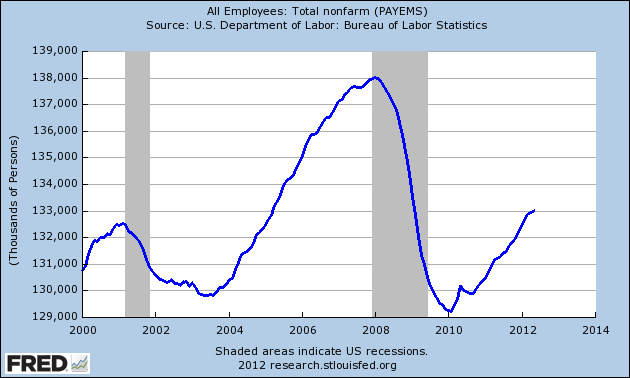
Now let’s look at another NBER factor: economy-wide employment. These are the seasonally adjusted non-farm payroll numbers.
What stands out is the marked contrast between GDP and employment. GDP has already surpassed its peak from before the recession. But we’ve made back less than half the jobs lost during the recession. Moreover, the rate of job gains is slowing. Last month, the economy created just 69,000 jobs. Nearly nine million were lost during the recession. Employment is clearly the weakest part of the economy.
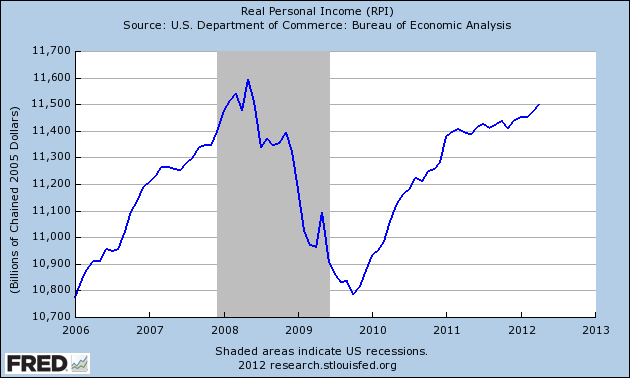
Here’s real personal income. We can see signs of a recovery but the trend dramatically slowed down starting at the beginning of 2011. There’s been a slight uptick recently, but it’s nowhere near the growth rate we saw in 2010.
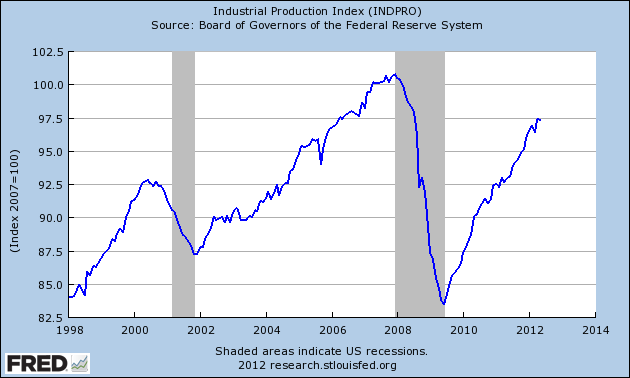
If I wanted to see signs of the economy slowing down, I’d expect to see a sharp drop in industrial production. Notice how IP slowed down before the 2001 recession began. Except for a few bumps, IP has climbed pretty steadily since 2009.
The May IP report showed an unexpected decline of 0.1%. This is probably the clearest sign that the economy may soon be in trouble. But we’ll need to see more data to confirm a trend.
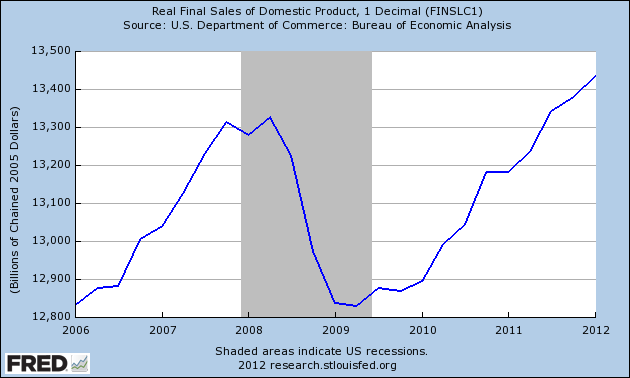
Finally, here’s a look at real sales which is probably the strongest variable. There doesn’t seem to be any visible drop-off yet.
-
-
Archives
- June 2025
- May 2025
- April 2025
- March 2025
- February 2025
- January 2025
- December 2024
- November 2024
- October 2024
- September 2024
- August 2024
- July 2024
- June 2024
- May 2024
- April 2024
- March 2024
- February 2024
- January 2024
- December 2023
- November 2023
- October 2023
- September 2023
- August 2023
- July 2023
- June 2023
- May 2023
- April 2023
- March 2023
- February 2023
- January 2023
- December 2022
- November 2022
- October 2022
- September 2022
- August 2022
- July 2022
- June 2022
- May 2022
- April 2022
- March 2022
- February 2022
- January 2022
- December 2021
- November 2021
- October 2021
- September 2021
- August 2021
- July 2021
- June 2021
- May 2021
- April 2021
- March 2021
- February 2021
- January 2021
- December 2020
- November 2020
- October 2020
- September 2020
- August 2020
- July 2020
- June 2020
- May 2020
- April 2020
- March 2020
- February 2020
- January 2020
- December 2019
- November 2019
- October 2019
- September 2019
- August 2019
- July 2019
- June 2019
- May 2019
- April 2019
- March 2019
- February 2019
- January 2019
- December 2018
- November 2018
- October 2018
- September 2018
- August 2018
- July 2018
- June 2018
- May 2018
- April 2018
- March 2018
- February 2018
- January 2018
- December 2017
- November 2017
- October 2017
- September 2017
- August 2017
- July 2017
- June 2017
- May 2017
- April 2017
- March 2017
- February 2017
- January 2017
- December 2016
- November 2016
- October 2016
- September 2016
- August 2016
- July 2016
- June 2016
- May 2016
- April 2016
- March 2016
- February 2016
- January 2016
- December 2015
- November 2015
- October 2015
- September 2015
- August 2015
- July 2015
- June 2015
- May 2015
- April 2015
- March 2015
- February 2015
- January 2015
- December 2014
- November 2014
- October 2014
- September 2014
- August 2014
- July 2014
- June 2014
- May 2014
- April 2014
- March 2014
- February 2014
- January 2014
- December 2013
- November 2013
- October 2013
- September 2013
- August 2013
- July 2013
- June 2013
- May 2013
- April 2013
- March 2013
- February 2013
- January 2013
- December 2012
- November 2012
- October 2012
- September 2012
- August 2012
- July 2012
- June 2012
- May 2012
- April 2012
- March 2012
- February 2012
- January 2012
- December 2011
- November 2011
- October 2011
- September 2011
- August 2011
- July 2011
- June 2011
- May 2011
- April 2011
- March 2011
- February 2011
- January 2011
- December 2010
- November 2010
- October 2010
- September 2010
- August 2010
- July 2010
- June 2010
- May 2010
- April 2010
- March 2010
- February 2010
- January 2010
- December 2009
- November 2009
- October 2009
- September 2009
- August 2009
- July 2009
- June 2009
- May 2009
- April 2009
- March 2009
- February 2009
- January 2009
- December 2008
- November 2008
- October 2008
- September 2008
- August 2008
- July 2008
- June 2008
- May 2008
- April 2008
- March 2008
- February 2008
- January 2008
- December 2007
- November 2007
- October 2007
- September 2007
- August 2007
- July 2007
- June 2007
- May 2007
- April 2007
- March 2007
- February 2007
- January 2007
- December 2006
- November 2006
- October 2006
- September 2006
- August 2006
- July 2006
- June 2006
- May 2006
- April 2006
- March 2006
- February 2006
- January 2006
- December 2005
- November 2005
- October 2005
- September 2005
- August 2005
- July 2005


 Eddy Elfenbein is a Washington, DC-based speaker, portfolio manager and editor of the blog Crossing Wall Street. His