Archive for July, 2007
-
The Stock Market Adjusted For Inflation
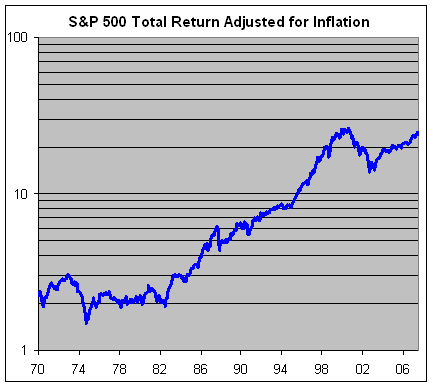
Eddy Elfenbein, July 18th, 2007 at 5:48 pmHere’s a look at the S&P 500 including dividends and adjusted for inflation. You can see that we’re just shy of the market’s peak from a few years ago.
-
Associated Banc-Corp
Eddy Elfenbein, July 18th, 2007 at 11:32 amHere’s another example of a stock with a great long-term track record that no one has ever heard of. Associated Banc-Corp (ASBC) is a mid-cap bank based in Green Bay, WI.
What’s interesting is that ASBC pays a generous dividend and it often has 10% or 20% stock dividends, so the stock’s true long-term record is a bit hidden.
Here’s a chart going back to the beginning of 1985. Since then, ASBC has had a total return of over 2,140%. The S&P 500 is up about 1,506%.
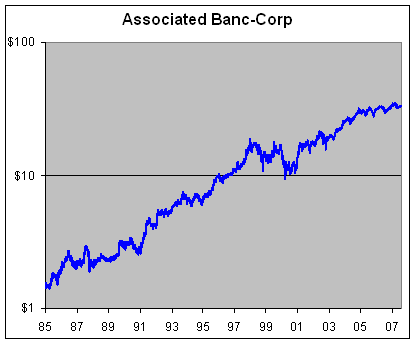
The stock is currently going for less than 14 times earnings and it’s yielding 3.8%. -
Amphenol Beats Earnings and Raises Guidance
Eddy Elfenbein, July 18th, 2007 at 11:10 amThis morning, Amphenol (APH) reported earnings of 46 cents a share, one penny more than expectations. Net income rose 58% over last year. Sales rose 14% to $688.8 million which was also above expectations.
The company boosted its full-year EPS guidance to $1.79 to $1.83, up from earlier guidance of $1.75 to $1.80. APH also expects full-year sales in the range of $2.71 billion to $2.75 billion, up from its previous range of $2.67 billion to $2.72 billion.
For this quarter, the company is expecting EPS of 44 to 46 cents. The Street is expecting 45 cents.
The stock is currently down this morning, but it’s really giving back its gain from late yesterday. -
Bernanke’s Testimony
Eddy Elfenbein, July 18th, 2007 at 10:51 amHere’s the key part of Bernanke’s testimony today:
Overall, the U.S. economy appears likely to expand at a moderate pace over the second half of 2007, with growth then strengthening a bit in 2008 to a rate close to the economy’s underlying trend. Such an assessment was made around the time of the June meeting of the Federal Open Market Committee (FOMC) by the members of the Board of Governors and the presidents of the Reserve Banks, all of whom participate in deliberations on monetary policy. The central tendency of the growth forecasts, which are conditioned on the assumption of appropriate monetary policy, is for real GDP to expand roughly 2-1/4 to 2-1/2 percent this year and 2-1/2 to 2-3/4 percent in 2008. The forecasted performance for this year is about 1/4 percentage point below that projected in February, the difference being largely the result of weaker-than-expected residential construction activity this year. The unemployment rate is anticipated to edge up to between 4-1/2 and 4-3/4 percent over the balance of this year and about 4-3/4 percent in 2008, a trajectory about the same as the one expected in February.
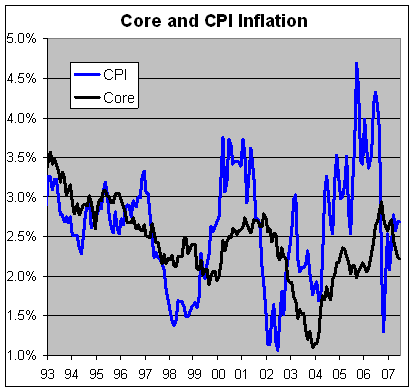
I turn now to the inflation situation. Sizable increases in food and energy prices have boosted overall inflation and eroded real incomes in recent months–both unwelcome developments. As measured by changes in the price index for personal consumption expenditures (PCE inflation), inflation ran at an annual rate of 4.4 percent over the first five months of this year, a rate that, if maintained, would clearly be inconsistent with the objective of price stability. Because monetary policy works with a lag, however, policymakers must focus on the economic outlook. Food and energy prices tend to be quite volatile, so that, looking forward, core inflation (which excludes food and energy prices) may be a better gauge than overall inflation of underlying inflation trends. (I’m glad Bernanke said this. There’s a myth that the Fed ignores food and energy. That’s simply not true. – Eddy) Core inflation has moderated slightly over the past few months, with core PCE inflation coming in at an annual rate of about 2 percent so far this year.
Although the most recent readings on core inflation have been favorable, month-to-month movements in inflation are subject to considerable noise, and some of the recent improvement could also be the result of transitory influences. However, with long-term inflation expectations contained, futures prices suggesting that investors expect energy and other commodity prices to flatten out, and pressures in both labor and product markets likely to ease modestly, core inflation should edge a bit lower, on net, over the remainder of this year and next year. The central tendency of FOMC participants’ forecasts for core PCE inflation–2 to 2-1/4 percent for 2007 and 1-3/4 to 2 percent in 2008–is unchanged from February. If energy prices level off as currently anticipated, overall inflation should slow to a pace close to that of core inflation in coming quarters.
At each of its four meetings so far this year, the FOMC maintained its target for the federal funds rate at 5-1/4 percent, judging that the existing stance of policy was likely to be consistent with growth running near trend and inflation staying on a moderating path. As always, in determining the appropriate stance of policy, we will be alert to the possibility that the economy is not evolving in the way we currently judge to be the most likely. One risk to the outlook is that the ongoing housing correction might prove larger than anticipated, with possible spillovers onto consumer spending. Alternatively, consumer spending, which has advanced relatively vigorously, on balance, in recent quarters, might expand more quickly than expected; in that case, economic growth could rebound to a pace above its trend. With the level of resource utilization already elevated, the resulting pressures in labor and product markets could lead to increased inflation over time. Yet another risk is that energy and commodity prices could continue to rise sharply, leading to further increases in headline inflation and, if those costs passed through to the prices of non-energy goods and services, to higher core inflation as well. Moreover, if inflation were to move higher for an extended period and that increase became embedded in longer-term inflation expectations, the re-establishment of price stability would become more difficult and costly to achieve. With the level of resource utilization relatively high and with a sustained moderation in inflation pressures yet to be convincingly demonstrated, the FOMC has consistently stated that upside risks to inflation are its predominant policy concern. -
Today’s CPI Report
Eddy Elfenbein, July 18th, 2007 at 10:35 amThe government reported that headline consumer inflation rose by 0.2% last month. The core rate rose by 0.2%.
-
Buy List Earnings This Week
Eddy Elfenbein, July 17th, 2007 at 4:49 pmThe earnings parade will start for our stocks this week. Tomorrow, Amphenol (APH) reports. Then on Thursday, Danaher (DHR), Unitedhealth (UNH) and Harley-Davidson (HOG) report.
Except for Harley, none of the earnings should be a big surprise. The only surprise will be how the market reacts. For Harley, I think the current expectations are too low. -
Crashing DealBreaker
Eddy Elfenbein, July 17th, 2007 at 1:28 pmI was in New York last week and while riding in a cab, the driver spotted a printer left on the curb. He pulled over, hopped out, grabbed the printer, tossed it in the trunk, then hopped back in and kept driving. You had to see it—it was all one fluid motion. See, this is why I love NYC.
My destination was the offices of one of my favorite blogs, DealBreaker. I won’t bore you with the details, but after passing the reception area and security checkpoints (including retinal scan), I finally arrived at their palatial offices. I had no idea blogging was so profitable.
Naturally, I brought my camera to record to the events.
Here’s DealBreaker’s very talented Editor-In-Chief John Carney. Note the whiteboard in the background. They never use it. Instead, it serves as ironic symbolism of John’s alienation and disaffection from the mainstream media. (Plus, it’s cheap.) Here’s John quietly reflecting on the eloquence and understated humor of his previous post.

More John. Here he is on the phone. Probably putting the screws to some Wall Street bigshot. (You can see why CNBC loves him!)

John’s a wonderful guy and he even treated me to lunch. At one point, I tried to take a picture of Bess Levin, DealBreaker’s heartbreaker. But before I could, several large men wrestled me to the ground. Then Bess crushed my camera under the heel of her four inch leather stilettos. So in lieu of any Bess photos, I give you that mental image.
I did manage to get one shot of her messy desk. Naturally, dear reader, I’m as appalled as you are. And yes, that is a shuttlecock just under the screen.

Anyway, if you haven’t read DealBreaker, I highly recommend it. It’s one of the best and funniest sites on the Internets. -
GE’s Balance Sheet
Eddy Elfenbein, July 17th, 2007 at 11:44 amHow big is General Electric (GE)? This should give you an idea.
I was scanning the earnings press release. Under “Assets” the company list $124.4 billion in the category of “Other.” -
Wall Street Loves Obama
Eddy Elfenbein, July 17th, 2007 at 11:32 am
(Via Yglesias) Senator Obama’s top contributors are Lehman Brothers, $160,760; Citadel Investment Group, $152,150; Goldman Sachs, $103,550; JP Morgan Chase, $101,950 and Citigroup $61,125.
Here’s an old post looking at his investment portfolio. -
The Exchange Rate’s Impact on the Stock Market
Eddy Elfenbein, July 17th, 2007 at 10:59 amThe U.S. dollar has been in freefall lately, but it seems to have little or no impact on the stock market’s rally. In fact, it seems to be helping.
I decided to do a little analysis and see how much the exchange rate, the dollar/euro in particular, impacts equity prices.
From the beginning of 1999 to the end of June, the euro and the stock market were traded on about 2100 days. On days when the euro rose against the dollar, the S&P 500 lost a combined 66%. Annualized, that works out to a loss of -22.88% a year. When the euro fell against the dollar, the S&P 500 gained an annualized 35.30%.
Here are the annualized rates for the S&P 500 sector groups:
……………………………Euro Up………………..Euro Down
Energy……………………9.28%…………………..17.58%
Discretionary…………-28.57%…………………..47.76%
Staples…………………..-5.07%……………………8.21%
Financials………………-27.26%…………………..51.23%
Healthcare……………..-12.84%………………….17.39%
Industrials……………..-21.50%…………………..40.90%
Tech……………………..-44.04%…………………..69.80%
Materials…………………..0.32%…………………..16.17%
Telecom………………….-24.73%…………………..19.24%
Utilities……………………-2.40%……………………7.43%
- Tweets by @EddyElfenbein
-
-
Archives
- April 2024
- March 2024
- February 2024
- January 2024
- December 2023
- November 2023
- October 2023
- September 2023
- August 2023
- July 2023
- June 2023
- May 2023
- April 2023
- March 2023
- February 2023
- January 2023
- December 2022
- November 2022
- October 2022
- September 2022
- August 2022
- July 2022
- June 2022
- May 2022
- April 2022
- March 2022
- February 2022
- January 2022
- December 2021
- November 2021
- October 2021
- September 2021
- August 2021
- July 2021
- June 2021
- May 2021
- April 2021
- March 2021
- February 2021
- January 2021
- December 2020
- November 2020
- October 2020
- September 2020
- August 2020
- July 2020
- June 2020
- May 2020
- April 2020
- March 2020
- February 2020
- January 2020
- December 2019
- November 2019
- October 2019
- September 2019
- August 2019
- July 2019
- June 2019
- May 2019
- April 2019
- March 2019
- February 2019
- January 2019
- December 2018
- November 2018
- October 2018
- September 2018
- August 2018
- July 2018
- June 2018
- May 2018
- April 2018
- March 2018
- February 2018
- January 2018
- December 2017
- November 2017
- October 2017
- September 2017
- August 2017
- July 2017
- June 2017
- May 2017
- April 2017
- March 2017
- February 2017
- January 2017
- December 2016
- November 2016
- October 2016
- September 2016
- August 2016
- July 2016
- June 2016
- May 2016
- April 2016
- March 2016
- February 2016
- January 2016
- December 2015
- November 2015
- October 2015
- September 2015
- August 2015
- July 2015
- June 2015
- May 2015
- April 2015
- March 2015
- February 2015
- January 2015
- December 2014
- November 2014
- October 2014
- September 2014
- August 2014
- July 2014
- June 2014
- May 2014
- April 2014
- March 2014
- February 2014
- January 2014
- December 2013
- November 2013
- October 2013
- September 2013
- August 2013
- July 2013
- June 2013
- May 2013
- April 2013
- March 2013
- February 2013
- January 2013
- December 2012
- November 2012
- October 2012
- September 2012
- August 2012
- July 2012
- June 2012
- May 2012
- April 2012
- March 2012
- February 2012
- January 2012
- December 2011
- November 2011
- October 2011
- September 2011
- August 2011
- July 2011
- June 2011
- May 2011
- April 2011
- March 2011
- February 2011
- January 2011
- December 2010
- November 2010
- October 2010
- September 2010
- August 2010
- July 2010
- June 2010
- May 2010
- April 2010
- March 2010
- February 2010
- January 2010
- December 2009
- November 2009
- October 2009
- September 2009
- August 2009
- July 2009
- June 2009
- May 2009
- April 2009
- March 2009
- February 2009
- January 2009
- December 2008
- November 2008
- October 2008
- September 2008
- August 2008
- July 2008
- June 2008
- May 2008
- April 2008
- March 2008
- February 2008
- January 2008
- December 2007
- November 2007
- October 2007
- September 2007
- August 2007
- July 2007
- June 2007
- May 2007
- April 2007
- March 2007
- February 2007
- January 2007
- December 2006
- November 2006
- October 2006
- September 2006
- August 2006
- July 2006
- June 2006
- May 2006
- April 2006
- March 2006
- February 2006
- January 2006
- December 2005
- November 2005
- October 2005
- September 2005
- August 2005
- July 2005
 Eddy Elfenbein is a Washington, DC-based speaker, portfolio manager and editor of the blog Crossing Wall Street. His