Archive for January, 2014
-
IBM Earns $6.13 Per Share in Q4
Eddy Elfenbein, January 21st, 2014 at 4:12 pmEarnings from IBM ($IBM) are out. The company earned $6.13 per share for Q4 which was 14 cents more than the Street’s expectations. For the year, IBM earned $16.28 per share. They expect to earn at least $18 per share this year. Wall Street had been expecting $17.97 per share.
Diluted EPS:
GAAP: $5.73, up 12 percent;
Operating (non-GAAP): $6.13, up 14 percent;Net income:
GAAP: $6.2 billion, up 6 percent;
Operating (non-GAAP): $6.6 billion, up 8 percent;Pre-tax income:
GAAP: $7.0 billion, down 11 percent;
Operating (non-GAAP): $7.4 billion, down 8 percent;Gross profit margin:
GAAP: 51.7 percent, down 0.1 points;
Operating (non-GAAP): 52.6 percent, up 0.3 points;Revenue of $27.7 billion, down 5 percent, down 3 percent adjusting for currency;
Software, Services and Global Financing each grew, adjusting for currency:
Software up 3 percent, up 4 percent adjusting for currency;
Services down 2 percent, up 1 percent adjusting for currency;
Global Financing revenue flat, up 3 percent adjusting for currency;
Systems and Technology revenue declined 26 percent, down 25 percent adjusting for currency;
Services backlog of $143 billion, up 2 percent, up 5 percent adjusting for currency;
Free cash flow of $8.4 billion.Full-Year 2013:
Diluted EPS:
GAAP: $14.94, up 4 percent;
Operating (non-GAAP): $16.28, up 7 percent;
Operating (non-GAAP) excluding second-quarter workforce rebalancing charges, $16.99;
Net income:
GAAP: $16.5 billion, down 1 percent;
Operating (non-GAAP): $18.0 billion, up 2 percent;
Pre-tax income:
Software, Services and Global Financing each increased segment profit:
Software: $11.1 billion, up approximately $300 million;
Services: $10.2 billion, up more than $250 million;
Global Financing: $2.2 billion, up more than $100 million;
Systems and Technology segment profit declined $1.7 billion, to a loss of more than $500 million;
Revenue of $99.8 billion, down 5 percent, down 2 percent adjusting for currency;
Business Analytics revenue of $15.7 billion, up 9 percent;
Smarter Planet revenue up approximately 20 percent;
Cloud revenue of $4.4 billion, up 69 percent:
Fourth-quarter annual revenue run rate of more than $2 billion delivered as a service;
Free cash flow of $15.0 billion.Full-Year 2014 Expectation:
GAAP EPS of at least $17.00. Operating (non-GAAP) EPS of at least $18.00 compared with $16.28 for 2013, an increase of more than 10 percent.
IBM (IBM) today announced fourth-quarter 2013 diluted earnings of $5.73 per share, compared with diluted earnings of $5.13 per share in the fourth quarter of 2012, an increase of 12 percent. Operating (non-GAAP) diluted earnings were $6.13 per share, compared with operating diluted earnings of $5.39 per share in the fourth quarter of 2012, an increase of 14 percent.
Fourth-quarter net income, which includes benefits from tax audit settlements, was $6.2 billion compared with $5.8 billion in the fourth quarter of 2012, an increase of 6 percent. Operating (non-GAAP) net income was $6.6 billion compared with $6.1 billion in the fourth quarter of 2012, an increase of 8 percent.
Total revenues for the fourth quarter of 2013 of $27.7 billion decreased 5 percent (down 3 percent adjusting for currency) from the fourth quarter of 2012.
“We continued to drive strong results across much of our portfolio and again grew earnings per share in 2013. While we made solid progress in businesses that are powering our future, in view of the company’s overall full year results, my senior team and I have recommended that we forgo our personal annual incentive payments for 2013,” said Ginni Rometty, IBM chairman, president and chief executive officer.
”As we enter 2014, we will continue to transform our business and invest aggressively in the areas that will drive growth and higher value. We remain on track toward our 2015 roadmap for operating EPS of at least $20, a step in our long-term strategy of industry leadership and continuous transformation.”
-
When Owning Gold Was a Crime
Eddy Elfenbein, January 21st, 2014 at 10:37 amHere’s a great post by my friend Gary Alexander of Navellier Market Mail. Gary’s been writing on investing for nearly 40 years.
Imagine what would happen if the U.S. government determined that oil, gas and other energy investments were too important to allow “speculators” to push the price up and down in the open market. Imagine a heavily guarded national oil hoard in “Fort Cushing,” Oklahoma, with strict rationing and penalties of up to 10 years in prison for storing gas in your garage. Then, imagine the price of oil growing nearly 10-fold before you were free to buy it. Then you hoarded the stuff, only to see the price fall by 50% in 18 months.
That’s the story of gold. In the “land of the free and the home of the brave,” we allowed this outrageous abridgement of our investment freedom for 40+ years, beginning in April, 1933 and ending in late 1974.
In January 1934 & January 1974, the Forbidden Metal Soared
On January 30, 1934, on his 52nd birthday, President Franklin D. Roosevelt tossed around a few numbers in his head and decided that America’s huge new hoard of gold – then priced at $20.67 per ounce – would be suddenly revalued 69% higher at $35/ounce. The Gold Reserve Act gave him that power. Previously, under Executive Order 6012 (enacted on April 5, 1933), FDR outlawed “the Hoarding of gold coin, gold bullion and gold certificates.” Gold ownership became a felony, punishable by up to 10 years in prison and fines of up to $10,000. Americans were given only 25 days to surrender their gold (by May 1, 1933).
Jewelry and some collector coins were exempted. Americans were also free to own gold-mining shares like Homestake Mining and Dome Mines, which became the biggest winners on Wall Street in the 1930s. Homestake shares rose from $80 during the crash month of October, 1929 to $495 in 1935, after FDR’s gold grab, dollar devaluation and gold revaluation leveraged the profits of most of the U.S. gold miners.
Now, fast-forward 40 years to January of 1974, when gold ownership was still prohibited to Americans.
Gold began 1973 at $65 but reached $112 by year’s end. A week later, on Tuesday, January 8, 1974, gold hit a record $126.50 in London, caused in part by the Japanese government’s announcement that they had devalued the yen by 6.7% that day. The U.S. dollar also seemed to be in free-fall, after two devaluations.
On the same day (January 8, 1974), the U.S. Department of Labor reported that wholesale prices (later called Producer Prices) had risen 18.2% in 1973. Silver hit a record $3.40. In the next three days, the Dow fell 6.5%, from 880 to 823 as Wall Street began its worst year of the postwar era with a dramatic thud.
Late in the following week, on Thursday, January 17, 1974, the Commerce Department reported that the final quarter of 1973 saw the largest quarterly rise in price levels since 1951. Then, something dramatic happened. On Friday, January 18, over 700 investors flocked to the first modern gold-oriented investment conference in New Orleans under the guidance of James U. Blanchard III, the man who, more than any other, helped make gold legal for Americans to own. The seminar, sponsored by the National Committee to Legalize Gold, discussed alternative gold investments and plans to lobby Congress for gold ownership.
On Monday, January 21, 1974, as that first gold conference broke up, gold hit a new record high $138.50 and silver hit a record $3.97, as most Americans longed hopelessly for this investment they dare not own. But finally, after much lobbying, a bill passed Congress in August to make gold legal for Americans to own, as of December 30, 1974. Unfortunately, that was the day of gold’s peak price in the mid-1970s.
Gold’s High and Low Prices in the Mid-1970s
January 18, 1973; $63.90; The Dow peaked a week earlier at 1051.
December 30, 1974; $195.25; The first day of legal gold ownership since 1933
September 25, 1976; $103.50; A 47% price drop for the first “legal” gold buyers
Source: USAGOLDSo, law-abiding Americans were forced to sell their gold at $20.67. Then, they were free to buy it back at $195 (missing an 844% gain), just in time to endure a 47% loss. But these early gold buyers, if they did not give up on the yellow metal in 1976, enjoyed eight-fold gains in 3-1/2 years, to $850 in early 1980.
Today, gold has once again fallen by 40% from a peak of $1,923 to a low of $1,192. What’s next?
The Pundits Agree – Gold Will Likely Fall to $1,050 This Year
Last Thursday, Bank of America Merrill Lynch strategist Michael Widmer cut that firm’s gold forecast for 2014 by 11%, from their previous projection of nearly $1,300 per ounce down to $1,150 – well below gold’s recent 2013 lows. Widmer says that gold could bottom out at $1,000 before closing at $1,150. Merrill’s silver forecast is off even more sharply, down 21% from over $23 down to $18.38 an ounce.
The annual gold forecasts from other authorities sound equally dismal. Goldman Sachs predicted a 15% drop in gold for 2014. J.P. Morgan reduced its 2014 forecast by 10%, from $1,400 down to $1,263. Barclays’ analyst Suki Cooper sees a drop to $1,050 gold in 2014. HSBC and MKS Group also cut their 2014 targets for gold. Moody’s cut their projected 2014 price for gold from $1,200 down to $1,100. Louise Yamada of Technical Research expects gold to fall by almost 20% this year, to $1,000 an ounce. UBS reduced their 2014 target to $1,200, down from $1,325, and predicted a 2014 gold low of $1,050.
Some predictions sound more like obituaries. Quincy Krosby, a market strategist at Prudential Financial, said “Investors were heartbroken by gold…. The selloff was one of the deepest purges in an asset class that I’ve seen.” Also, Scott Nations, president and chief investment officer at NationsShares, says that gold’s true value in 2014 is close to $1,000. Nations told CNBC on December 23 that he “wouldn’t buy gold with my worst enemy’s money.” Why? Because “I think it should go below $1,000 in 2014.”
Some gold bugs, of course, see higher gold prices, but I can’t find one established Wall Street institution that sees more than a small rise to $1,300 by the end of 2014. They might be right, but their unanimity sounds a bit like group-think, or perhaps financial analysts don’t appreciate gold’s unique fundamentals.
The fundamentals supporting gold’s price include: (1) Continuing strong physical demand from China, the #1 gold producer and #1 gold consumer; (2) rising physical demand for gold bars and coins in the Middle East, Europe and America; (3) continuing quantitative easing under Janet Yellen’s leadership at the Federal Reserve, and (4) many emerging market central banks continuing to accumulate gold hoards.
On the supply side, we’ll see more gold mines closing, since they cannot make a profit on $1,200 gold. This limits the new supply. In addition, some mining CEOs are talking about returning to the old practice of selling their production forward, under the assumption that gold prices will continue to retreat further. This takes new supplies off the market early, potentially creating a warehouse supply shortage later on.
What If Gold Rises from the Ashes – Like it did in the Late 1970s?
Most pundits have called gold’s 2011 peak a “bubble,” similar to the 1980 spike to $850, but perhaps a more realistic comparison is to the first peak in 1974. After all, the only difference between gold’s fall from $195 to $105 in 1976 and the current decline from $1,950 to (presumably) $1,050 is a decimal point.
What if Wall Street is right and gold hits $1,050 during 2014? That would be very disappointing to most gold investors, and it would give Wall Street a chance to crow about their predictions, but it would fit right in with the long base-building period from 1975 to 1978, which preceded gold’s 1979-80 surge.
Gold has beaten every currency on earth during the 20th and 21st century. Gold is an alternative to paper currency, not stocks, and Navellier Gold offers a low-cost method for accumulating gold bullion. We have no idea where gold will finish 2014 or 2015, but we are hoping to see a relatively long, flat trading range, so that we can accumulate a meaningful position for gold’s next surge, which will surely come.
-
Expect More Tapering
Eddy Elfenbein, January 21st, 2014 at 10:13 amThe markets are back open. I hope you enjoyed the long weekend. After the close, CA Technologies ($CA) and IBM ($IBM) are due to report.
At the WSJ, Jon Hilsenrath says that the Fed will continue to taper at its meeting next week.
The Federal Reserve is on track to trim its bond-buying program for the second time in six weeks as a lackluster December jobs report failed to diminish the central bank’s expectations for solid U.S. economic growth this year, according to interviews with officials and their public comments.
A reduction in the program to $65 billion a month from the current $75 billion could be announced at the end of the Jan. 28-29 meeting, which would be the last meeting for outgoing Chairman Ben Bernanke.
The Fed has been buying Treasurys and mortgage bonds in an effort to drive down long-term interest rates and spur spending, hiring and investment. Last year the Fed spent $85 billion a month buying bonds. Mr. Bernanke suggested at a December news conference that officials were inclined to continue cutting purchases in $10 billion increments at subsequent meetings as long as the economy keeps strengthening.
“We’re likely to continue on a path of gradual, measured reductions in the pace of purchases, assuming the economy tracks as we expect it to,” San Francisco Fed President John Williams said in an interview early in the month.
Bond buying is one of two prongs in the Fed’s strategy to boost the economy. The other is low interest rates, and Fed officials are once again debating how best to describe their plans for when they eventually begin raising short-term rates.
-
The S&P 500 Set to Music
Eddy Elfenbein, January 21st, 2014 at 9:56 amLast year’s market set to music. Good beat, kinda hard to dance to:
-
The Piotroski Nine-Point Test
Eddy Elfenbein, January 21st, 2014 at 7:36 amI’m not a big fan of stock screens but I admire the work of Joseph Piotroski.
Dr. Piotroski is an accounting professor at Stanford. In 2000, he wrote an academic paper, “Value Investing: The Use of Historical Financial Statement Information to Separate Winners from Losers.”
Basically, he wanted to find what works with value investing. His strategy was to first find stocks with low valuations, then sort what cheap stocks would likely rebound.
Here’s the secret formula. Piotroski first takes stocks that have the lowest Price/Book Ratios. Then the stock has to pass eight of the following nine tests:
*The return on assets for the last fiscal year is positive.
*Cash from operations for the last fiscal year is positive.
*The return on assets ratio for the last fiscal year is greater than the return on assets ratio for the fiscal year two years ago.
*Cash from operations for the last fiscal year is greater than income after taxes for the last fiscal year.
*The long-term debt-to-assets ratio for the last fiscal year is less than the long-term debt to assets ratio for the fiscal year two years ago.
*The current ratio for the last fiscal year is greater than the current ratio for the fiscal year two years ago.
*The average shares outstanding for the last fiscal year is less than or equal to the average number of shares outstanding for the fiscal year two years ago.
*The gross margin for the last fiscal year is greater than the gross margin for the fiscal year two years ago.
*The asset turnover for the last fiscal year is greater than the asset turnover for the fiscal year two years ago.According to Forbes, the system has worked very well.
A stock screen run by the AAII based on Piotroski’s approach has a 10-year return of 32.5%, compared to a return of 5.5% for the S&P 500 during that same period. The 5-year return is better, at 40%, compared to 5.9% for the S&P. Year-to-date through the end of July, the Piotroski screen is up an amazing 105.7% versus 18.2% for the S&P.
-
Morning News: January 21, 2014
Eddy Elfenbein, January 21st, 2014 at 6:37 am‘Rich Kids of Beverly Hills’ Has a Message For Davos Leaders
German Economic Expectations Fall Slightly
Deutsche Loss Underlines European Economy’s Dependence on Banks
Korea’s Biggest Card-Data Theft Prompts Executives to Resign
China Workforce Slide Robs Xi of Growth Engine
Iran Viable Investment With 29% in Poll as Rouhani Visits Davos
CEO Profit Skepticism Backs Decade’s Weakest Stocks Estimate
China CNR Plans US $1.5 Billion HK IPO in 2nd Quarter
Overstock.com Sees New Market in Bitcoins
Unilever Beats Forecasts as Emerging Markets Rebound
SABMiller Third-Quarter Lager Sales Rise Less Than Estimated
SAP Delays Profitability Target Amid Cloud Push
Remy Cointreau’s China Woes Continue
Credit Writedowns: Bank Reserves and the Falling Loan to Deposit Ratio at US Banks
Jeff Carter: Milton Friedman Predicts Bitcoin
Be sure to follow me on Twitter.
-
The Mystery of 21 Points
Eddy Elfenbein, January 21st, 2014 at 12:42 amRecently, I’ve been wrestling with a math/sports puzzle and I wanted to share my thoughts with you. The puzzle began when I saw two charts by Seth Kadish of Vizual Statistix. One is a “heat map” and the other a histogram of points scored in every single NFL football game going back to 1920.
The histogram shows pretty much what you’d expect—the more points a team scores, the more likely they are to win the game. But I noticed an exception. There was something odd about teams that scored exactly 21 points.
Since 1940, teams that have scored exactly 20 points have gone 831-753-36 for a winning percentage of 0.524. But for teams that have scored 21 points, that record falls to 557-765-28, which is a winning percentage of 0.423.
Why does one more point translate into worse performance? I couldn’t get this out of my head. Were teams that scored 21 points just unlucky? Couldn’t be…the sample is just too large.
This riddle brought out my best and worst qualities. I love a good puzzle and I’m stubborn as hell. After giving this a lot of thought, I’ve come up with an answer. Let me share that with you.
The reason why 21 is so unlucky is that teams scoring 21 on the nose most likely haven’t kicked any field goals.
Think about it. While field goals aren’t that valuable by themselves, they’re the preferred instrument teams use to win close games. The teams who’ve scored 21 most likely haven’t used one.
As a result, we have a bit of a statistical illusion. Kicking lots of field goals won’t give you lots of wins, but winning games, particularly close ones, means you’ve probably kicked some field goals. (By the way, overtime isn’t a factor. We see the same effect on 21-pointers before 1974 when the NFL didn’t have overtime.) Conversely, this field goal effect also gives a nice bump to the 20-pointers with their numerous 20-17 victories. That’s the most-common football score.
This brings up an important fact about football. The object isn’t to score as many points as possible. Rather, it’s to score more points than the other team. That’s a subtle but important distinction when looking at the data. If a team is trailing by one or two points, or the score is tied, and they have the ball within field goal range, they’ll forgo trying to score a touchdown. They’ll try to burn as much time as they can, and go for the game-winning field goal as time expires.
When we look at the histogram we can see that there are a large number of games settled by three points (17-14, 20-17, 27-24). We can confirm our FG hypothesis by looking at 28 pointers, which is another candidate for few field goals. Teams that have scored 28 points on the nose have gone 622-281-30. Not bad, but it’s still below the 23 pointers at 658-280-8.
So how does this relate to finance (you knew where I was going with this, didn’t you?) The issue I’m raising isn’t about football. Rather, it’s about how we interpret data. Sometimes the numbers can fool us and we have to be clear what we’re looking for.
The similarity between finance and football is that the numbers are aware of themselves. This is very different from an experiment in the physical sciences. Boron doesn’t know it’s boron but the participants in a football know exactly what the score is and that they’re trying to win. As a result, statistics like standard deviation and the normal distribution are hindered.
Likewise, market participants know what the market is doing and the score of that game impacts their decisions. That’s why we see daily changes in the Dow far, far outside what a normal distribution would predict (in other words, fat tails).
One of the constant dangers of finance is the desire to quantify things that are either resistant to it, or simply not needed. The numbers are a picture of reality, not reality itself.
-
MLK Quote
Eddy Elfenbein, January 20th, 2014 at 8:20 amDr. Martin Luther King Jr. was born 85 years ago last Wednesday. One of my favorite MLK quotes is:
If a man is called to be a street sweeper, he should sweep streets even as Michaelangelo painted, or Beethoven composed music or Shakespeare wrote poetry. He should sweep streets so well that all the hosts of heaven and earth will pause to say, ‘Here lived a great street sweeper who did his job well.
I think the quote may have been influenced by Ecclesiastes 9:10.
-
Morning News: January 20, 2014
Eddy Elfenbein, January 20th, 2014 at 6:38 amThe Five Most Important Questions For The Davos Elite
What Lies Beneath China’s Growth
China Rate Swaps Drop as PBOC Injects Cash Before Lunar New Year
Malaysia Relaxes Rules For Auto Makers, Opening Industry To Energy-Efficient Foreign Producers
Bitcoin Judged Commodity in Finland After Failing Money Test
Deutsche Bank Posts Surprise Net Loss
AB InBev to Regain Grip on S. Korean Brewer OB for $5.8 billion
Shell Announces Sale of Wheatstone LNG Stake in Australia
CNOOC Limited Announces its 2014 Business Strategy and Development Plan
Peugeot Board Said to Approve Capital Increase Plan
Wells Fargo, US Bank And Fifth Third Plan To Close Payday Loan Program
Amazon Wants to Send You Stuff Before You’ve Even Decided to Buy It
Building Toward the Home of Tomorrow
Jeff Miller: Weighing the Week Ahead: More “Experts” Predicting a Market Top
Howard Lindzon: Clicks over Bricks…Long Live E-Commerce and Death to Best Buy…Even Movie Theatres
Be sure to follow me on Twitter.
-
December Industrial Production = +0.3%
Eddy Elfenbein, January 17th, 2014 at 10:31 amThe Federal Reserve reported that Industrial Production rose 0.3% last month. In November, the index became the latest to eclipse its pre-recession peak.
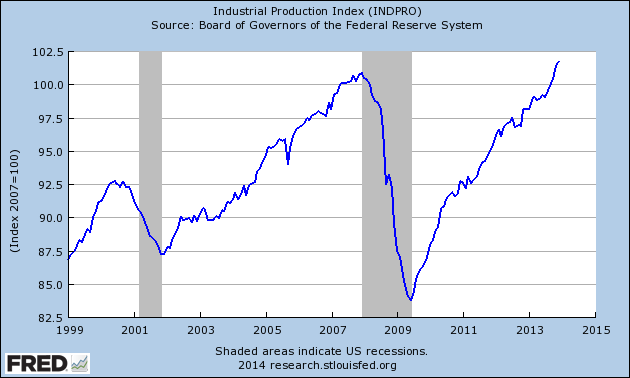
In six years, IP has risen by 0.9%.
-
Archives
- July 2026
- June 2026
- May 2026
- April 2026
- March 2026
- February 2026
- January 2026
- December 2025
- November 2025
- October 2025
- September 2025
- August 2025
- July 2025
- June 2025
- May 2025
- April 2025
- March 2025
- February 2025
- January 2025
- December 2024
- November 2024
- October 2024
- September 2024
- August 2024
- July 2024
- June 2024
- May 2024
- April 2024
- March 2024
- February 2024
- January 2024
- December 2023
- November 2023
- October 2023
- September 2023
- August 2023
- July 2023
- June 2023
- May 2023
- April 2023
- March 2023
- February 2023
- January 2023
- December 2022
- November 2022
- October 2022
- September 2022
- August 2022
- July 2022
- June 2022
- May 2022
- April 2022
- March 2022
- February 2022
- January 2022
- December 2021
- November 2021
- October 2021
- September 2021
- August 2021
- July 2021
- June 2021
- May 2021
- April 2021
- March 2021
- February 2021
- January 2021
- December 2020
- November 2020
- October 2020
- September 2020
- August 2020
- July 2020
- June 2020
- May 2020
- April 2020
- March 2020
- February 2020
- January 2020
- December 2019
- November 2019
- October 2019
- September 2019
- August 2019
- July 2019
- June 2019
- May 2019
- April 2019
- March 2019
- February 2019
- January 2019
- December 2018
- November 2018
- October 2018
- September 2018
- August 2018
- July 2018
- June 2018
- May 2018
- April 2018
- March 2018
- February 2018
- January 2018
- December 2017
- November 2017
- October 2017
- September 2017
- August 2017
- July 2017
- June 2017
- May 2017
- April 2017
- March 2017
- February 2017
- January 2017
- December 2016
- November 2016
- October 2016
- September 2016
- August 2016
- July 2016
- June 2016
- May 2016
- April 2016
- March 2016
- February 2016
- January 2016
- December 2015
- November 2015
- October 2015
- September 2015
- August 2015
- July 2015
- June 2015
- May 2015
- April 2015
- March 2015
- February 2015
- January 2015
- December 2014
- November 2014
- October 2014
- September 2014
- August 2014
- July 2014
- June 2014
- May 2014
- April 2014
- March 2014
- February 2014
- January 2014
- December 2013
- November 2013
- October 2013
- September 2013
- August 2013
- July 2013
- June 2013
- May 2013
- April 2013
- March 2013
- February 2013
- January 2013
- December 2012
- November 2012
- October 2012
- September 2012
- August 2012
- July 2012
- June 2012
- May 2012
- April 2012
- March 2012
- February 2012
- January 2012
- December 2011
- November 2011
- October 2011
- September 2011
- August 2011
- July 2011
- June 2011
- May 2011
- April 2011
- March 2011
- February 2011
- January 2011
- December 2010
- November 2010
- October 2010
- September 2010
- August 2010
- July 2010
- June 2010
- May 2010
- April 2010
- March 2010
- February 2010
- January 2010
- December 2009
- November 2009
- October 2009
- September 2009
- August 2009
- July 2009
- June 2009
- May 2009
- April 2009
- March 2009
- February 2009
- January 2009
- December 2008
- November 2008
- October 2008
- September 2008
- August 2008
- July 2008
- June 2008
- May 2008
- April 2008
- March 2008
- February 2008
- January 2008
- December 2007
- November 2007
- October 2007
- September 2007
- August 2007
- July 2007
- June 2007
- May 2007
- April 2007
- March 2007
- February 2007
- January 2007
- December 2006
- November 2006
- October 2006
- September 2006
- August 2006
- July 2006
- June 2006
- May 2006
- April 2006
- March 2006
- February 2006
- January 2006
- December 2005
- November 2005
- October 2005
- September 2005
- August 2005
- July 2005
 Eddy Elfenbein is a Washington, DC-based speaker, portfolio manager and editor of the blog Crossing Wall Street. His