Archive for July, 2014
-
CWS Market Review – July 25, 2014
Eddy Elfenbein, July 25th, 2014 at 7:05 am“People always call it luck when you’ve acted more sensibly than they have.”
– Anne TylerLike the honey badger, this stock market just doesn’t care. Was it going to be tripped up by Ukraine? Nope. Gaza? Nope. Fed tapering? Not a chance. The stock market keeps chugging higher. On Thursday, the S&P 500 finished the day at 1,987.98 for its 27th record close this year. Not that long ago, 2,000 for the S&P 500 was a distant hope. Now, it looks like we’ll hit it any day now.
This week has been all about earnings, earnings and more earnings. So far, the earnings have been pretty good. According to the latest numbers from Bloomberg, 77% of the S&P 500 companies that have reported so far have topped Wall Street’s expectations. Also, 64% have beaten their sales expectations. The S&P 500 is currently on track to deliver Q2 earnings growth of 6.2% and sales growth of 3.3%.
Our Buy List has been very busy this week; we had seven earnings reports. Thanks to good earnings, Ford Motor jumped out to a new 52-week high. Even boring CA Technologies rallied 4.5% after a strong earnings report. I’ll review all of our recent earnings in a just a moment. I’ll also highlight four Buy List earnings reports coming next week. I should mention that weekly jobless claims just dropped to an eight-year low, which bodes well for next week’s jobs report. But first, let’s take a closer look at our mass of earnings reports.
Surveying the Earnings Parade
We have a lot to go through, so let’s start with Tuesday’s earnings report from McDonald’s and Microsoft. Unfortunately, the McDonald’s ($MCD) news wasn’t very good. The fast-food joint earned $1.40 for Q2, which was four cents shy of Wall Street’s consensus. In the U.S., same-store sales dropped by 1.5%.
It’s no secret that MCD has made a lot of missteps. This is particularly painful when we see the outstanding results from Chipotle ($CMG), a company MCD used to own. Simply put, McDonald’s ($MCD) is not in a good way right now. As an investor, I like when companies hit rough patches since there’s a good opportunity to find a bargain. The catch, of course, is that the company has to right itself.
I think the folks at MCD understand the position they’re in, although I think the reforms may take a while to impact the business. For now, MCD is indeed a cheap stock. The shares got hit by a bunch of downgrades after the earnings report. Going by Thursday’s close, MCD yields 3.4%. Not many blue chips pay that well. The restaurant said that it’s planning to reform itself over the next 18 months. They’d better get cracking. I’m lowering my Buy Below on McDonald’s to $101 per share.
Except for Nokia, Microsoft Is Looking Good
Microsoft’s ($MSFT) earnings report was a bit confusing, but after giving it a read, traders decided they like it. After the bell on Tuesday, the software giant reported fiscal Q4 earnings of 55 cents per share. That was five cents below consensus. The shares quickly plunged in the after-hours market.
Then more details came out, and it turned out that the results weren’t that bad at all. Microsoft’s quarterly revenue rose a healthy 18% to $23.4 billion. The company also pleased investors last week when they announced big job cuts. It’s not that the market is happy about folks losing their jobs, but they’re pleased to see that MSFT is working to streamline operations. Most of those jobs are from Nokia.
The big problem for Microsoft is that Nokia’s handset business is a money loser. The division could turn into a winner in the long term, but the outlook is rather iffy at the moment. The good news for Microsoft is that their cloud business is going very well. Microsoft remains a good buy up to $48 per share.
Earnings from CA Technologies and Qualcomm
On Wednesday, two of our tech stocks reported results, CA Technologies and Qualcomm. I have to admit that I’ve become quite frustrated with CA Technologies ($CA). However, the company earned itself a temporary respite from my doghouse by reporting decent results. For their fiscal Q1, CA earned 65 cents per share, which was five cents better than estimates. Quarterly revenue dropped 2% to $1.069 billion. This was the ninth quarter in a row of falling revenue.
But the important news was guidance. For fiscal 2015, which ends next March, CA sees revenues falling by 1% to 2%. They also said they expect to see earnings range between $2.42 and $2.49 per share. Apparently this relieved a lot of investors. The shares jumped 4.5% on Thursday to close at $29.64. Even with that rally, we’re still down nearly 12% on the year with CA. The big positive continues to be the 25-cent quarterly dividend. The stock yield now works out to 3.4%. CA remains a buy up to $31 per share.
Technically, Qualcomm ($QCOM) reported amazing earnings for their fiscal third quarter. The company earned $1.44 per share, which crushed estimates by 22 cents per share. In April, they said they were expecting Q3 earnings to range between $1.15 and $1.25 per share. Well, I guess they beat that!
The good news and bad news for Qualcomm is China. The country continues to be a great customer, but several companies there “are not fully complying with their contractual obligations.” As a result, the company had weak guidance for the current quarter. For fiscal Q4, Qualcomm sees earnings ranging between $1.20 and $1.35, which is below Wall Street’s consensus of $1.39 per share.
Thanks to the blow-out earnings Q3 report, Qualcomm raised their full-year EPS range to $5.21 – $5.36, from the earlier range of $5.05 – $5.25. Note that QCOM’s earnings beat was larger than the lower guidance. Nevertheless, traders didn’t like the China news and the shares fell by more than 6% on Thursday. Qualcomm is a buy up to $83 per share.
Ford Motor Is a Buy up to $19 per Share
On Thursday, Ford Motor ($F) reported another strong quarter. This is their first one under their new CEO, Mark Fields. I really like what I’m seeing at Ford. Alan Mulally and his team deserve a lot of credit. The company made 40 cents per share for Q2, which beat consensus by four cents per share. This was Ford’s 20th profitable quarter in a row.
I was also pleased to see Ford stand by its forecast for this year of $7 billion to $8 billion in pre-tax profit. The really good news is that Ford managed to eke out a teeny tiny profit in Europe of $14 million. Of course, $14 million may sound like a lot, but in ROE terms, to an outfit like Ford, it’s peanuts. Still, no one was expecting they’d be at peanuts in Europe this early. Ford is clearly moving in the right direction.
This is a key moment for Ford. They’re introducing a bunch of new vehicles, and that requires a lot of up-front money. Overall, the company is holding the line on costs. One weak spot was South America, where they lost $300 million. Ford earned $2.4 billion in operating profit in North America. That’s a company record. The new Mustang and aluminum F-150 are due later this year, and that could give a nice boost to sales.
On Thursday, the shares jumped as high as $18.12, which is a three-year high (see above). Ford is a solid buy up to $19 per share.
CR Bard Beats Low-Balled Expectations
In April, CR Bard ($BCR) told us to expect Q2 earnings to range between $1.98 and $2.02 per share. Last week, I said I thought they were low-balling us, and sure enough, on Thursday, Bard reported Q2 earnings of $2.06 per share.
I know companies like to lower the bar on earnings and then try to impress us by topping phony expectations. I don’t blame Bard for playing the game, but I’ll let you know it when I see it.
Overall, they had a decent quarter. Quarterly sales rose 9% to $827.1 million. Bard’s chairman and CEO, Timothy M. Ring, said, “Once again we exceeded our expectations for revenue growth this quarter. We continue to believe that executing our investment plan will accelerate the sustainable growth rate of the overall portfolio and put us in a position to provide revenue growth in the mid-to-high single digits with attractive returns for shareholders.”
Now let’s turn to guidance. For Q3, Bard expects earnings to range between $2.07 and $2.11 per share. They shouldn’t have trouble hitting that. Bard also increased their full-year range by five cents at each end. The new range is $8.25 to $8.35 per share.
If you recall, Bard raised their quarterly dividend last month from 21 to 22 cents per share. They’ve raised their dividend every year since 1972. I rate CR Bard as a buy up to $151 per share.
Upcoming Buy List Earnings
We have four earnings reports coming next week. Three of our stocks, AFLAC, Express Scripts and Fiserv, report on Tuesday, July 29. Then DirecTV reports on Thursday, July 31. (Also, earnings from Moog are due out later today. Be sure to check the blog for the latest.)
Shares of AFLAC ($AFL) have improved recently. The supplemental-insurance company has worked to diversify its investment portfolio. The yen/dollar ratio has been fairly stable since February. The company has performed well, but foreign exchange has taken a big chunk out of earnings. Three months ago, AFLAC said to expect Q2 operating earnings between $1.54 and $1.68 per share. Their full-year guidance was $6.06 to $6.40 per share. Both forecasts are based on a yen/dollar exchange rate between 100 and 105. AFLAC is a buy up to $68 per share.
In April, Express Scripts ($ESRX) beat earnings by two cents per share, but they lowered their full-year guidance to $4.82 to $4.94. That was a decrease of six cents per share at each end. Express Scripts remains a buy up to $74 per share. That’s a high Buy Below price. I may lower it after the earnings report.
Fiserv ($FISV) hit another 52-week high this week. This stock has climbed almost non-stop for the last three years. Wall Street expects Q2 earnings of 80 cents per share. Fiserv is a buy up to $64 per share. I may have to raise that soon.
DirecTV ($DTV) is still our big winner on the year, with a 25% gain. There’s not much to say about DTV since the $95 buyout deal with AT&T. DTV’s volatility has nearly evaporated, and the stock is trading like a zero-coupon bond that matures at $95 at some point. The stock is now almost exactly 10% below its merger price.
That’s all for now. More earnings to come next week. Wall Street will also have an intense 48 hours between Wednesday and Friday. On Wednesday morning, the government will release its first estimate of Q2 GDP. The Fed also meets, and later that day, the FOMC will release its latest policy statement. Friday is Jobs Day, and we’ll also get a look at the ISM report for July. Be sure to keep checking the blog for daily updates. I’ll have more market analysis for you in the next issue of CWS Market Review!
– Eddy
-
Morning News: July 25, 2014
Eddy Elfenbein, July 25th, 2014 at 6:55 amGerman Ifo Business Morale Index Falls in July
UK Economy Back at Pre-Crisis Level
Royal Bank of Scotland Chief Optimistic on Ulster Bank Solution
Will Protest or Persuasion Shape Hong Kong’s Future?
Brent Crude Back in Range Trading
Amazon’s Ambitious Bets Pile Up, and Its Losses Swell
BSkyB $8.3 Billion Deal to Create ‘Sky Europe’
McDonald’s Halts Nuggets Sales in Hong Kong
Ford’s Second-Quarter Surge May Be as Good as 2014 Gets
Vodafone Sees European Recovery After Eight-Quarter Drop
Zillow Seen Dominating U.S. Home Searches With Trulia
Anglo American Profit Sees Strong Rise Despite Setbacks
Banking Ikea Style Puts Billionaire’s Model to Test
Cullen Roche: Does QE Finance Government Spending?
Joshua Brown: Is the Fed Now Underestimating the Labor Market?
Be sure to follow me on Twitter.
-
Surprise! Uncle Sam’s Debt Has Stabilized. For Now
Eddy Elfenbein, July 24th, 2014 at 5:31 pmOn Thursday, the government will release its first report on Q2 GDP. The economy didn’t do very well in Q1, but if this report is a good one, then there’s a very good chance that this will signal that Uncle Sam finally has his debt under control—at least in the near-term.
I don’t want to overstate what’s happening, so let’s look at the facts. In April, the CBO said that this year’s budget deficit is projected to be “only” $492 billion. Of course, that’s a huge deficit, but it’s a vast improvement over the red ink we’ve seen in previous years.
In fact, according to CBO, this year’s deficit is projected to be 2.8% of GDP. Assuming nominal GDP growth exceeds that—and we’ll find out a little bit on Wednesday—that means that our debt situation has stabilized.
Specifically, the metric I’m referring to is total federal debt held by the public as a percent of GDP. It’s likely that this number will stay around 75%, give or take, for the next few years. This is quite a different story from the claims of our out-of-control debt.
Make no mistake. We still have a debt problem, but that’s on the long-term. Just this week, the CBO released a scare report. But for the short-term, our debt isn’t growing.
Let’s refer to my world-famous rule on government deficits. Take the unemployment rate, multiply it by two, then subtract 10. That’s gives us a good indication as to the deficit as a percent of GDP figure. The current unemployment rate is 6.1% which translates to a deficit of 2.2% of GDP, so the CBO is pretty close to our projection.
Here’s the debt and GDP data for some recent quarters.
Date Debt NGDP Debt/GDP Jan-12 $10.88 $16.04 67.80% Apr-12 $11.05 $16.16 68.37% Jul-12 $11.27 $16.36 68.93% Oct-12 $11.59 $16.42 70.56% Jan-13 $11.92 $16.54 72.10% Apr-13 $11.91 $16.66 71.46% Jul-13 $11.98 $16.91 70.84% Oct-13 $12.36 $17.09 72.30% Jan-14 $12.62 $17.02 74.16% Apr-14 $12.57 $17.18* 73.17% * estimate
The debt figure is debt held by the public in trillions of dollars. If you want to check the data at FRED, it’s under FYGFDPUN. The nominal GDP number is under GDP. The percent number is under FYGFGDQ188S.
For the Q2 number, I pulled the debt held by the public figure from the Treasury’s “Debt to the Penny” report. Technically, FRED pulls the number from the Treasury Bulletin report. The next one is due out in September. For Q2 nominal GDP, I estimated growth of 3.9% which is rather conservative.
Facebook Soars to $75
Eddy Elfenbein, July 24th, 2014 at 4:36 pmShares of Facebook ($FB) had a very good day thanks to a strong earnings report. The social networking site didn’t just beat earnings, they got German soccer on them. FB closed at $74.98 today which gives them a market value of $192 billion.
It was just a little over two years ago that everyone laughed at Facebook’s IPO. The underwriting price was $38 per share which was considered greedy. The stock soon dropped below $18 per share.
I guess you can say it’s recovered.
So is Facebook a good buy?
I’ve said no, and I still say no. Yes, I realize the market has gone against me, but I don’t care. If I can’t rationalize a good price, then I’ll leave it be.
Facebook still seems wildly overvalued to me. Don’t confuse that with a prediction that FB will crash. It just means I’m steering clear.
Ford Motor Earned 40 Cents per Share
Eddy Elfenbein, July 24th, 2014 at 12:31 pmFord Motor ($F) had a good second quarter. The automaker continues to get back on track. Ford earned 40 cents per share which was four cents more than estimates.
Despite lagging sales and revenue, the Dearborn, Mich.-based automaker’s cost savings in the second quarter powered it to a record quarterly profit in North America and strong showings in other markets around the world — including its first quarterly profit in Europe in three years. The exception was South America, where the company reported a loss of about $300 million.
The automaker said Thursday its net income rose to $1.3 billion, a 6 percent gain from the period a year ago. Operating earnings for the quarter exceeded Wall Street’s prediction of 36 cents a share, as Ford earned 40 cents a share — a profit of $2.6 billion — excluding one-time charges.
The stock has been as high as $18.12 today, but has since pulled back.
Initial Jobless Claims Fall to 101-Month Low
Eddy Elfenbein, July 24th, 2014 at 12:26 pmThis morning we learned that initial unemployment claims fell to 284,000 last week. That’s the lowest number since February 18, 2006. Next Friday, we’ll get the jobs report for July.
The Gold Model Revisited
Eddy Elfenbein, July 24th, 2014 at 9:31 amFour years ago, I wrote a post discussing my thoughts on how to build a model for the price of gold. That post received by far the most attention of anything I’ve written. I still get emails about it today.
Over time, I’ve thought more about this issue, and I’ve altered my thinking somewhat. I also want to clarify some points from my original post. Instead of writing an addendum to it, though, I thought it would be clearer to rewrite the whole thing. What follows is the updated version.
******************************************************************
One of the most controversial topics in investing is the price of gold. Fifteen years ago, gold dropped as low as $252 per ounce. The yellow metal then enjoyed a furious rally as it soared above $1,920 per ounce, easily outpacing the major stock-market indexes. Over the last three years, however, it has sunk back down to $1,300.
Like Linus in the pumpkin patch waiting for the Great Pumpkin, many gold bugs hold out hope. They claim that any day now, gold will resume its march upward to $2,000, then $5,000 and then $10,000 per ounce. But my question is, “How can anyone reasonably calculate what the value of gold is?”
For stocks, we have all sorts of ratios. Sure, those ratios can be off, but at least they’re something. With gold, we have nothing. No assets or liabilities. Not even a dividend. After all, gold is just a rock (OK, OK, an element). How can we even begin to analyze gold’s value? There’s an old joke that the price of gold is understood by exactly two people in the entire world. They both work for the Bank of England, and they disagree.
In this post, I want to put forth a possible model for evaluating the price of gold. The purpose of the model isn’t to say where gold will go but to look at the underlying factors that drive the price of the precious metal. Let me caution you that as with any model, this one has its flaws, but that doesn’t mean it isn’t useful. More importantly, I’ll explain why our model makes theoretical sense, rather than just mashing up numbers and seeing what correlates.
The key to understanding the gold market is understanding that it’s not really about gold at all. Instead, it’s about currencies, and in our case that means the U.S. dollar. Properly understood, gold is really the anti-currency. It serves a valuable purpose in that it keeps all the other currencies honest—or exposes their dishonesty.
This may sound odd, but every major currency has an interest rate tied to it. It doesn’t matter if it’s the euro, the pound or the yen. In essence, that interest rate is what the currency is all about.
Before I get to my model, we need to take a slight detour and discuss a fascinating paradox known as Gibson’s Paradox. This is one the most puzzling topics in economics. Gibson’s Paradox is the observation that interest rates tend to follow the general price level and not the rate of inflation. That’s very strange, because it seems obvious that as inflation rises, interest rates ought to keep up. Similarly, as inflation falls back, rates should move back as well. But historically, that hasn’t been the case. Instead, interest rates have risen as prices have gone up, and only fallen when there’s been deflation.
This paradox has totally baffled economists for years. Yet it really does exist. John Maynard Keynes called it “one of the most completely established empirical facts in the whole field of quantitative economics.” Milton Friedman and Anna Schwartz said that “the Gibsonian Paradox remains an empirical phenomenon without a theoretical explanation.”
Even many of today’s prominent economists have tried to tackle Gibson’s Paradox. In 1977, Robert Shiller and Jeremy Siegel wrote a paper on the topic. In 1988 Robert Barsky and none other than Larry Summers took on the paradox in their paper “Gibson’s Paradox and the Gold Standard.” It’s this paper that I want to focus on. (By the way, in this paper the authors thank future econo-bloggers Greg Mankiw and Brad DeLong.)
Summers and Barsky agree that the Gibson Paradox does indeed exist. They also say that it’s not connected with nominal interest rates but with real (meaning after-inflation) interest rates. The catch is that the paradox only works under a gold standard. Absent that standard, the Gibson Paradox fades away.
Now here’s my big idea: the Gibson Paradox doesn’t go away. It’s still here, just harder to see. It’s my hypothesis that Summers and Barsky were on to something, and that we can use their insight to build a model for the price of gold. The key is that gold is tied to real interest rates. Where I differ from them is that I use real short-term interest rates, whereas they focused on long-term rates.
We’re getting closer to our model, but we need to take yet another detour, this time to Sweden to discuss the great Swedish economist Knut Wicksell. Wicksell was an interesting character who wrote on many topics, but he was deeply concerned with the theory of interest rates.
Now Wicksell was an economist, and consequently he wasn’t always the clearest writer. He often seemed to get his interest rates confused. One economist referred to this as the “Wicksellian muddle.” But what’s important is that Wicksell believed there was a constant tug-of-war between two interest rates. One is the interest you see in the real world, the money rate. The other is an invisible phantom rate called the natural rate. While unseen, this natural rate does make its presence known in various ways. Wicksell believed that when the money rate drops below the natural rate, the economy grows and prices rise. When the opposite happens, the economy contracts and prices fall.
I believe that if we take the Wicksellian natural rate and view it through the prism of a still-functioning Gibson’s Paradox, we can understand how gold’s value works.
Here’s what Wicksell wrote (page 102):
There is a certain rate of interest on loans which is neutral in respect to commodity prices, and tend neither to raise nor to lower them. This is necessarily the same as the rate of interest which would be determined by supply and demand if no use were made of money and all lending were effected in the form of real capital goods. It comes to much the same thing to describe it as the current value of the natural rate of interest on capital.
Bingo! It’s that natural rate that’s the key to our model. In the first iteration of my model, I used 2%. That was wrong, but I was fooled because 2% works well enough as a long-term approximation of the Wicksellian natural rate. But the natural rate is not a constant.
Here’s how it works. Whenever the dollar’s real short-term interest rate is below the Wicksellian natural rate, gold rallies. Whenever the real short-term rate is above the natural rate, then gold falls. Just as the Knut Man describes. When gold holds perfectly still, you know you’re at the natural rate. It’s my contention that this was what the Gibson Paradox was all about, since the price of gold is tied to the general price level.
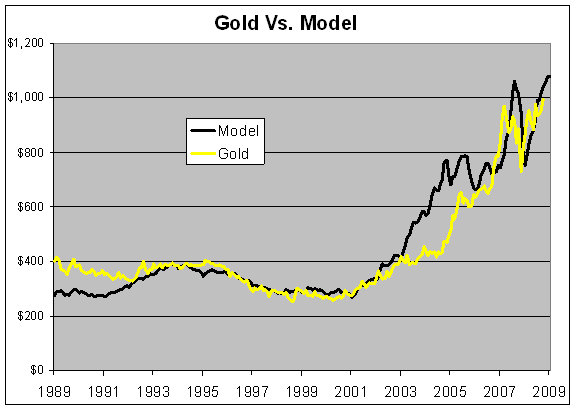
Now we get to the messy parts. There’s a lot of volatility in this relationship. According to my original model, for every one percentage point real rates differ from the natural rate, gold moves by eight times that amount per year. So if the real rates are at 1% and the natural rate is at 2%, gold will move up at an 8% annualized rate. If real rates are 2% below the natural rate, then gold will move up at a 16% rate (that was about the story from 1999 to 2011). Conversely, if the real rate jumps to 1% above the natural rate, then gold will drop at an 8% rate.
Why eight fold? There, I don’t know. When I did the back test, that number fit the best. I assume it’s a risk factor to compensate for owning gold.
Here’s the graph from my original model, bearing in mind that I used 2% as the natural rates.
I realize I have a problem with using an unspecified Wicksellian natural interest rate, since I’m using one variable to explain another variable. That’s not quite kosher in the model-building biz. Perhaps I could use the price of gold and current interest rates to reverse-engineer the Wicksellian natural rate. Gold has been falling for the last three years, even though real short-term rates have been quite low. In fact, negative. The natural rate may have fallen as well.
Let me make it clear that this is just a model, and I’m not trying to explain 100% of gold’s movement. Gold is subject to a high degree of volatility and speculation. Geopolitical events, for example, can impact the price of gold. I would also imagine that at some point, gold could break a replacement price where it became so expensive that another commodity would replace its function in industry, and the price would suffer.
Instead of explaining every aspect of gold’s behavior, my aim is to pinpoint the underlying factors that are strongly correlated with it.
There are a few key takeaways.
The first and perhaps the most significant is that gold is not tied to inflation. It’s tied to low real rates, which are often the by-product of inflation. Rising gold and low inflation isn’t a contradiction. We had both for a few years.
The second point is that when real rates are low, the price of gold can rise very, very rapidly.
The third is that when real rates are high, gold can fall very, very quickly.
Fourth, there’s no reason for there to be a relationship between equity prices and gold (like the Dow-to-gold ratio).
The final point is that the price of gold is essentially political. If a central banker has the will to raise real rates as Volcker did 35 years ago, then the price of gold can be crushed.
(You can sign up for my free newsletter here.)
Morning News: July 24, 2014
Eddy Elfenbein, July 24th, 2014 at 6:48 amEU Floats Ban on Russian Bank Financing in New Sanctions
European Central Bank Says Website Hacked, No Sensitive Data Affected
Premarket: Euro Pulls Off 8-Month Lows; China PMI Helps Emerging Stocks
SEC Tells S&P It Could Face Enforcement Action
Ford Profit Tops Estimates Europe Delivers Surprise Gain
Murdoch’s Bid for Time Warner Threatens the Golden Age of Television
Facebook Answers Critics With Mobile-Ad Surge
Nokia CEO Rajeev Suri Says Has Strong Momentum in Europe Sales
LG Electronics Beats Q2 Estimates as Mobile Division Turns Profit
Roche Profit Dented by Currencies
Unilever Sales Growth Misses Estimates on Asian Slowdown
American Apparel Names New Board in Step to Resolve Leadership Crisis
Twitter Workers: Mostly White, Mostly Male
Jeff Carter: Inflation or No Inflation?
Edward Harrison: Apple’s Shift Into China Shows the Company’s Masterful Execution
Be sure to follow me on Twitter.
Earnings from CA Technologies and Qualcomm
Eddy Elfenbein, July 23rd, 2014 at 9:07 pmAfter the bell, we got earnings reports from two of our tech stocks. CA Technologies ($CA) reported fiscal Q1 earnings of 65 cents per share which is five cents better than expectations. Revenue fell 2% to $1.069 billion. This was the ninth-straight quarter in which revenue fell.
The company released its guidance for this fiscal year, which ends in March 2015. They see revenues falling by 1% to 2%, and they expect earnings to range between $2.42 and $2.49 per share. The consensus on Wall Street had been for $2.48 per share. For last year, CA earned $3.07 per share. I’ve been patient with CA but I’m not happy with these results.
Qualcomm ($QCOM) reported fiscal Q3 earnings of $1.44 per share. That easily beat Wall Street’s forecast of $1.22 per share. Qualcomm’s business in China is going very well. But several companies there “are not fully complying with their contractual obligations.” As a result, the company had weak guidance for the current quarter. For fiscal Q4, Qualcomm sees earnings ranging between $1.20 and $1.35 which is below Wall Street’s consensus of $1.39 per share.
Nearly All of Buffett’s Wealth Came After Age 50
Eddy Elfenbein, July 23rd, 2014 at 12:02 pmThe stock market reached yet another all-time high today. The S&P 500 has been as high as 1,989.23 this morning. We’re soon going to have to start talking about 2,000.
On our Buy List, Microsoft ($MSFT) is doing well this morning. After yesterday’s earnings report, I wasn’t sure what it would do today. The stock is currently up to $45.34 which is a gain of 1.1%. The shares closed at $41.67 only two weeks ago.
At the weak end, shares of McDonald’s ($MCD) are down after some downgrades. This comes a day after missing earnings. MCD is currently off by 1.2%.
After the close, we’ll get earnings reports from CA Technologies ($CA) and Qualcomm ($QCOM). Shares of QCOM have perked up recently.
Yesterday, Bill Ackman delivered his much-anticipated presentation on Herbalife ($HLF). The advanced billing was that this will floor investors and make us realize what a terrible stock HLF is. Well, the presentation flopped and HLF soared more than 25%. Not bad for one day.
My take is that Herbalife is slimy but legit. I wouldn’t invest in them, but I wouldn’t short them either.
I wanted to share two snippets from Morgan Housel’s latest. Morgan’s a great guy and one of the best writers on finance around. His column is titled: “I Prefer to Keep Things Simple.”
The two sentences are:
“Of Warren Buffett’s $63 billion net worth, $62.7 billion was added after his 50th birthday”
“The single best stock to own of the last 50 years was cigarette giant Altria . Its stock compounded at an average of nearly 20% a year for half a century—enough to turn $1,000 into more than $8 million.”
-
Archives
- July 2026
- June 2026
- May 2026
- April 2026
- March 2026
- February 2026
- January 2026
- December 2025
- November 2025
- October 2025
- September 2025
- August 2025
- July 2025
- June 2025
- May 2025
- April 2025
- March 2025
- February 2025
- January 2025
- December 2024
- November 2024
- October 2024
- September 2024
- August 2024
- July 2024
- June 2024
- May 2024
- April 2024
- March 2024
- February 2024
- January 2024
- December 2023
- November 2023
- October 2023
- September 2023
- August 2023
- July 2023
- June 2023
- May 2023
- April 2023
- March 2023
- February 2023
- January 2023
- December 2022
- November 2022
- October 2022
- September 2022
- August 2022
- July 2022
- June 2022
- May 2022
- April 2022
- March 2022
- February 2022
- January 2022
- December 2021
- November 2021
- October 2021
- September 2021
- August 2021
- July 2021
- June 2021
- May 2021
- April 2021
- March 2021
- February 2021
- January 2021
- December 2020
- November 2020
- October 2020
- September 2020
- August 2020
- July 2020
- June 2020
- May 2020
- April 2020
- March 2020
- February 2020
- January 2020
- December 2019
- November 2019
- October 2019
- September 2019
- August 2019
- July 2019
- June 2019
- May 2019
- April 2019
- March 2019
- February 2019
- January 2019
- December 2018
- November 2018
- October 2018
- September 2018
- August 2018
- July 2018
- June 2018
- May 2018
- April 2018
- March 2018
- February 2018
- January 2018
- December 2017
- November 2017
- October 2017
- September 2017
- August 2017
- July 2017
- June 2017
- May 2017
- April 2017
- March 2017
- February 2017
- January 2017
- December 2016
- November 2016
- October 2016
- September 2016
- August 2016
- July 2016
- June 2016
- May 2016
- April 2016
- March 2016
- February 2016
- January 2016
- December 2015
- November 2015
- October 2015
- September 2015
- August 2015
- July 2015
- June 2015
- May 2015
- April 2015
- March 2015
- February 2015
- January 2015
- December 2014
- November 2014
- October 2014
- September 2014
- August 2014
- July 2014
- June 2014
- May 2014
- April 2014
- March 2014
- February 2014
- January 2014
- December 2013
- November 2013
- October 2013
- September 2013
- August 2013
- July 2013
- June 2013
- May 2013
- April 2013
- March 2013
- February 2013
- January 2013
- December 2012
- November 2012
- October 2012
- September 2012
- August 2012
- July 2012
- June 2012
- May 2012
- April 2012
- March 2012
- February 2012
- January 2012
- December 2011
- November 2011
- October 2011
- September 2011
- August 2011
- July 2011
- June 2011
- May 2011
- April 2011
- March 2011
- February 2011
- January 2011
- December 2010
- November 2010
- October 2010
- September 2010
- August 2010
- July 2010
- June 2010
- May 2010
- April 2010
- March 2010
- February 2010
- January 2010
- December 2009
- November 2009
- October 2009
- September 2009
- August 2009
- July 2009
- June 2009
- May 2009
- April 2009
- March 2009
- February 2009
- January 2009
- December 2008
- November 2008
- October 2008
- September 2008
- August 2008
- July 2008
- June 2008
- May 2008
- April 2008
- March 2008
- February 2008
- January 2008
- December 2007
- November 2007
- October 2007
- September 2007
- August 2007
- July 2007
- June 2007
- May 2007
- April 2007
- March 2007
- February 2007
- January 2007
- December 2006
- November 2006
- October 2006
- September 2006
- August 2006
- July 2006
- June 2006
- May 2006
- April 2006
- March 2006
- February 2006
- January 2006
- December 2005
- November 2005
- October 2005
- September 2005
- August 2005
- July 2005
 Eddy Elfenbein is a Washington, DC-based speaker, portfolio manager and editor of the blog Crossing Wall Street. His