Archive for September, 2015
-
Weak CPI Report for August
Eddy Elfenbein, September 16th, 2015 at 10:20 amThe inflation report for August came out this morning. Headline inflation fell 0.071% last month. So we’re talking about raising interest rates while we’re experiencing deflation. Year-over-year inflation rose from 0.17% through July to 0.20% through August.
It’s not just commodity prices. Core inflation rose by just 0.074%. That’s the lowest rate all year. Core inflation is now running at just over 2% this year.
Here’s the year-over-year inflation rate (black) along with the Fed funds rate (blue). You can see that the Fed has kept real rates negative (black higher than blue), but that’s come undone recently. In other words, by doing nothing, the Fed has effectively tightened rates.
-
High Quality Wins
Eddy Elfenbein, September 16th, 2015 at 9:40 amFrom Business Insider:
Investing in the stock market may be easier than we think, according to Chris Montagu and the equities research team at Citi.
They have identified that the strategy of investing in so-called high-quality stocks has returned 5% to 7% a year on average since 1995.
All you have to do is pick out big, boring stocks with decent profit margins, low debt, and reliable income flows.
Then sit back and wait.
-
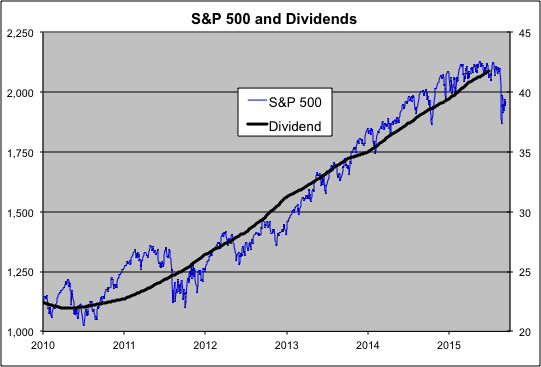
The Dividend Bull Market
Eddy Elfenbein, September 16th, 2015 at 9:32 amHere’s a look at the S&P 500 (blue line, left scale) along with its trailing dividends (black line, right scale). The two lines are scaled at a ratio of 50-to-1. That means that whenever the lines cross, the market’s dividend yield is exactly 2%.
What’s striking is that dividends have risen right along with prices. Or perhaps, vice versa. I would hardly say that the market’s dividend yield is the end-all in valuations, but the persistence of 2% is noteworthy.
Only recently has it broken down. Through June, the S&P 500 had paid out $41.74 in dividends for the previous four quarters. (That’s the index-adjusted number.) Companies are still churning out the dividend increases. Viewed from this perspective, the market is hardly a bubble. What I like about dividend analysis is how stable dividends are.
I estimate that the trailing four-quarter dividend number will be $42.65 at the end of this month. To be yielding 2%, the S&P 500 would then need to be at 2,132.50 which would be a new closing high.
-
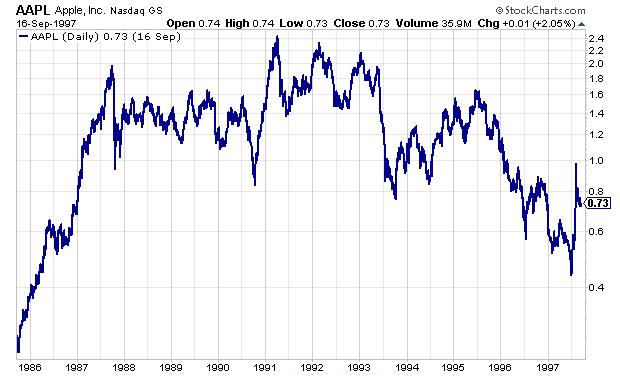
18 Years Ago Today, Steve Jobs Returns
Eddy Elfenbein, September 16th, 2015 at 8:43 amEighteen years ago today, Steve Jobs returned to Apple (AAPL), the company he founded. The stock closed that day, September 16, 1997, at $21.94 per share. Adjusted for two 2-for-1 and one 7-for-1 splits, Apple was trading at 78.3 cents per share in today’s terms. The high from this past spring was $134.54. The company is currently worth two-thirds of a trillion dollars.
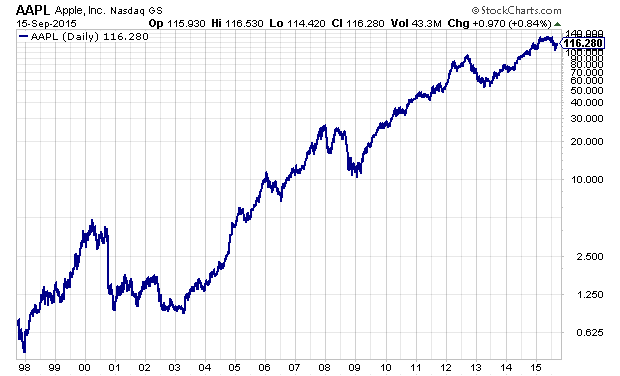
Interestingly, the stock was not an immediate hit when Jobs came back. Within a few days, it dropped down to $12.75 per share, or about 45.5 cents adjusted for splits. That was barely above Apple’s IPO price from 17 years before.
(Apple IPO’d at $22 per share; adjusted for splits of 56-for-1, that comes to 39.3 cents in today’s dollars. The IPO was the largest offering since Ford in 1956.)
At its low point in 2003, Apple was lower than where it had been in 1983. Think about that! Twenty years of no gain, and this was well after Steve Jobs had returned.
Apple’s single-worst day came on September 29, 2000 when the stock plunged 51.9%. The catalyst was that Apple said they were going to miss earnings. That was also Apple’s highest volume day. It traded over 1.8 billion shares that day.
Apple has suffered other big drops. On the day of the 1987 crash, Apple fell 24.4%. The stock has fallen more than 10% in a single day 26 times, which is nearly once per year.
Apple’s single-best day came on August 6, 1997 when it soared 33.2%. That was the day Steve Jobs, who was then an advisor to Apple, announced at a MacWorld trade show that Microsoft was investing $150 million in Apple preferred stock. That moved saved Apple. At the time, people in the crowd booed. Here’s the video:
Jobs had left Apple 30 years ago this Friday, September 18, 1985. At the time, the stock was at $16.25 per share, or 29 cents adjusted for splits. So in the 12 years of his absence, Apple had gone from 29 cents to 78 cents. That was a gain of 170%, which works out to 8.6% annually.
In the last 18 years, the stock is up nearly 150-fold, or 32% annually.
-
Morning News: September 16, 2015
Eddy Elfenbein, September 16th, 2015 at 7:07 amEurozone Inflation Slows Unexpectedly in August
Standard & Poor’s Downgrades Japan’s Sovereign Credit Rating From AA- to A+
Emerging Stocks Rally With Currencies Before Fed as China Jumps
OECD Trims Growth Outlook But Urges Fed Action This Week
Finance Replaces OPEC as Oil Supply Arbiter
Volatility Seen Lingering No Matter What the Fed Does
U.S. Retail Sales Rise 0.2%, as Consumers Show More Confidence
Anheuser-Busch InBev Approaches SABMiller on Possible Takeover
HP to Cut Up to 30,000 More Jobs in Enterprise Business
Motorola Solutions Moving Headquarters, 800 Jobs to Chicago
Comcast Creates New Enterprise Services Unit to Target Big Businesses
Microsoft Is Undervalued Ahead Of Dividend Raise
FedEx Trims 2016 Forecast as First-Quarter Earnings Fall Short
Jeff Carter: Consumer Jumps Into B2B: B2B Jumps Into Consumer
Howard Lindzon: Twitter a Buy?
Be sure to follow me on Twitter.
-
The S&P 500 and its Earnings
Eddy Elfenbein, September 15th, 2015 at 1:25 pmHere’s an updated look at the S&P 500 and its earnings line. The index is the black line and it follows the left scale. The earnings line is yellow and it follows the right. The future part of the yellow line is based on Wall Street’s consensus.
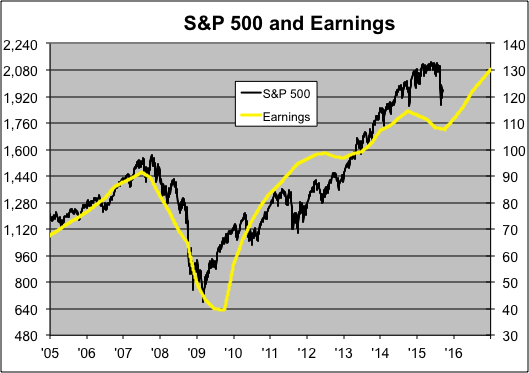
The two lines are scaled at a ratio of 16-to-1 so whenever the lines cross, the market’s P/E Ratio is exactly 16. I don’t mean to imply that’s fair value. The graph simply works best at that ratio.
-
The S&P 500 Crosses 1,970
Eddy Elfenbein, September 15th, 2015 at 1:11 pmThe stock market is up today, and the S&P 500 broke above 1,970 for the first time since last Wednesday. The VIX is below 23, and I think it’s poised to fall even low. On our Buy List, Fiserv (FISV), Hormel (HRL) and CR Bard (BCR) are within 5% of their 52-week highs.
This morning, we learned that retail sales rose by just 0.2% last month. With gasoline, retail sales were up 0.4%. Sales for July were revised higher.
Industrial production fell 0.4% last month. We’re just 1.8% above the peak before the recession.
-
Morning News: September 15, 2015
Eddy Elfenbein, September 15th, 2015 at 7:10 amEuropean Stocks Erase Drop as Metals Decline on Growth Concern
China Stocks Resume Sharp Slide as Economic Worries Mount
The Hidden Story in China’s FDI Statistics
India Seeks to Solve Inflation-Deflation Puzzle
Why the Fed Is Likely to Stand Pat This Week
One U.S. Banker Is Ready to Raise His Rates, With or Without the Fed
The U.S. Dollar Is Gaining Like It’s the 1980s — For Better or Worse
Hispanics in Congress Ask Treasury to Prevent ‘Catastrophe’ in Puerto Rico
MillerCoors to Shut North Carolina Brewery Amid Volume Declines
Pratt Prepping for Big Production Increase on F-35 Jet Engines
Praxair Buys Industrial-Gas Assets From Norway’s Yara
GM, UAW Extend Current Labor Pact Beyond Midnight Expiration
A Vinyl LP Frenzy Brings Record-Pressing Machines Back to Life
Cullen Roche: Nowhere to Hide…
Roger Nusbaum: The Fate of the Free World Hangs in the Balance
Be sure to follow me on Twitter.
-
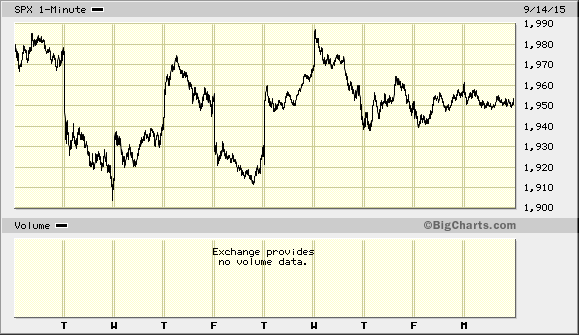
The Market Chills Out
Eddy Elfenbein, September 14th, 2015 at 4:34 pmHere’s something best shown in graph form. Notice how much the intra-day volatility has declined, especially in the last three days. Yet the VIX is still elevated. It closed today at 24.25. I think the VIX will drop very soon.
-
The Liquidity of the S&P 100
Eddy Elfenbein, September 14th, 2015 at 2:13 pmHere’s a topic that investors often overlook until it’s too late: liquidity. One of the great things about stocks is that they’re easy to sell.
Here’s a look at all the stocks in the S&P 100 (there are actually 101). I included the Market Cap (in millions), the float (in millions) and the average daily volume (in millions). The final column is the average daily volume divided by the float. In other words, what percentage of a company’s shares are traded each day. As you can see, this figure varies widely.
Ticker Market Cap Float Avg Volue Liquidity FCX $11,860 1,020 32.23 3.160% BAX $19,650 544 12.35 2.269% EBAY $32,060 1,120 20.25 1.808% HAL $31,800 853 14.39 1.688% NOV $14,830 383 6.09 1.589% FB $259,360 2,130 31.98 1.501% APA $15,200 376 4.81 1.278% GM $47,760 1,370 17.18 1.254% DVN $15,970 387 4.47 1.155% FOXA $54,780 1,630 16.96 1.040% BIIB $74,170 235 2.42 1.030% CAT $43,770 601 6.09 1.013% AAPL $651,310 5,700 57.5 1.009% AMZN $247,620 384 3.81 0.991% EXC $25,590 859 8.27 0.962% APC $33,350 507 4.46 0.880% QCOM $85,880 1,570 13.61 0.867% DOW $50,700 1,160 9.64 0.831% BAC $167,430 10,400 85.98 0.827% EMC $47,350 1,920 15.68 0.817% TGT $48,940 628 5.1 0.813% COP $58,420 1,230 9.63 0.783% TXN $48,830 1,020 7.96 0.780% MON $43,270 466 3.54 0.759% ALL $23,280 399 3.03 0.759% HPQ $48,820 1,800 13.58 0.754% F $54,400 3,880 28.88 0.744% SLB $93,260 1,270 9.44 0.743% GILD $160,890 1,460 10.68 0.732% NSC $23,860 300 2.19 0.729% INTC $140,100 4,750 33.95 0.715% EMR $30,250 653 4.59 0.703% GS $80,200 407 2.84 0.698% DIS $176,350 1,560 10.87 0.697% DD $43,830 904 6.16 0.682% MS $66,400 1,520 10.25 0.674% MET $54,200 942 6.29 0.668% FDX $42,680 262 1.75 0.667% OXY $51,110 761 4.92 0.647% AXP $75,600 999 6.4 0.640% AIG $75,470 1,290 8.22 0.637% UNP $74,730 866 5.51 0.636% C $153,800 3,010 18.93 0.629% MDLZ $68,770 1,610 10.12 0.629% MCD $91,740 941 5.87 0.624% UTX $82,230 889 5.49 0.617% SBUX $83,900 1,440 8.81 0.612% TWX $57,100 815 4.96 0.609% LOW $63,500 924 5.58 0.604% RTN $32,340 302 1.81 0.599% SO $38,800 908 5.38 0.593% COF $41,030 540 3.12 0.578% WMT $207,260 1,560 8.89 0.570% BK $43,770 1,070 6.08 0.568% CMCSA $141,620 2,490 14.07 0.565% CVX $142,620 1,880 10.48 0.557% ACN $64,140 458 2.55 0.557% ABBV $98,240 1,630 8.91 0.547% BA $91,510 679 3.65 0.538% T $201,260 6,150 32.9 0.535% CSCO $131,690 5,060 26.85 0.531% NKE $95,650 677 3.49 0.516% ORCL $164,420 3,220 16.56 0.514% UNH $113,190 938 4.46 0.475% AMGN $116,170 756 3.57 0.472% MSFT $347,750 7,410 34.43 0.465% GD $45,790 321 1.48 0.461% LLY $90,680 1,110 5.11 0.460% UPS $87,090 690 3.12 0.452% JPM $231,350 3,680 16.16 0.439% COST $61,990 436 1.91 0.438% MA $103,420 992 4.33 0.437% WBA $98,740 950 4.13 0.435% SPG $55,430 307 1.33 0.433% IBM $144,350 979 4.21 0.430% CVS $113,140 1,110 4.75 0.428% MMM $88,250 624 2.61 0.418% HD $148,240 1,280 5.35 0.418% USB $72,310 1,750 7.28 0.416% LMT $64,220 310 1.28 0.412% GOOG $426,100 585 2.38 0.407% V $172,150 1,950 7.93 0.407% MDT $98,810 1,410 5.66 0.401% ABT $64,700 1,490 5.96 0.400% PFE $203,340 6,160 24.54 0.398% BMY $98,750 1,660 6.53 0.393% GOOGL $439,080 633 2.48 0.392% HON $77,880 780 3.02 0.387% MRK $146,720 2,820 10.61 0.376% VZ $185,920 4,070 15.11 0.371% CL $55,740 897 3.32 0.370% MO $103,110 1,960 7 0.357% PG $185,630 2,710 9.59 0.354% BRK-B $306,790 1,090 3.85 0.353% XOM $303,080 4,160 14.59 0.351% PEP $134,590 1,470 4.93 0.335% KO $165,870 4,320 14.28 0.331% GE $251,910 10,090 33.34 0.330% WFC $270,120 5,120 16.44 0.321% JNJ $257,330 2,770 8.26 0.298% PM $123,110 1,550 4.02 0.259% Freeport-McMoRan (FCX) sees 3.160% of its shares traded every day. That means that the average share is held for less than 32 trading days. For Philip Morris (PM), it’s 386 trading days, or 18 months.
We turn over one-fourth of our Buy List each year. That means the average stock is held for four years, which is over 1,000 trading days.
There are some big exceptions (like eBay and Qualcomm) but for the most part, I like the stocks at the bottom of the list better than the ones at the top.
-
Archives
- July 2026
- June 2026
- May 2026
- April 2026
- March 2026
- February 2026
- January 2026
- December 2025
- November 2025
- October 2025
- September 2025
- August 2025
- July 2025
- June 2025
- May 2025
- April 2025
- March 2025
- February 2025
- January 2025
- December 2024
- November 2024
- October 2024
- September 2024
- August 2024
- July 2024
- June 2024
- May 2024
- April 2024
- March 2024
- February 2024
- January 2024
- December 2023
- November 2023
- October 2023
- September 2023
- August 2023
- July 2023
- June 2023
- May 2023
- April 2023
- March 2023
- February 2023
- January 2023
- December 2022
- November 2022
- October 2022
- September 2022
- August 2022
- July 2022
- June 2022
- May 2022
- April 2022
- March 2022
- February 2022
- January 2022
- December 2021
- November 2021
- October 2021
- September 2021
- August 2021
- July 2021
- June 2021
- May 2021
- April 2021
- March 2021
- February 2021
- January 2021
- December 2020
- November 2020
- October 2020
- September 2020
- August 2020
- July 2020
- June 2020
- May 2020
- April 2020
- March 2020
- February 2020
- January 2020
- December 2019
- November 2019
- October 2019
- September 2019
- August 2019
- July 2019
- June 2019
- May 2019
- April 2019
- March 2019
- February 2019
- January 2019
- December 2018
- November 2018
- October 2018
- September 2018
- August 2018
- July 2018
- June 2018
- May 2018
- April 2018
- March 2018
- February 2018
- January 2018
- December 2017
- November 2017
- October 2017
- September 2017
- August 2017
- July 2017
- June 2017
- May 2017
- April 2017
- March 2017
- February 2017
- January 2017
- December 2016
- November 2016
- October 2016
- September 2016
- August 2016
- July 2016
- June 2016
- May 2016
- April 2016
- March 2016
- February 2016
- January 2016
- December 2015
- November 2015
- October 2015
- September 2015
- August 2015
- July 2015
- June 2015
- May 2015
- April 2015
- March 2015
- February 2015
- January 2015
- December 2014
- November 2014
- October 2014
- September 2014
- August 2014
- July 2014
- June 2014
- May 2014
- April 2014
- March 2014
- February 2014
- January 2014
- December 2013
- November 2013
- October 2013
- September 2013
- August 2013
- July 2013
- June 2013
- May 2013
- April 2013
- March 2013
- February 2013
- January 2013
- December 2012
- November 2012
- October 2012
- September 2012
- August 2012
- July 2012
- June 2012
- May 2012
- April 2012
- March 2012
- February 2012
- January 2012
- December 2011
- November 2011
- October 2011
- September 2011
- August 2011
- July 2011
- June 2011
- May 2011
- April 2011
- March 2011
- February 2011
- January 2011
- December 2010
- November 2010
- October 2010
- September 2010
- August 2010
- July 2010
- June 2010
- May 2010
- April 2010
- March 2010
- February 2010
- January 2010
- December 2009
- November 2009
- October 2009
- September 2009
- August 2009
- July 2009
- June 2009
- May 2009
- April 2009
- March 2009
- February 2009
- January 2009
- December 2008
- November 2008
- October 2008
- September 2008
- August 2008
- July 2008
- June 2008
- May 2008
- April 2008
- March 2008
- February 2008
- January 2008
- December 2007
- November 2007
- October 2007
- September 2007
- August 2007
- July 2007
- June 2007
- May 2007
- April 2007
- March 2007
- February 2007
- January 2007
- December 2006
- November 2006
- October 2006
- September 2006
- August 2006
- July 2006
- June 2006
- May 2006
- April 2006
- March 2006
- February 2006
- January 2006
- December 2005
- November 2005
- October 2005
- September 2005
- August 2005
- July 2005
 Eddy Elfenbein is a Washington, DC-based speaker, portfolio manager and editor of the blog Crossing Wall Street. His