Archive for July, 2018
-
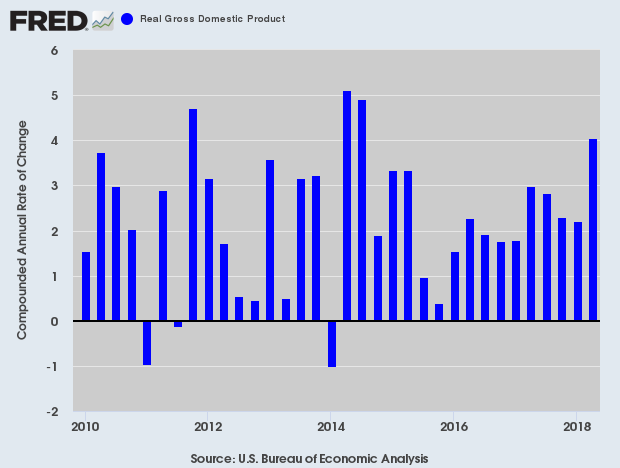
Q2 GDP = 4.1%
Eddy Elfenbein, July 27th, 2018 at 12:50 pmThe second-quarter GDP is out. The U.S. economy grew by 4.1% during the second three months of the year.
The U.S. economy grew at the strongest pace in nearly four years during the second quarter, powered by a rebound in consumer spending, strong exports and firm business investment.
Gross domestic product—the value of all goods and services produced across the economy—rose at a seasonally and inflation-adjusted annual rate of 4.1% from April through June, the Commerce Department said Friday. That was a pickup from the first quarter’s revised growth rate of 2.2%.
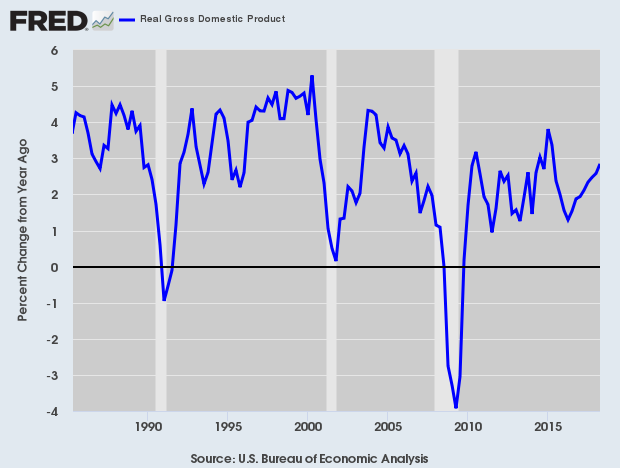
The bounce back in consumer spending “was more powerful than anticipated and speaks to the impact of an increasingly tight labor market and strong job growth on consumer income and households’ confidence,” Brian Coulton, chief economist at Fitch Ratings, said in a note to clients, adding the “numbers really bring the possibility of 3% growth for 2018 as a whole into the frame.” Compared with the second quarter a year ago, output grew 2.8%.
President Donald Trump said Friday that the U.S. economy is growing at a “very sustainable” pace and predicted that it will expand at least 3% for the year.
The president touted his own track record since taking office, saying that the economy is growing at a pace 10 times faster than during the presidencies of George W. Bush or Barack Obama.
While last quarter was good, let’s remember that the U.S. economy grew at a faster rate during the entire time from 1950 through 1978 than it did last quarter.
Here’s a look at recent quarterly growth rates:
Here’s year-over-year change in nominal GDP growth:
-
Moody’s Earned $2.04 per Share
Eddy Elfenbein, July 27th, 2018 at 9:27 amThis morning, Moody’s (MCO) reported Q2 earnings of $2.04 per share. Wall Street had been looking for $1.89 per share. Here are some details:
2Q18 revenue of $1.2 billion up 17% from 2Q17
2Q18 operating income up 16% from 2Q17; adjusted operating income up 17%1
2Q18 diluted EPS of $1.94 up 20% from 2Q17; adjusted diluted EPS of $2.04, up 32%
Reaffirming FY 2018 diluted EPS and adjusted diluted EPS guidance ranges of $7.20 to $7.40 and $7.65 to $7.85, respectively“Moody’s second quarter revenue increased 17%, reflecting strong performance at Moody’s Analytics, driven by contribution from Bureau van Dijk, as well as record revenue for Moody’s Investors Service, primarily due to robust bank loan and collateralized loan obligation market activity,” said Raymond McDaniel, President and Chief Executive Officer of Moody’s. “Additionally, we are reaffirming our full year 2018 guidance of $7.20 to $7.40 for diluted EPS and $7.65 to $7.85 for adjusted diluted EPS.”
SECOND QUARTER HIGHLIGHTS
Moody’s Corporation reported record revenue of $1.2 billion for the three months ended June 30, 2018, up 17% from the second quarter of 2017, including eight percentage points of growth attributable to Bureau van Dijk.
Operating expenses totaled $641.1 million, up 19% from the prior-year period, including 11 percentage points attributable to Bureau van Dijk operating expenses, amortization of acquired intangible assets, as well as non-recurring acquisition and integration expenses associated with the Bureau van Dijk acquisition (“Acquisition-Related Expenses”).
Operating income was $534.0 million, up 16% from the second quarter of 2017. Adjusted operating income, which excludes depreciation and amortization, as well as Acquisition-Related Expenses, was $584.4 million, up 17% from the prior-year period. Operating margin for the second quarter was 45.4% and the adjusted operating margin was 49.7%.
Diluted EPS of $1.94 was up 20% from the second quarter of 2017. Adjusted diluted EPS of $2.04 was up 32%. Second quarter 2018 adjusted diluted EPS excludes $0.10 per share related to amortization of acquired intangible assets and Acquisition-Related Expenses. Second quarter 2017 adjusted diluted EPS primarily excludes a $0.13 foreign currency hedge gain. Both second quarter 2018 diluted EPS and adjusted diluted EPS include a $0.02 per share tax benefit related to the adoption of accounting standard update ASU 2016-09, “Improvements to Employee Share-Based Payment Accounting,” compared to a $0.05 per share tax benefit in the second quarter of 2017.
Despite the earnings beat, shares of MCO lost 4.9% on Friday.
-
CWS Market Review – July 27, 2018
Eddy Elfenbein, July 27th, 2018 at 7:08 am“As time goes on, I get more and more convinced that the right method in investment is to put fairly large sums into enterprises which one thinks one knows something about and in the management of which one thoroughly believes.” – John Maynard Keynes
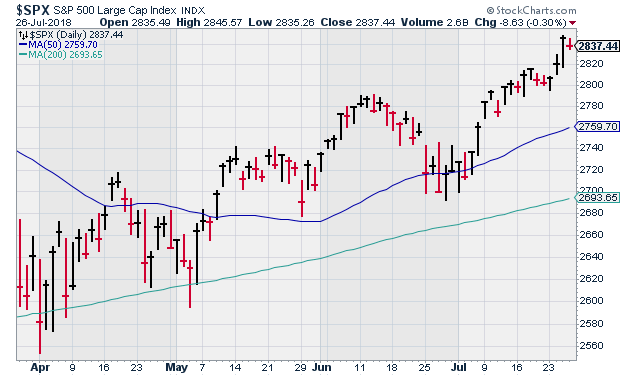
This week, the stock market inched closer to a new all-time high. In fact, we got so close that the dividend-adjusted index actually did touch a new high. The reason for the happy mood is good earnings. The earnings “beat rate” is currently running at 84%. That’s very good. Historically, the beat rate runs at about 67%.
(Note that I’m leaving out Facebook. On Thursday, traders gave the Zuck a super-atomic wedgie thanks to Facebook’s lousy earnings report. The stock lost an amazing $120 billion in market value. For some context, that’s equivalent to about $15 for every person in the world.)
Our Buy List had a very good week. Six of our stocks reported earnings, and all six beat expectations. All but one raised full-year guidance. The only one that didn’t, Check Point Software, was our best performer. CHKP beat earnings and doubled its share buyback, and the stock jumped more than 5%. There’s a lot of earnings news to get to, so let’s jump right in.
This Week’s Buy List Earnings Reports
Here’s an updated look at our Q2 Buy List Earnings Calendar:
Company Ticker Date Estimate Result Alliance Data Systems ADS 19-Jul $4.64 $5.01 Danaher DHR 19-Jul $1.09 $1.15 RPM International RPM 19-Jul $1.18 $1.05 Signature Bank SBNY 19-Jul $2.80 $2.83 Snap-On SNA 19-Jul $2.95 $3.11 Sherwin-Williams SHW 24-Jul $5.66 $5.73 Stryker SYK 24-Jul $1.73 $1.76 Wabtec WAB 24-Jul $0.93 $0.96 Check Point Software CHKP 25-Jul $1.30 $1.37 Torchmark TMK 25-Jul $1.49 $1.51 AFLAC AFL 26-Jul $0.99 $1.07 Moody’s MCO 27-Jul $1.89 Carriage Services CSV 31-Jul $0.37 Fiserv FISV 31-Jul $0.74 Becton, Dickinson BDX 2-Aug $2.86 Cerner CERN 2-Aug $0.60 Church & Dwight CHD 2-Aug $0.47 Cognizant Technology Solutions CTSH 2-Aug $1.10 Continental Building Products CBPX 2-Aug $0.45 Ingredion INGR 2-Aug $1.65 Intercontinental Exchange ICE 2-Aug $0.89 On Tuesday morning, three of our Buy List stocks reported earnings. First up is Sherwin-Williams (SHW). Going into the report, I had been concerned about some of the issues surrounding the Valspar merger. Fortunately, those issues look to be resolved.
Wall Street had been expecting earnings of $5.66 per share. In last week’s issue of CWS Market Review, I said, “they should be able to beat that.” Turns out, I was right. For Q2, Sherwin made $5.73 per share, a seven-cent beat. Sherwin also bumped up its full-year guidance range to $19.05 – $19.35 per share.
CEO John G. Morikis said, “The Company posted record results in net sales, gross profit and profit before taxes in the second quarter, aided by the Valspar acquisition, which continues to build momentum [yay!! – Eddy]. Consolidated earnings per share expanded by 26.8% percent in the quarter, excluding acquisition-related costs and environmental-expense-provisions impacts in both years. Underlying demand remained solid across most of our end market segments during the quarter. At the same time, raw-material costs continued to inflate during the quarter at a rate slightly higher than anticipated. We continue to focus on offsetting these escalating costs by controlling spending and implementing price increases.”
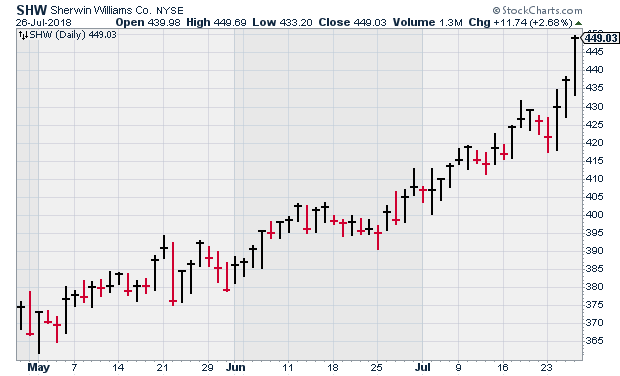
This was a good report. Shares of SHW rallied after the news and kept going. On Thursday, SHW got very close to breaking $450 per share. This year, this stock basically went from being a 10% loser to being a 10% winner. This is precisely why we use the strategy we do. This week, I’m raising my Buy Below on Sherwin to $460 per share.
Wabtec (WAB), our freight-services stock, said they made 96 cents per share for Q2, which beat estimates by three cents per share.
Raymond T. Betler, Wabtec’s president and chief executive officer, said: “Our second-quarter results were on target, and with a strong backlog and the positive indicators we see in our markets, we’re comfortable increasing our guidance for the year. Our freight business demonstrated strong growth in revenues and income from operations, and we expect demand to continue to improve. In transit, as expected we are managing through some lower-margin contracts in the short term while making long-term improvements in the core business. Overall, we’re pleased with our year-to-date performance, excited about the opportunities we see from our combination with GE Transportation and confident we can deliver improved earnings, margins and cash flow in the future.”
Wabtec also increased its full-year guidance. They expect revenues to be about $4.2 billion and EPS to be about $3.85. That doesn’t include costs related to the GE deal. WAB’s operating margin target for the full year is about 13.5%, and its effective tax rate for the full year is expected to be about 24% excluding the second-quarter tax benefit. I like these numbers.
WAB broke out to yet another new high this week. The stock is now a 33.7% winner for us this year. I’m lifting our Buy Below to $111 per share.
Stryker (SYK) was our only dud, and even that wasn’t much of a dud. The orthopedic company reported Q2 earnings of $1.76 per share. That’s above its guidance range of $1.70 to $1.75 per share. Net sales rose 10.3% to $3.3 billion.
For Q3, they’re looking for earnings between $1.65 and $1.70 per share. Wall Street had been expecting $1.69 per share. I think we dodged a bullet when the Boston Scientific deal fell through.
For all of 2018, Stryker now expects earnings to range between $7.22 and $7.27 per share. That’s their second increase this year. SYK’s initial range was $7.07 to $7.17 per share. Then it went to $7.18 to $7.25 per share. This basically means the company is baking the Q2 earnings beat into the full-year guidance. They’re not lifting second-half expectations.
The stock dropped after the earnings report, but not by much. Stryker is still a 10.7% winner for us this year. SYK is a buy up to $181 per share.
We had two more reports on Wednesday. Torchmark (TMK) reported after the bell, but it popped 3.5% on Thursday thanks to another good earnings report. Don’t let these quiet stocks fool you. This is a very good company.
For Q2, TMK made $1.51 per share. That beat estimates by two cents per share. The company also raised guidance. Torchmark’s initial guidance for this year was $5.93 to $6.07 per share. I said I thought that was too low and that they could probably hit $6.10 per share in 2018. Well, they upped their guidance range to $6.02 to $6.12 per share.
There’s not much more to say about TMK. The stock is still going for a decent valuation. TMK remains a good buy up to $91 per share.
Check Point Software (CHKP) might be our star this earnings season. On Wednesday morning, Check Point said it earned $1.37 per share for Q2. Their guidance had been for between $1.25 and 1.35 per share. The company is also doubling its share buyback from $1 billion to $2 billion.
For Q3, they expect revenues between $454 million and $474 million and EPS in the range of $1.30 to $1.40. The full-year outlook is unchanged at $5.45 to $5.75 per share. If you recall, in April, they lowered their full-year guidance. It’s good to see that the concerns from earlier this year have passed.

This is another case where our buy-and-hold strategy paid off. Shares of CHKP jumped 5.2% on Wednesday, and the stock is up more than 10% for us this year. I’m lifting our Buy Below on Check Point to $120 per share.
After the bell on Thursday, AFLAC (AFL) had a reassuring earnings report. The duck stock hasn’t been so hot lately, and I suspect that some of that was due to the yen, but the good news is that for Q2, AFLAC earned $1.07 per share. That’s quite good.
For some context, AFL previously told us they had been expecting Q2 earnings to range between 91 cents and $1.05 per share. That assumed the yen averaged between ¥100 and ¥110 to the dollar. For Q2, the exchange rate knocked off one penny per share.
The numbers were pretty solid for AFLAC. The company is bumping up its guidance for this year. The previous range was $3.72 to $3.88 per share. The new range is $3.90 to $4.06 per share. That assumes ¥112.16 yen to the dollar. You’ll notice that the increase is larger than the Q2 earnings beat, so they’re raising expectations for the second half. Going by the new guidance, it means AFLAC is going for about 11 times earnings.
For Q2, AFLAC expects earnings of 87 cents to $1.02 per share. That assumes an exchange rate of ¥110 to ¥115 to the dollar. Wall Street had been expecting 98 cents per share. AFLAC is a steady ship. I’m keeping my Buy Below on AFL at $50 per share.
Nine More Buy List Earnings Next Week
We have nine more earnings reports coming next week. There’s also Moody’s (MCO), which reports later today. For Q1, Wall Street expects $1.89 per share. (Later today, we’re also getting the initial Q2 GDP report. This could be a big story.)
On Tuesday, Carriage Services (CSV) and Fiserv are scheduled to report. In April, Carriage Services had a good earnings report. The bad news is that they lowered their guidance. The funeral-home company now expects forward fourth-quarter earnings of $1.80 to $1.85 per share. That was a decrease of 20 cents per share at both ends. The consensus for Q2 is for 37 cents per share, but that’s the average of just two analysts.
Fiserv (FISV) is having another good year. The company reiterated its full EPS forecast of $3.02 to $3.15 per share. That’s an increase of 22% to 27% over last year. The company also expects internal revenue growth of at least 4.5% this year. For Q2, Wall Street expects 74 cents per share. That sounds about right.
Next Thursday will be a very busy day for us. We have seven Buy List stocks scheduled to report.
Becton, Dickinson (BDX) is turning into a nice winner for us this year. The company sees 2018 earnings coming in between $10.90 and $11.05 per share. The analyst consensus is for $2.86 per share.
Cerner (CERN) got clocked after its last earnings report. They met expectations and lowered guidance. At one point, the stock was down 10%, but it quickly rallied back as strong stocks tend to do.
Cerner now expects 2018 earnings of $2.45 to $2.55 per share. They blamed the lower guidance on “the delay of a large contract and a less predictable end market.” For Q2, the healthcare-IT firm sees earnings coming in between 59 and 61 cents per share.
Like Sherwin-Williams, Church & Dwight (CHD) went from being a 10% loser this year to a 10% winner. For Q2, CHD expects earnings of 46 cents per share. They should top that. For the year, they’re looking for $2.24 to $2.28 per share.
Cognizant Technology (CTSH) expects Q2 earnings of at least $1.09 per share and revenues between $4 and $4.04 billion. In May, the company lowered its full-year forecast. Originally, CTSH was expecting earnings of at least $4.53 per share. Now they expect at least $4.47 per share. It’s not big, but Wall Street didn’t like it.
Continental Building Products (CBPX) missed earnings last time. It was only by a penny, but I had been expecting a beat. Business is still going well. Weather may have a played a role, but importantly, gross margins increased. Continental had announced a price increase for January 1. As a result, a lot of customers bought before that, so results in Q1 reflected the aftermath. I think it’s important that they haven’t changed their 2018 outlook.
Ingredion (INGR) is this year’s problem-child stock. There’s always one. They lowered guidance in May. Then, two weeks ago, the company warned that its Q2 results will be between $1.63 and $1.68 per share. Wall Street had been expecting $1.92 per share.
Ingredion also lowered its full-year guidance from $7.90 – $8.20 per share down to $7.50 – $7.80 per share. That’s the second time they’ve lowered guidance this year. Ingredion also announced an aggressive cost-cutting program. That usually makes me suspicious. A good company should always be looking to cut costs. I want to hear more details on their plans for this year.
Intercontinental Exchange (ICE) recently broke out its trading range. The stock seemed to be stuck between $70 and $75. Lately, however, it’s started to move. On Thursday, ICE closed at $77.05 per share, which is a new all-time high. Analysts are looking for Q2 earnings of 89 cents per share.
That’s all for now. More earnings to come next week. There will also be a Fed meeting on Tuesday and Wednesday. The policy statement is due out Wednesday afternoon at 2 pm ET. Don’t expect any rate hikes this meeting. Also on Wednesday, we’ll get the latest ISM report. Then on Friday is the July jobs report. The unemployment rate could hit a multi-decade low. Be sure to keep checking the blog for daily updates. I’ll have more market analysis for you in the next issue of CWS Market Review!
– Eddy
Syndication Partners
I’ve teamed up with Investors Alley to feature some of their content. I think they have really good stuff. Check it out!
Is the Housing Market About to Hit a Top?
Buy These Streaming Giants as Netflix’s Challenges Grow
Fake News Puts These Two Solid High-Yield Stocks on Sale
Morning News: July 27, 2018
Eddy Elfenbein, July 27th, 2018 at 7:05 amECB Keeps to Policy Path to End Bond Purchases
China Deflects Blame for Qualcomm Nixing $44 Billion NXP Deal
Trump’s Trade Truce With Europe Has a Familiar Feel: It Mirrors Obama’s Path
Amazon.com Inc. Earnings Saw $1.8 Billion in Domestic Retail Profits
How Bad Is Tesla’s Cash Position?
Twitter Projects Users to Decline, Profit Short of Estimates
BP to Buy BHP Shale Assets for More Than $10 Billion
Ex-Googler Becomes China’s 12th Richest Person
Winklevoss Twins Bitcoin ETF Rejected by SEC
Papa John’s Founder Takes Legal Action Against Pizza Chain
Lawrence Hamtil: A Few Myths and the Articles That Dispelled Them
Blue Harbinger: How Does Earnings Season Impact Your Trades?
Ben Carlson: 10 Money Revelations From Being a Parent
Be sure to follow me on Twitter.
Morning News: July 26, 2018
Eddy Elfenbein, July 26th, 2018 at 7:11 amWages Are Rising in Europe. But Economists Are Puzzled.
Facebook Just Learned the True Cost of Fixing Its Problems
Ripple Effects of Facebook Slump Already Spreading
Carpocalypse Descends on Detroit After Nightmare Day of Earnings
GM Posts Higher Profit, Lowers Outlook Amid Steel, Aluminum Costs
Qualcomm Plans to Abandon NXP Deal Amid U.S.-China Tensions
Walmart To Test Self-Driving Cars For Grocery Pickup Service
GlaxoSmithKline Is Acquiring a $300 Million Stake in Genetic-Testing Company 23andMe
Boeing’s $418 Million Tanker Writedown Rattles Investors
Comcast’s Slow Sales Underscore Appetite for Global Megadeals
Gimme a break? Nestle Suffers Another Blow in KitKat Trademark Case
Mattel Is Cutting More than 2,200 Jobs as Revenue Falls for Fourth-Straight Quarter
Joshua Brown: “How do you start a life these days?”
Roger Nusbaum: WTF Just Happened To Facebook?
Michael Batnick: Pick One Stock & Ratios
Be sure to follow me on Twitter.
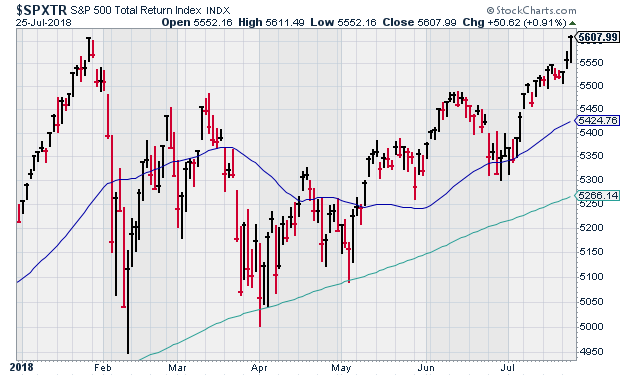
New All-Time High
Eddy Elfenbein, July 25th, 2018 at 5:33 pmThe S&P 500 Total Return Index (meaning dividend-adjusted) just closed at an all-time high. On January 26, it closed at 5,606.08 Today, it closed at 5,607.99.
Torchmark Earned $1.51 per Share
Eddy Elfenbein, July 25th, 2018 at 4:45 pmAfter the bell, Torchmark (TMK) reported Q2 earnings of $1.51 per share.
HIGHLIGHTS:
Net income as an ROE(1) was 12.2%. Net operating income as an ROE excluding net unrealized gains on fixed maturities(1) was 14.6%.
Life underwriting margins increased over the year-ago quarter by 9% and health underwriting margins increased over the year-ago quarter by 8%.Life premiums increased over the year-ago quarter by 9% at American Income and health premiums increased by 8% at Family Heritage.
Average producing agent count increased over the year-ago quarter by 9% at Liberty National.1.0 million shares of common stock were repurchased during the quarter.
Torchmark’s initial guidance for this year was $5.93 to $6.07 per share. I said I thought that was too low and that they could probably hit $6.10 per share in 2018. Well, they just upped their guidance ranged to $6.02 to $6.12 per share.
Cracks in the Economy
Eddy Elfenbein, July 25th, 2018 at 2:09 pmI want to be careful how I word this. From my view, the U.S. economy looks very good at the moment. On Friday, we’ll get our first look at Q2 GDP, and it could be a very good report. Expect to see some POTUS tweets if the report is strong.
Forecasting the economy is hard, but there are a few early warning signs. None are perfect. One of the best is the yield curve, and that’s gotten much flatter lately. Still, there have been times when the economy has jogged along for more than two years after the curve has gone negative.
Another warning sign is oil. Prices tend to spike before recessions. Or rather, the spikes may help cause the recessions. West Texas crude is down to $68 per barrel, but it was over $74 recently. That’s a big jump from last June when crude was at $42 per barrel. That eats into consumer spending.
Another concern is real estate. Today’s new-homes sales report was below expectations. It was the weakest in eight months. On top of that, the previous three months were all revised lower. We’ve also seen weak housing data from certain areas. Southern California, in particular, has been quite weak.
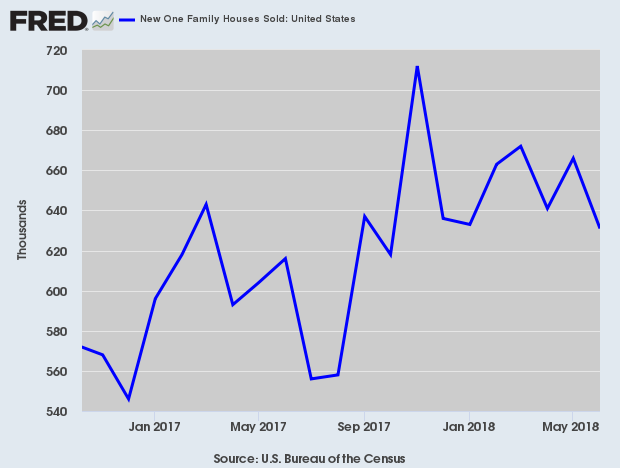
The housing market could rebound, but I am concerned that economic growth may be peaking out right now.
Check Point Earns $1.37 per Share
Eddy Elfenbein, July 25th, 2018 at 9:50 amMore good earnings news. This morning, Check Point Software (CHKP) said they earned $1.37 per share for Q2. The company is also doubling its share buyback program from $1 billion to $2 billion. Here are some highlights from the quarter.
Financial Highlights for the Second Quarter of 2018:
Total Revenue: $468 million compared to $459 million in the second quarter of 2017, a 2 percent increase year over year.
GAAP Operating Income: $224 million compared to $222 million in the second quarter of 2017, representing 48 percent of revenues in the second quarter of 2018 and 2017.
Non-GAAP Operating Income: $247 million compared to $248 million in the second quarter of 2017, representing 53 percent and 54 percent of revenues in the second quarter of 2018 and 2017, respectively.
GAAP Taxes on Income: $43 million compared to $45 million in the second quarter of 2017.GAAP Net Income and Earnings per Diluted Share: GAAP net income was $198 million compared to $188 million in the second quarter of 2017. GAAP earnings per diluted share were $1.24 compared to $1.12 in the second quarter of 2017, a 10 percent increase year over year.
Non-GAAP Net Income and Earnings per Diluted Share: Non-GAAP net income was $218 million compared to $212 million in the second quarter of 2017. Non-GAAP earnings per diluted share were $1.37 compared to $1.26 in the second quarter of 2017, an 8 percent increase year over year.
Deferred Revenues: As of June 30, 2018, deferred revenues were $1,158 million compared to $1,065 million as of June 30, 2017, a 9 percent increase year over year.
Cash Flow: Cash flow from operations of $213 million compared to $226 million in the second quarter of 2017. Year over year, currency-hedging transactions had a $25 million effect on our cash flow from operations with minimal impact on our financial income as intended. This quarter includes excess payments related to our currency hedging transactions in an amount of $14 million compared to $11 million of income in the second quarter of 2017.
Cash Balances, Marketable Securities and Short Term Deposits: $4,042 million as of June 30, 2018, compared to $3,806 million as of June 30, 2017.
Share Repurchase Program: During the second quarter of 2018 we purchased approximately 2.5 million shares at a total cost of approximately $250 million.
100% Increase in the Share Repurchase Program: Today, we announced a 100 percent increase to the share repurchase program. Under the updated plan, $2 billion is allocated for share repurchase, compared to $1 billion in the previous program, with purchases of up to $325 million a quarter, compared to $250 million in the previous program.
For Q2, they expect revenues between $454 million and $474 million and non-GAAP EPS in the range of $1.30 to $1.40. There’s no change to their full-year outlook.
Morning News: July 25, 2018
Eddy Elfenbein, July 25th, 2018 at 7:07 amThe Oil Route That Could Be Behind the Escalating Trump-Iran Threats, Explained
Trump Wants the Fed to Roll Back the U.S. Economy
New Hampshire Fights Supreme Court Sales-Tax Ruling
Pay TV Sees Mass Exodus As Cord-Cutters Jump More Than 30% In 2018
Facebook Gains Status in China, at Least for a Moment
Tesla’s ‘Alarming’ Request for Refunds Sparks Questions about Profitability
Whirlpool Loved Trump’s Tariffs. Now It’s Struggling.
Ford Follows GM’s Cruise Move With Self-Driving Spinoff
Deutsche Bank’s Sewing Dares to Talk Growth Again After Cuts
Giving In to China, U.S. Airlines Drop Taiwan (in Name at Least)
Nick Maggiulli: The Right Place, The Right Time
Lawrence Hamtil: S&P 500: Why Sector Divergences from the Index Should Not Concern You
Howard Lindzon: Google…$900 Billion and Counting
Be sure to follow me on Twitter.
-
Archives
- July 2026
- June 2026
- May 2026
- April 2026
- March 2026
- February 2026
- January 2026
- December 2025
- November 2025
- October 2025
- September 2025
- August 2025
- July 2025
- June 2025
- May 2025
- April 2025
- March 2025
- February 2025
- January 2025
- December 2024
- November 2024
- October 2024
- September 2024
- August 2024
- July 2024
- June 2024
- May 2024
- April 2024
- March 2024
- February 2024
- January 2024
- December 2023
- November 2023
- October 2023
- September 2023
- August 2023
- July 2023
- June 2023
- May 2023
- April 2023
- March 2023
- February 2023
- January 2023
- December 2022
- November 2022
- October 2022
- September 2022
- August 2022
- July 2022
- June 2022
- May 2022
- April 2022
- March 2022
- February 2022
- January 2022
- December 2021
- November 2021
- October 2021
- September 2021
- August 2021
- July 2021
- June 2021
- May 2021
- April 2021
- March 2021
- February 2021
- January 2021
- December 2020
- November 2020
- October 2020
- September 2020
- August 2020
- July 2020
- June 2020
- May 2020
- April 2020
- March 2020
- February 2020
- January 2020
- December 2019
- November 2019
- October 2019
- September 2019
- August 2019
- July 2019
- June 2019
- May 2019
- April 2019
- March 2019
- February 2019
- January 2019
- December 2018
- November 2018
- October 2018
- September 2018
- August 2018
- July 2018
- June 2018
- May 2018
- April 2018
- March 2018
- February 2018
- January 2018
- December 2017
- November 2017
- October 2017
- September 2017
- August 2017
- July 2017
- June 2017
- May 2017
- April 2017
- March 2017
- February 2017
- January 2017
- December 2016
- November 2016
- October 2016
- September 2016
- August 2016
- July 2016
- June 2016
- May 2016
- April 2016
- March 2016
- February 2016
- January 2016
- December 2015
- November 2015
- October 2015
- September 2015
- August 2015
- July 2015
- June 2015
- May 2015
- April 2015
- March 2015
- February 2015
- January 2015
- December 2014
- November 2014
- October 2014
- September 2014
- August 2014
- July 2014
- June 2014
- May 2014
- April 2014
- March 2014
- February 2014
- January 2014
- December 2013
- November 2013
- October 2013
- September 2013
- August 2013
- July 2013
- June 2013
- May 2013
- April 2013
- March 2013
- February 2013
- January 2013
- December 2012
- November 2012
- October 2012
- September 2012
- August 2012
- July 2012
- June 2012
- May 2012
- April 2012
- March 2012
- February 2012
- January 2012
- December 2011
- November 2011
- October 2011
- September 2011
- August 2011
- July 2011
- June 2011
- May 2011
- April 2011
- March 2011
- February 2011
- January 2011
- December 2010
- November 2010
- October 2010
- September 2010
- August 2010
- July 2010
- June 2010
- May 2010
- April 2010
- March 2010
- February 2010
- January 2010
- December 2009
- November 2009
- October 2009
- September 2009
- August 2009
- July 2009
- June 2009
- May 2009
- April 2009
- March 2009
- February 2009
- January 2009
- December 2008
- November 2008
- October 2008
- September 2008
- August 2008
- July 2008
- June 2008
- May 2008
- April 2008
- March 2008
- February 2008
- January 2008
- December 2007
- November 2007
- October 2007
- September 2007
- August 2007
- July 2007
- June 2007
- May 2007
- April 2007
- March 2007
- February 2007
- January 2007
- December 2006
- November 2006
- October 2006
- September 2006
- August 2006
- July 2006
- June 2006
- May 2006
- April 2006
- March 2006
- February 2006
- January 2006
- December 2005
- November 2005
- October 2005
- September 2005
- August 2005
- July 2005
 Eddy Elfenbein is a Washington, DC-based speaker, portfolio manager and editor of the blog Crossing Wall Street. His