-
Worst Paragraph of the Day
Posted by Eddy Elfenbein on November 16th, 2008 at 8:23 amNo major market problem has been resolved through self-regulation, because individual competitive behavior doesn’t concern itself with the larger market. Individual actors care only about performing better than the next guy, doing whatever is permitted — or will go undetected. Look at the major bubbles and market crises. Long-Term Capital Management, Enron, the subprime lending scandals: All are classic demonstrations of the bitter reality that greed, not self-discipline, rules where unfettered behavior is allowed.
I think greed rules even where unfettered behavior isn’t allowed.
-
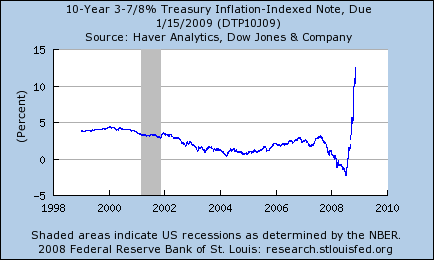
12% Real Yield
Posted by Eddy Elfenbein on November 14th, 2008 at 11:27 pmWant to make 12% after inflation? Well, for two months….
-
The Recession Gets Serious
Posted by Eddy Elfenbein on November 14th, 2008 at 10:52 amThe Brits aren’t going to the pubs:
Robert Munro buys his booze at London liquor stores these days. As his expenses rise and Britain teeters on the edge of recession, the house painter is cutting back on nights out and pouring drinks at home.
“It’s gotten more and more expensive to just head down to the pub for a drink,” said Munro, 55, who is self-employed. “You’re paying silly prices for a pint — you can drink at home for half the price.”
Five British pubs are closing their doors every day, according to the British Beer & Pub Association, as pound- pinching drinkers embrace staying in as the new going out. That may hurt beer companies like Heineken NV and Carlsberg A/S more than distillers, such as Diageo Plc, because the brewers generate the majority of their U.K. sales at bars, where profitability can be double the level in retail outlets. -
Corporate Bond Spreads
Posted by Eddy Elfenbein on November 14th, 2008 at 12:56 amHere’s a fascinating look at corporate bond yields over the past 90 years. I got the data off the Federal Reserve Bank of St. Louis’ data bank. This chart shows the yields of Moody’s index of Aaa and Baa seasoned corporate bond yields.

You’ll notice that the gap has widened significantly. This signifies what we already know, that lenders have become extremely risk-averse. Here’s a look at the difference between the two yields:
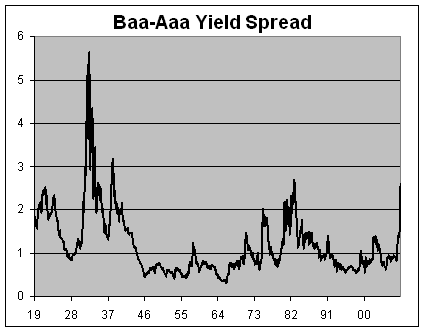
The premium for high-quality lenders is as high as it’s been since the recession of the early 1980s. We’re still a long way from the spreads we had during the Great Depression.
That data series is based on monthly averages, so to zoom in a little, let’s look at the weekly data which begins in 1962.

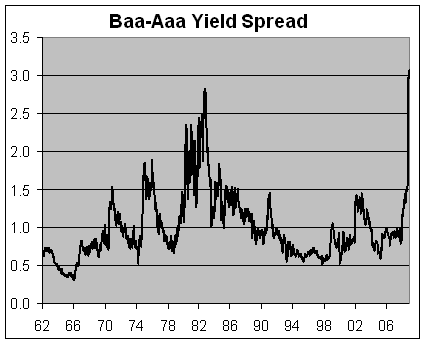
According to the daily series, which goes back to 1986, the spread reached 312 basis points on October 27. That’s the widest spread found in the daily records. According to my calculations, the entire gain of the S&P 500 has come when the spread is 96 basis points or less. The spread has been more than that every day for almost a year. -
GE’s Dividend Yield
Posted by Eddy Elfenbein on November 13th, 2008 at 11:27 am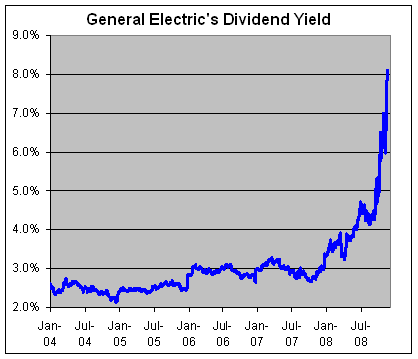
Hmmm. Something tells me that GE’s 31-cent quarterly dividend payment isn’t quite sustainable. -
When Investment Schemes Go Bad
Posted by Eddy Elfenbein on November 13th, 2008 at 10:18 amThey’re rioting in Columbia over the collapse of a pyramid scam:
Thousands of Colombians have taken part in violent protests in several cities to demand the return of money invested in disreputable financial schemes.
Police used batons and tear gas to control angry investors and curfews were declared in several cities.
In Popayan in the south-western department of Cauca, 2,000 depositors stormed an investment firm’s offices.
In Pereira, in Risaralda, police caught two men hurrying out the back door of a scheme’s office with suitcases of cash.
They offered one of the cases to the police to let them go.
The BBC’s Jeremy McDermott in Medellin says they are now in custody and that is the safest place for them, as conned investors have threatened to lynch them. -
Jim Rogers: Oil Bull Market Has Years to Go
Posted by Eddy Elfenbein on November 12th, 2008 at 2:24 pmIn the last four months, oil has dropped by $90 a barrel. I think it’s time to remind folks what the experts were telling us. Let’s start with billionaire Jim Rogers:
Jim Rogers: Oil Bull Market Has Years to Go
The bull market for oil has many years to go before it peters out, says billionaire Jim Rogers, chairman of Rogers Holdings.
There are several factors for this view, but the primary one is that “known sources of petroleum are dwindling,” Rogers told Bloomberg in an interview.
Global oil supplies could fall far short of need and expectations in the next 20 years, reported the International Energy Agency in mid-May. The agency long expected supply to rise to meet demand of 116 million barrels a day by 2030.
It now expects oil output to struggle to reach 100 million barrels in that time frame.
These market conditions will make life difficult for airlines — and airline stocks — well past 2010 and will also impact Federal Reserve policy in the coming months, Rogers said.
Rogers has proved astoundingly prescient since suggesting that investors buy into the older, industrial economy back in 1999 when gold and oil were coming off 25-year lows and when the Internet stock market was soaring. -
When Did the Recession Begin?
Posted by Eddy Elfenbein on November 12th, 2008 at 12:58 pmThe common media definition of a recession is two consecutive quarters of negative GDP growth. Technically, that’s not correct. For example, at the beginning of this decade, we never had two straight quarter of falling GDP. Three of out five were negative, yet it certainly felt like a recession to me, and lots of other folks.
The National Bureau of Economic Research is the widely-regarded outfit in charge of dating business cycles. While they regard quarterly GDP as “the single best measure of aggregate economic activity,” NBER prefers to use monthly numbers to pinpoint the precise beginning and ending of business cycles.
This is what NBER has to say about their guidelines:The committee places particular emphasis on two monthly measures of activity across the entire economy: (1) personal income less transfer payments, in real terms and (2) employment. In addition, the committee refers to two indicators with coverage primarily of manufacturing and goods: (3) industrial production and (4) the volume of sales of the manufacturing and wholesale-retail sectors adjusted for price changes. The committee also looks at monthly estimates of real GDP such as those prepared by Macroeconomic Advisers (see http://www.macroadvisers.com). Although these indicators are the most important measures considered by the NBER in developing its business cycle chronology, there is no fixed rule about which other measures contribute information to the process.
It’s not a perfect science establishing when a recession begins because we have to indentify two points: One, when does the economy not just slow down, but actually contract; and two, we need to look at the entire economy not just high-profile sectors like real estate.
NBER has already said that a recession has begun, but now it has to decide when. A decision probably won’t be made public for another year, so in the service of goodwill, I’ll try to help them out. The difficulty this time around is that the GDP figures aren’t so clear cut. Employment, for example, clearly peaked about one year ago, but exports segments of the economy still did well. GDP growth for last year’s fourth quarter was -0.17%, but I strongly doubt the committee will target a date that far back for the start of the recession. The reason is that GDP grew by 0.87% in the first quarter and another 2.82% in the second quarter (these are annualized numbers). The committee has never before overridden such strong numbers. I just don’t see them dating a starting point before then.
The issue becomes much clear by the third quarter when GDP came in at -0.25%. I also think that number will be revised lower in the months ahead. My advice is to date the start of the recession in May–right in the middle of the second quarter. There were two important events in May. The unemployment rate jumped from 5% to 5.5%. That was the largest monthly jump since 1980.
The other reason isn’t a metric that NBER uses but I think they ought to consider, and I’m referring to when the stock market broke down in May. The S&P 500 peaked last October 9 at 1565.15, however it showed some strength from mid-March to mid-May. Since May 20, however, the market has been in almost continuous retreat.
I think the stock market has evolved as a better gauge of broader economic cycles due to the democratization of Wall Street. When the market goes up, people are wealthier and they spend more. When they see their 401k’s rise, they feel more confident about buying big-ticket items. When the opposite happens, they feel less confident. Up through May, the market had suffered a break, but only since May 20 has it really deflated. That’s when the troubles started to hit everyone. -
Trying to Cross Wall Street
Posted by Eddy Elfenbein on November 11th, 2008 at 3:47 pmFrom Dealbreaker.

-
The Death of Buy and Hold?
Posted by Eddy Elfenbein on November 11th, 2008 at 12:34 pmLast night, the Fast Money crew talked about the death of buy-and-hold investing. I agree that as a strategy, it’s in intensive care, but I’m not so sure it’s quite dead yet.
First, whenever people start talking about the death of something, particularly with investing, it often the moment it’s about to surge. The classic example of this is Business Week’s “Death of Equities” cover from 1979.
The other reason for my skepticism is a misunderstanding of the arguments for buy-and-hold. I often hear people say, “Ha! The market’s down! Where’s your buy-and-hold NOW?” Well, the case for buy-and-hold isn’t that the market always goes up. Rather, it’s that buy-and-hold beats anyone else’s ability to time the market consistently, successfully and in a practical way. It’s that last part in italics that’s often overlooked.
If you can time market successfully, fine. Go do it. In my opinion, I’ve never seen anyone who can do it consistently, successfully and in a practical way.
The other part of buy-and-hold obviously depends on what you buy and what you hold. Since I don’t believe in efficient markets, I don’t see buy-and-hold as synonymous with index investing. Many do. I think it’s certainly possible for investors to make reasonable decisions that will lead them to beat the market over the long haul. For example, if you had taken some basic steps like underweighting large-cap tech stocks at the height of the bubble, you’d be in far better shape today. Small-cap value stocks have had a pretty nice run over the last ten years (except for the last three months). This year, I avoided energy stocks and large-cap financial stocks, and it’s served us well.
There’s also the issue of how long to hold a stock. I don’t see the importance of holding a stock forever, but I do see value in holding them for a considerable amount of time. Each year, I change five out of my 20 Buy List stocks. That’s translates to an average holding period of four years, which seems reasonable to me, though I can understand some buy-and-hold purists objecting.
Lastly, there’s also the issue of how long it takes a stock’s performance to reflect its true value. I think this may be one of the least-understood topics in investing. I’ll give you a brief summary. Let’s say that the stock market gains, on average, 0.05% a day with a daily standard deviation of 1%. (These numbers aren’t accurate. My point here is descriptive. I’m also aware of the problem of stocks returns and the normal distribution, but I’ll out that aside for now). That means that 95% of a stock’s daily move is simply nonsense. It had zero bearing on the stock’s true worth.
After 25 days, more than a month of trading, the stock’s average return should be 1%. The standard deviation, however, is now 5% (note: this rises by the square root of the number of days). So even after one month of patience, the noise value has dropped to 83%.
At 625 days, or nearly two-and-a-half year, the average return and the standard deviation are both 25%. This means that even after holding a stock for 30 months, it’s perfectly reasonable to expect a loss or a minimal gain.
As I mentioned before, I used those numbers for descriptive purposed. The real figures would show that even more patience is required. Buy-and-hold could be dead, but the evidence isn’t close to be full. The bottom line is that the long-term advantage of holding stocks is real, but it takes a long time to show up.
-
-
Archives
- May 2025
- April 2025
- March 2025
- February 2025
- January 2025
- December 2024
- November 2024
- October 2024
- September 2024
- August 2024
- July 2024
- June 2024
- May 2024
- April 2024
- March 2024
- February 2024
- January 2024
- December 2023
- November 2023
- October 2023
- September 2023
- August 2023
- July 2023
- June 2023
- May 2023
- April 2023
- March 2023
- February 2023
- January 2023
- December 2022
- November 2022
- October 2022
- September 2022
- August 2022
- July 2022
- June 2022
- May 2022
- April 2022
- March 2022
- February 2022
- January 2022
- December 2021
- November 2021
- October 2021
- September 2021
- August 2021
- July 2021
- June 2021
- May 2021
- April 2021
- March 2021
- February 2021
- January 2021
- December 2020
- November 2020
- October 2020
- September 2020
- August 2020
- July 2020
- June 2020
- May 2020
- April 2020
- March 2020
- February 2020
- January 2020
- December 2019
- November 2019
- October 2019
- September 2019
- August 2019
- July 2019
- June 2019
- May 2019
- April 2019
- March 2019
- February 2019
- January 2019
- December 2018
- November 2018
- October 2018
- September 2018
- August 2018
- July 2018
- June 2018
- May 2018
- April 2018
- March 2018
- February 2018
- January 2018
- December 2017
- November 2017
- October 2017
- September 2017
- August 2017
- July 2017
- June 2017
- May 2017
- April 2017
- March 2017
- February 2017
- January 2017
- December 2016
- November 2016
- October 2016
- September 2016
- August 2016
- July 2016
- June 2016
- May 2016
- April 2016
- March 2016
- February 2016
- January 2016
- December 2015
- November 2015
- October 2015
- September 2015
- August 2015
- July 2015
- June 2015
- May 2015
- April 2015
- March 2015
- February 2015
- January 2015
- December 2014
- November 2014
- October 2014
- September 2014
- August 2014
- July 2014
- June 2014
- May 2014
- April 2014
- March 2014
- February 2014
- January 2014
- December 2013
- November 2013
- October 2013
- September 2013
- August 2013
- July 2013
- June 2013
- May 2013
- April 2013
- March 2013
- February 2013
- January 2013
- December 2012
- November 2012
- October 2012
- September 2012
- August 2012
- July 2012
- June 2012
- May 2012
- April 2012
- March 2012
- February 2012
- January 2012
- December 2011
- November 2011
- October 2011
- September 2011
- August 2011
- July 2011
- June 2011
- May 2011
- April 2011
- March 2011
- February 2011
- January 2011
- December 2010
- November 2010
- October 2010
- September 2010
- August 2010
- July 2010
- June 2010
- May 2010
- April 2010
- March 2010
- February 2010
- January 2010
- December 2009
- November 2009
- October 2009
- September 2009
- August 2009
- July 2009
- June 2009
- May 2009
- April 2009
- March 2009
- February 2009
- January 2009
- December 2008
- November 2008
- October 2008
- September 2008
- August 2008
- July 2008
- June 2008
- May 2008
- April 2008
- March 2008
- February 2008
- January 2008
- December 2007
- November 2007
- October 2007
- September 2007
- August 2007
- July 2007
- June 2007
- May 2007
- April 2007
- March 2007
- February 2007
- January 2007
- December 2006
- November 2006
- October 2006
- September 2006
- August 2006
- July 2006
- June 2006
- May 2006
- April 2006
- March 2006
- February 2006
- January 2006
- December 2005
- November 2005
- October 2005
- September 2005
- August 2005
- July 2005
 Eddy Elfenbein is a Washington, DC-based speaker, portfolio manager and editor of the blog Crossing Wall Street. His