-
Virtual Recession Sparks NY Times Ad Sales Halt
Posted by Eddy Elfenbein on May 3rd, 2008 at 11:03 amWith the nation on the verge of “a near-virtual likely recession”, The New York Times stopped selling advertising today in an effort to help readers conserve “what little money they have left.”
“We realized we were sending mixed messages,” said Times publisher Arthur Ochs Sulzberger, Jr., “Our reporters and columnists say ‘Economic disaster is upon us’, but our advertisers say ‘Spend, buy, borrow’.”
“Our integrity,” he said, “demands that either we stop reporting on predictions of a very-probable, possibly-imminent, almost-certain recession-like economy, or we stop encouraging people to buy stuff, take on debt and live it up as if the world were not practically about to end.”
The moratorium on advertising sales will continue at least through January 2009, Mr. Sulzberger said, when he anticipates a positive change in what he called “the chief economic indicator,” a housing benchmark determined by which political party controls the White House. -
What Recession?
Posted by Eddy Elfenbein on May 2nd, 2008 at 11:15 amAn editorial from the New York Sun:
The common definition of a recession is two consecutive quarters of negative economic growth, as we reminded readers in a January 24, 2008, editorial, “Recession Looms?” Well, despite the determination of politicians in Washington to deliver a “stimulus” to counter a recession, despite the persistence of the huffing and puffing from Paul Krugman about how the economy is about to go into a recession, despite the harrumphing of even the likes of Alan Greenspan, somehow the recession is proving elusive.
That is certainly the indication from the Department of Commerce, which yesterday announced that the gross domestic product in the first quarter of 2008 grew at a seasonally adjusted annualized rate of 0.6%. That’s a real rate of growth, which means that the economy grew faster than inflation, which was itself not negligible. It was the same real growth rate that the government measured in the fourth quarter of 2007.
We’d like to see stronger growth, like, say, in the third quarter of 2003, when the economy started to get the feel of the Bush tax cuts and grew at an astonishing seasonally adjusted annualized rate of 7.5%. Or the year that began in April of 1983 and ended in March of 1984, when President Reagan’s supply-side measures began to work their incentives and when the American economy grew consistently at a supercharged rate of more than 8%.
But two consecutive quarters of 0.6% growth is not bad, when measured against, say, the fourth quarter of 1990 and the first quarter of 1991, when real GDP shrank at an annualized rate of 3% and 2%. That was negative growth, not merely slow growth. Another genuinely bad patch was in spring and summer of 1980. In the second quarter of 1980, growth was negative 7.8%.
What we’re seeing now — a national unemployment rate of 5.1% in March, a stock market whose indexes are up nearly 5% for the month of April — does not a recession make. In the early 1980s, we saw double-digit unemployment rates. In the early 1990s, the unemployment rate reached 7.8%. A 5.1% national unemployment rate is not a recession. There may yet be a recession, but Mr. Krugman & Co. will have to wait a bit more.
This is not to minimize the pain or hardship felt by those who have been affected by the job losses on Wall Street, who face losing their homes in a foreclosure proceeding, or who have been affected by the flight of manufacturing jobs overseas. But the American economy and the capitalist system and open markets are remarkably robust.
President Bush has now presided over 26 consecutive quarters of positive GDP growth, beginning immediately after the quarter that included the terrorist attack of September 11, 2001. President Reagan was credited with the “Seven Fat Years” in a book of that name by Robert Bartley that derived its title from Genesis. President Bush has two more quarters to go to make it to 28 quarters of growth, which would be seven fat years of his own and leave responsibility for protecting the Bush boom to whomever America elects as the next president. -
Ricepec
Posted by Eddy Elfenbein on May 1st, 2008 at 2:58 pmThailand, Vietnam, Cambodia, Myanmar and Laos are thinking about creating a rice cartel:
The plan appears to be in a nascent stage. “I think it’s time to do it, probably within the term of this administration,” Noppadon Pattama, Thailand’s foreign minister, said Wednesday.
But if successful, a cartel could have far-reaching consequences on the rice market, sustaining prices at their current historic highs and worsening a food crisis that is hurting Asia’s poorest consumers. The price of Thai B-grade rice, a benchmark variety, has nearly tripled in recent months and is now hovering at about $1,000 a ton.
Maintaining rice prices would please large-scale rice farmers and traders in countries like Thailand and Vietnam, but it would anger places like the Philippines, Singapore and Hong Kong, which rely heavily on imported rice. Plans for the cartel were front-page news in the Philippines on Thursday. -
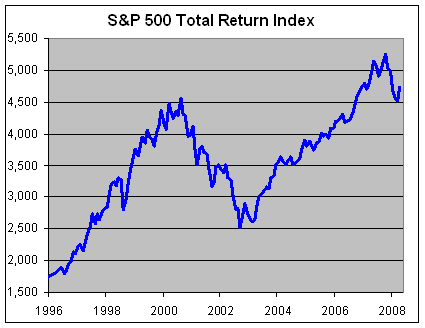
The S&P 500 Total Return Index
Posted by Eddy Elfenbein on May 1st, 2008 at 2:26 pmIncluding dividends, the S&P 500 is down -5.0% for the year, and up 8.3% for the decade.
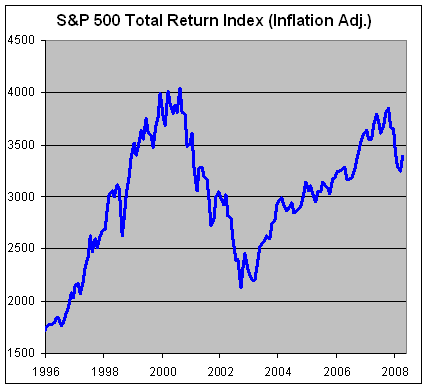
Here’s the same chart adjusted for inflation. The CPI for April hasn’t come out yet so I assumed 0.5%.
-
Timmay Radio Is Born
Posted by Eddy Elfenbein on May 1st, 2008 at 1:30 pmIf you’ve never heard of Tim Sykes, at this point, that’s probably your fault. He’s a one-man media, blogging and trading empire.
Tim has redesigned his site which now includes a podcast with yours truly. Enjoy. -
The Strange BBBY Rally
Posted by Eddy Elfenbein on May 1st, 2008 at 12:47 pmEver since Bed Bath & Beyond (BBBY) reported its poor quarter a few weeks ago, the stock has rallied. The stock is now up about 20% from its low.
We often look to clear reasons to explain stock price movements. It’s disquieting to think that sometimes there simply aren’t any. Of course, I never thought BBBY should have been that cheap to begin with. -
Setting the Bar High
Posted by Eddy Elfenbein on May 1st, 2008 at 12:43 pmIt’s got to be rough for a company that earns $10.9 billion in a quarter, and the results are called disappointing.
-
De Beers Finds Shipwreck, Treasure From Columbus Era
Posted by Eddy Elfenbein on May 1st, 2008 at 10:34 amDe Beers, the world’s biggest undersea diamond miner, said its geologists in Namibia found the wreckage of an ancient sailing ship still laden with treasure, including six bronze cannons, thousands of Spanish and Portuguese gold coins and more than 50 elephant tusks.
The wreckage was discovered in the area behind a sea wall used to push back the Atlantic Ocean in order to search for diamonds in Namibia’s Sperrgebiet or “Forbidden Zone.”
“If the experts’ assessments are correct, the shipwreck could date back to the late 1400s or early 1500s, making it a discovery of global significance,” Namdeb Diamond Corp., a joint venture between De Beers and the Namibian government, said in an e-mailed statement from the capital, Windhoek, today.
The site yielded a wealth of objects, including several tons of copper, more than 50 elephant tusks, pewter tableware, navigational instruments, weapons and the gold coins, which were minted in the late 1400s and early 1500s, according to the statement. -
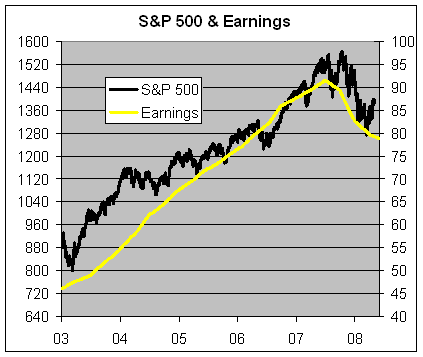
The S&P 500 and Earnings
Posted by Eddy Elfenbein on May 1st, 2008 at 10:14 amHere’s a chart of the S&P 500 (black line, left scale) and its earnings (yellow line, right scale). I scaled this graph at a ratio of 16-to-1, so whenever the lines cross, the P/E ratio is exactly 16. As you can see, even as the market has risen and sold off, the market is basically following earnings pretty closely.
-
Another 25 Points
Posted by Eddy Elfenbein on April 30th, 2008 at 2:24 pmThe Fed cuts. Here’s their statement:
The Federal Open Market Committee decided today to lower its target for the federal funds rate 25 basis points to 2 percent.
Recent information indicates that economic activity remains weak. Household and business spending has been subdued and labor markets have softened further. Financial markets remain under considerable stress, and tight credit conditions and the deepening housing contraction are likely to weigh on economic growth over the next few quarters.
Although readings on core inflation have improved somewhat, energy and other commodity prices have increased, and some indicators of inflation expectations have risen in recent months. The Committee expects inflation to moderate in coming quarters, reflecting a projected leveling-out of energy and other commodity prices and an easing of pressures on resource utilization. Still, uncertainty about the inflation outlook remains high. It will be necessary to continue to monitor inflation developments carefully.
The substantial easing of monetary policy to date, combined with ongoing measures to foster market liquidity, should help to promote moderate growth over time and to mitigate risks to economic activity. The Committee will continue to monitor economic and financial developments and will act as needed to promote sustainable economic growth and price stability.
Voting for the FOMC monetary policy action were: Ben S. Bernanke, Chairman; Timothy F. Geithner, Vice Chairman; Donald L. Kohn; Randall S. Kroszner; Frederic S. Mishkin; Sandra Pianalto; Gary H. Stern; and Kevin M. Warsh. Voting against were Richard W. Fisher and Charles I. Plosser, who preferred no change in the target for the federal funds rate at this meeting.
In a related action, the Board of Governors unanimously approved a 25-basis-point decrease in the discount rate to 2-1/4 percent. In taking this action, the Board approved the requests submitted by the Boards of Directors of the Federal Reserve Banks of New York, Cleveland, Atlanta, and San Francisco.
-
Archives
- June 2026
- May 2026
- April 2026
- March 2026
- February 2026
- January 2026
- December 2025
- November 2025
- October 2025
- September 2025
- August 2025
- July 2025
- June 2025
- May 2025
- April 2025
- March 2025
- February 2025
- January 2025
- December 2024
- November 2024
- October 2024
- September 2024
- August 2024
- July 2024
- June 2024
- May 2024
- April 2024
- March 2024
- February 2024
- January 2024
- December 2023
- November 2023
- October 2023
- September 2023
- August 2023
- July 2023
- June 2023
- May 2023
- April 2023
- March 2023
- February 2023
- January 2023
- December 2022
- November 2022
- October 2022
- September 2022
- August 2022
- July 2022
- June 2022
- May 2022
- April 2022
- March 2022
- February 2022
- January 2022
- December 2021
- November 2021
- October 2021
- September 2021
- August 2021
- July 2021
- June 2021
- May 2021
- April 2021
- March 2021
- February 2021
- January 2021
- December 2020
- November 2020
- October 2020
- September 2020
- August 2020
- July 2020
- June 2020
- May 2020
- April 2020
- March 2020
- February 2020
- January 2020
- December 2019
- November 2019
- October 2019
- September 2019
- August 2019
- July 2019
- June 2019
- May 2019
- April 2019
- March 2019
- February 2019
- January 2019
- December 2018
- November 2018
- October 2018
- September 2018
- August 2018
- July 2018
- June 2018
- May 2018
- April 2018
- March 2018
- February 2018
- January 2018
- December 2017
- November 2017
- October 2017
- September 2017
- August 2017
- July 2017
- June 2017
- May 2017
- April 2017
- March 2017
- February 2017
- January 2017
- December 2016
- November 2016
- October 2016
- September 2016
- August 2016
- July 2016
- June 2016
- May 2016
- April 2016
- March 2016
- February 2016
- January 2016
- December 2015
- November 2015
- October 2015
- September 2015
- August 2015
- July 2015
- June 2015
- May 2015
- April 2015
- March 2015
- February 2015
- January 2015
- December 2014
- November 2014
- October 2014
- September 2014
- August 2014
- July 2014
- June 2014
- May 2014
- April 2014
- March 2014
- February 2014
- January 2014
- December 2013
- November 2013
- October 2013
- September 2013
- August 2013
- July 2013
- June 2013
- May 2013
- April 2013
- March 2013
- February 2013
- January 2013
- December 2012
- November 2012
- October 2012
- September 2012
- August 2012
- July 2012
- June 2012
- May 2012
- April 2012
- March 2012
- February 2012
- January 2012
- December 2011
- November 2011
- October 2011
- September 2011
- August 2011
- July 2011
- June 2011
- May 2011
- April 2011
- March 2011
- February 2011
- January 2011
- December 2010
- November 2010
- October 2010
- September 2010
- August 2010
- July 2010
- June 2010
- May 2010
- April 2010
- March 2010
- February 2010
- January 2010
- December 2009
- November 2009
- October 2009
- September 2009
- August 2009
- July 2009
- June 2009
- May 2009
- April 2009
- March 2009
- February 2009
- January 2009
- December 2008
- November 2008
- October 2008
- September 2008
- August 2008
- July 2008
- June 2008
- May 2008
- April 2008
- March 2008
- February 2008
- January 2008
- December 2007
- November 2007
- October 2007
- September 2007
- August 2007
- July 2007
- June 2007
- May 2007
- April 2007
- March 2007
- February 2007
- January 2007
- December 2006
- November 2006
- October 2006
- September 2006
- August 2006
- July 2006
- June 2006
- May 2006
- April 2006
- March 2006
- February 2006
- January 2006
- December 2005
- November 2005
- October 2005
- September 2005
- August 2005
- July 2005
 Eddy Elfenbein is a Washington, DC-based speaker, portfolio manager and editor of the blog Crossing Wall Street. His