-
The NASDAQ Stock Market on WallStrip
Posted by Eddy Elfenbein on February 20th, 2008 at 9:48 am
The exchanges have been great stocks. NDAQ’s earnings-per-share last quarter doubled. -
A Quick Look at the Bear Market
Posted by Eddy Elfenbein on February 19th, 2008 at 1:54 pmHere’s a quick look at how some indexes have fared since the beginning of 2007.
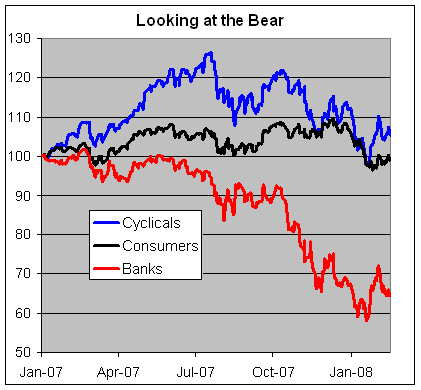
Even though the stock market is down, much of the damage has been contained to banking stocks and cyclical stocks (particularly homebuilders). Consumer stock have largely been unaffected. -
Paul Krugman’s Favorite Word
Posted by Eddy Elfenbein on February 19th, 2008 at 10:33 amAaron Schiff looks at Paul Krugman’s favorite word.
(Hat Tip: Felix Salmon) -
Rules for Sovereign Wealth
Posted by Eddy Elfenbein on February 19th, 2008 at 10:29 amOne of the issues in today’s market is the role of Sovereign Wealth Funds. Many of these funds are run by not-so-friendly countries and they’ve placed several sizeable investments in western firms.
The question many governments have is, how to deal with it. We don’t know exactly what these funds are or their objectives. Since this business is inherently international, the Financial Times opines in favor or global standards of conduct.
I think that’s a terrible idea. Unless there are anti-trust or national security concerns, the decision to sell any company should rest with the shareholders and the shareholders alone. If the great sultan of Petrostan wants to blow a few billion on some American bank that lost its shorts investing in subprime, that’s between the sultan and the shareholders.
I also think that owning parts of the west would be beneficial for these countries. It’s harder to kill off all the infidels when they’re the ones responsible for your quarterly dividend payments. -
I’m Back!
Posted by Eddy Elfenbein on February 19th, 2008 at 9:06 amI’m back—tanned, rested and ready. Actually, I’m slightly burnt, but that aside, Florida was wonderful.
Here are a few items this morning. In case you missed this, the Wall Street Journal had a great story on “Joe Herrick of Gutterman Research.” That’s the nom de conference call of some hoaxer who manages to slip into real corporate conference calls. When it’s Joe’s turn to ask a question, he lays out some hyper-wonky question to senior management. Stammering and jargon ensues.
Some CEOs are on to Joe and they find him highly annoying. Joseph Weisenthal calls him his “personal hero.” I agree, it’s pretty amusing. Most conference calls are dull, and they’re more about showcasing the analysts instead of the company.
Medtronic (MDT) reported earnings this morning of 63 cents a share, two cents better than what the Street was expecting. These results exclude very large charges dealing with legal issues and acquisitions. The company earned 61 cents a share last year.
Here’s a look at Medtronic’s sales and earnings for the past few quarters:
Quarter………..EPS………….Sales
Jul-01…………$0.28………..$1,455.70
Oct-01………..$0.29………..$1,571.00
Jan-02………..$0.30………..$1,592.00
Apr-02………..$0.34………..$1,792.00
Jul-02…………$0.32………..$1,713.90
Oct-02………..$0.34………..$1,891.00
Jan-03………..$0.35………..$1,912.50
Apr-03………..$0.40………..$2,148.00
Jul-03…………$0.37………..$2,064.20
Oct-03………..$0.39………..$2,163.80
Jan-04………..$0.40………..$2,193.80
Apr-04………..$0.48………..$2,665.40
Jul-04…………$0.43………..$2,346.10
Oct-04………..$0.44………..$2,399.80
Jan-05………..$0.46………..$2,530.70
Apr-05………..$0.53………..$2,778.00
Jul-05…………$0.50………..$2,690.40
Oct-05………..$0.54………..$2,765.40
Jan-06………..$0.55………..$2,769.50
Apr-06………..$0.62………..$3,066.70
Jul-06…………$0.55………..$2,897.00
Oct-06………..$0.59………..$3,075.00
Jan-07………..$0.61………..$3,048.00
Apr-07………..$0.66………..$3,280.00
Jul-07…………$0.62………..$3.127.00
Oct-07………..$0.58………..$3,124.00
Jan-08………..$0.61………..$3,405.00
The company also said that it wouldn’t be surprised to see Wall Street’s full-year estimate rise from $2.52 a share to $2.54 a share.
On Sunday, The New York Times profiled David Swenson, the very successful manager of Yale’s endowment. His advice to investors is, “Don’t try anything fancy. Stick to a simple diversified portfolio, keep your costs down and rebalance periodically to keep your asset allocations in line with your long-term goals.”
I agree with him and that’s pretty much the philosophy of this website. Although I disagree with his view that superior performance is impossible for individual investors. I don’t believe for a second that the little guy is “shut out.”
In fact, I think the smaller investor has many advantages over professional investors. No individual investor has to struggle to “make” a quarter or beat a benchmark. Plus, individuals are probably less willing to follow the Wall Street crowd.
The rules for beating the market are the same for everyone, buy and hold good companies going for a good price. -
The Carter Family: Are You Lonesome Tonight?
Posted by Eddy Elfenbein on February 15th, 2008 at 3:54 pm -
Is Obama Good for Business?
Posted by Eddy Elfenbein on February 14th, 2008 at 11:09 amWe better start asking now. Business Week writes:
So what would an Obama Presidency look like for business? “It would be a pragmatic, center-left administration,” says Democratic political strategist Steve McMahon, who is unaligned with a Presidential candidate this year. “He’s been pretty clear that business would have a seat at the table, but business wouldn’t be able to buy all the chairs.”
Obama’s record in the Senate is thin, but it does hold some indicators of where he might go as President. Obama has sponsored bills backing a host of traditional Democratic causes, from union labor to alternative fuel to the earned income tax credit. In one move that was unpopular among business executives, Obama sponsored a bill to give shareholders a nonbinding proxy vote on executive pay. Obama voted for a free-trade pact with Peru that contained provisos to protect the Peruvian environment and Peruvian labor. That’s popular stuff with the American left, but hard to take if you’re a U.S. business owner who wants costs to stay low in your new Peru operation. And in a reflection of the Democratic Party’s drift away from pure free-trade positions, Obama says he would look to amend the NAFTA trade agreement to add similar protections to the Clinton-era pact.In October, George Will profiled Austan Goolsbee, one of Obama’s top economic advisers.
-
UNH on Sale
Posted by Eddy Elfenbein on February 13th, 2008 at 12:29 pmIf you can pull yourself away from the Roger Clemens’ testimony, share of UnitedHealth (UNH) are on sale today. New York’s Attorney General, Andrew Cuomo, has the company in his sites:
New York Attorney General Andrew Cuomo said on Wednesday he is conducting an industry-wide probe of health insurers into an alleged scheme to defraud consumers by manipulating reimbursement rates.
At the center of the scheme is Ingenix, the nation’s provider of health care billing information, which serves as a conduit for rate data to the largest insurers in the country, Cuomo said in a statement.
Cuomo intends to sue Ingenix, its parent, UnitedHealth Group Inc, and three additional subsidiaries.
Cuomo has issued 16 subpoenas to the nation’s largest health insurance companies, including Aetna Inc, Cigna Corp and Empire Blue Cross Blue Shield.I can’t speak to the merits of the case, but the company has already projected EPS this year between $3.95 and $4. If you’re willing to wait, this is a good entry point.
-
DC Ward and Precinct Primary Results
Posted by Eddy Elfenbein on February 13th, 2008 at 6:34 amMy psuedo-state had its primary!
Here’s a spreadsheet of the unofficial results by each ward and precinct in the city of Washington. The Democrats are listed up top and the Republicans are below. (In Washington, it’s hard to tell if you have all the Republican votes, or if no one voted.)
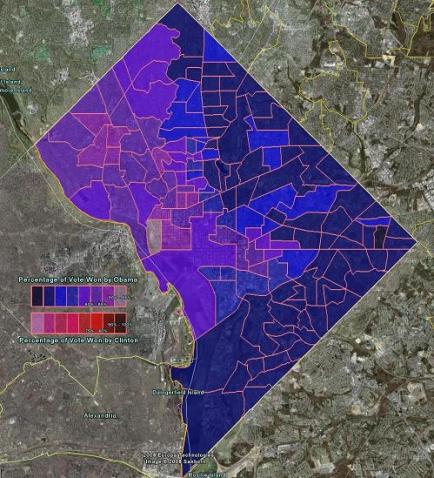
On Democratic side, Obama creamed Hillary by more than 3-to-1. He won all eight wards and all 142 precincts. He even got majorities in every precinct too.
Because no one cares about us, there were no exit polls. So I got some demographic data off the web and ran a few regressions to see if I could estimate the breakdown.
My results show that African-Americans went for Obama by 86%, while whites and Hispanics both went 59% for Obama. Yep, that’ll pretty much carry you across the goal line.
There were 114,001 Democratic votes to just 5,803 Republican votes, that’s an edge of close to 20-to-1. Still, the GOP primary was for 19 delegates which seems absurdly high. By comparison, Virginia’s GOP primary had about 80 times the number of voters for just 63 delegates.
John McCain easily won the DC GOP primary, getting about four times as many votes as Mike Huckabee. Although Huckabee did pull out a narrow two-vote victory in DC’s 7th ward (56 to 54). Barack Obama got about 15,000 votes in the same ward.
The 9th Precinct in upper Northwest is DC’s most right-wing precinct which ain’t saying much. Kerry beat Bush in the 9th, 60%-38%. Still, it’s the Utah of Washington and McCain carried it with 87% of the vote.
I live in the 24th precinct where Obama beat Hillary by about 2-to-1. There were 881 Democratic voters to just 40 GOP votes. McCain got 29 votes. Ron Paul came in second with five. Huckabee had four and Guiliani got two.
Here’s a “heat map” of Obama’s support made by Adam Baily at DCist.com. The Nation’s Capital is clearly the ultimate blue state:
-
Life Imitates the Onion
Posted by Eddy Elfenbein on February 12th, 2008 at 4:32 pmSeattle Times, February 12, 2008
Starbucks stores to shut 3 hours on Feb. 26 for retraining baristas
The Onion, March 14, 2004
-
Archives
- June 2026
- May 2026
- April 2026
- March 2026
- February 2026
- January 2026
- December 2025
- November 2025
- October 2025
- September 2025
- August 2025
- July 2025
- June 2025
- May 2025
- April 2025
- March 2025
- February 2025
- January 2025
- December 2024
- November 2024
- October 2024
- September 2024
- August 2024
- July 2024
- June 2024
- May 2024
- April 2024
- March 2024
- February 2024
- January 2024
- December 2023
- November 2023
- October 2023
- September 2023
- August 2023
- July 2023
- June 2023
- May 2023
- April 2023
- March 2023
- February 2023
- January 2023
- December 2022
- November 2022
- October 2022
- September 2022
- August 2022
- July 2022
- June 2022
- May 2022
- April 2022
- March 2022
- February 2022
- January 2022
- December 2021
- November 2021
- October 2021
- September 2021
- August 2021
- July 2021
- June 2021
- May 2021
- April 2021
- March 2021
- February 2021
- January 2021
- December 2020
- November 2020
- October 2020
- September 2020
- August 2020
- July 2020
- June 2020
- May 2020
- April 2020
- March 2020
- February 2020
- January 2020
- December 2019
- November 2019
- October 2019
- September 2019
- August 2019
- July 2019
- June 2019
- May 2019
- April 2019
- March 2019
- February 2019
- January 2019
- December 2018
- November 2018
- October 2018
- September 2018
- August 2018
- July 2018
- June 2018
- May 2018
- April 2018
- March 2018
- February 2018
- January 2018
- December 2017
- November 2017
- October 2017
- September 2017
- August 2017
- July 2017
- June 2017
- May 2017
- April 2017
- March 2017
- February 2017
- January 2017
- December 2016
- November 2016
- October 2016
- September 2016
- August 2016
- July 2016
- June 2016
- May 2016
- April 2016
- March 2016
- February 2016
- January 2016
- December 2015
- November 2015
- October 2015
- September 2015
- August 2015
- July 2015
- June 2015
- May 2015
- April 2015
- March 2015
- February 2015
- January 2015
- December 2014
- November 2014
- October 2014
- September 2014
- August 2014
- July 2014
- June 2014
- May 2014
- April 2014
- March 2014
- February 2014
- January 2014
- December 2013
- November 2013
- October 2013
- September 2013
- August 2013
- July 2013
- June 2013
- May 2013
- April 2013
- March 2013
- February 2013
- January 2013
- December 2012
- November 2012
- October 2012
- September 2012
- August 2012
- July 2012
- June 2012
- May 2012
- April 2012
- March 2012
- February 2012
- January 2012
- December 2011
- November 2011
- October 2011
- September 2011
- August 2011
- July 2011
- June 2011
- May 2011
- April 2011
- March 2011
- February 2011
- January 2011
- December 2010
- November 2010
- October 2010
- September 2010
- August 2010
- July 2010
- June 2010
- May 2010
- April 2010
- March 2010
- February 2010
- January 2010
- December 2009
- November 2009
- October 2009
- September 2009
- August 2009
- July 2009
- June 2009
- May 2009
- April 2009
- March 2009
- February 2009
- January 2009
- December 2008
- November 2008
- October 2008
- September 2008
- August 2008
- July 2008
- June 2008
- May 2008
- April 2008
- March 2008
- February 2008
- January 2008
- December 2007
- November 2007
- October 2007
- September 2007
- August 2007
- July 2007
- June 2007
- May 2007
- April 2007
- March 2007
- February 2007
- January 2007
- December 2006
- November 2006
- October 2006
- September 2006
- August 2006
- July 2006
- June 2006
- May 2006
- April 2006
- March 2006
- February 2006
- January 2006
- December 2005
- November 2005
- October 2005
- September 2005
- August 2005
- July 2005
 Eddy Elfenbein is a Washington, DC-based speaker, portfolio manager and editor of the blog Crossing Wall Street. His