-
Health Care Stocks
Posted by Eddy Elfenbein on November 14th, 2006 at 2:20 pmI remember when health care stocks use to go up. Not anymore. Here’s a chart of the Health Care ETF (XLV) versus the S&P 500:
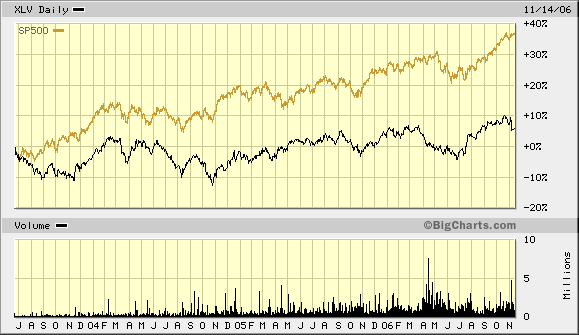
This doesn’t look overheated to me. -
USA! USA!
Posted by Eddy Elfenbein on November 14th, 2006 at 2:08 pmU.S. Still World Economic Leader
Hey Canada: STFU! -
Two Percent Down Days
Posted by Eddy Elfenbein on November 14th, 2006 at 1:14 pmThe S&P 500 hasn’t had a down day of 2% or more since May 19, 2003. That’s the longest streak ever according to my data which goes back to 1950. Here are the other streaks, when they ended and how many days.
11/14/06 1275 (current)
10/31/78 1168
1/8/86 1080
5/14/73 1056
7/28/69 1029
8/26/66 1008 -
What’s Dennis Up to These Days?
Posted by Eddy Elfenbein on November 14th, 2006 at 10:27 amRemember Dennis Kozlowski? Me neither. Apparently, he used to be somewhat important. In any event, Bloomberg visits Denny in the Greybar Hotel:
Kozlowski now plays baseball and softball behind the barbed wire and steel doors of the state prison. He’s passes time reading biographies of U.S. presidents and Che Guevara, the revolutionary leader. His latest book, given to him by a former Tyco employee, details the life of Madame Chiang Kai-shek.
“I probably read over 100 books,” he said.
His wife Karen filed for divorce last summer. The birthday party Kozlowski threw for her on Sardinia in 2001 was among many Tyco-financed extravagances presented to the jury that convicted him. He declined to talk about Karen.
Kozlowski is one of 12 men housed in the protective custody unit at Mid-State, Foglia said. He’s allowed to spend 16 hours a day outside his cell and works as a dining room attendant and a teacher’s aide.
“He’s not making anything more than $1.05 a day,” Foglia said.LOL
-
WallStrip on Digital River
Posted by Eddy Elfenbein on November 14th, 2006 at 10:13 amToday, Linday & Co. take a look at Digital River (DRIV).
If you can’t get enough Lindsay, here she is not getting the guy in a Volvo commercial. And here she is expecting triplets in an ad for Lowe’s (LOW). Enjoy. -
Home Depot Misses Earnings
Posted by Eddy Elfenbein on November 14th, 2006 at 9:55 amThe housing market has taken another casualty. Today, Home Depot (HD) reported earnings of 73 cents a share, two cents below estimates. Overall revenues rose 11.3%, but same-store sales dropped 5.1%.
Going forward, Home Depot said it believes its fiscal 2006 earnings per share will grow 4 percent to 5 percent over fiscal 2005 and that sales will grow for the year by about 12 percent. It had earlier projected earnings per share growth for the year to be on the low end of a range of 10 percent to 14 percent and sales growth for the year to be on the low end of a range of 14 percent to 17 percent.
-
Earnings Preview: Home Depot
Posted by Eddy Elfenbein on November 13th, 2006 at 1:48 pmFrom AP:
OVERVIEW: As the housing market cools off, home-improvement companies are suffering as well. Falling lumber prices have cut into revenue, and several suppliers have reported lower results and outlooks recently, including Home Depot’s largest supplier, Masco Corp.
In an effort to improve performance, Home Depot in October said it is putting chief executive Bob Nardelli in closer contact with top leaders throughout the company, with the four division presidents in the U.S. and Mexico reporting directly to him.
Chief Financial Officer Carol Tome also took responsibility for supporting store operations, including asset protection and customer service initiatives.
Home Depot is also reviewing Nardelli’s compensation in light of a sagging stock price.
In September, the company said it would hire 1,000 new employees across the country, part of a plan to invest $350 million in its stores during the second half of the year. In August Home Depot cut 300 jobs at its headquarters in Atlanta as part of the plan.
BY THE NUMBERS: Analysts are looking for a profit of 75 cents per share on revenue of $23.39 billion, according to a Thomson Financial poll.
ANALYST TAKE: Credit Suisse analyst Gary Balter, who rates shares of Home Depot “Neutral,” forecast earnings of 74 cents per share and expects investors to pay as much attention to whether Home Depot meets expectations as how it get there and where it’s going.
“Meeting expectations on cost cuts and share repurchases will not satisfy investors, in our view,” Balter wrote in a note on Monday.
He expects Home Depot to lower its 2007 earnings growth guidance of 10 percent, or $3. “Should they move closer to our level of $2.90 vs. consensus of $2.95, that could pressure shares,” Balter wrote. “More important are comments on how protracted the slowdown will be.”
Danielle Fox of Merrill Lynch, who rates Home Depot’s stock as a “Buy,” expects earnings in line with consensus.
“Existing home sales slowed in the relevant six-month prior period, commodity prices are down, and the company is lapping last year’s 37 basis point comps lift from hurricanes,” she wrote in a Nov. 6 analyst note. “We expect the revenue contribution from Home Depot Supply, cost controls, and accretive share repurchases to drive modest growth this quarter as the company reinvests in store labor to improve service levels.” -
Blogging Silicon Valley
Posted by Eddy Elfenbein on November 13th, 2006 at 11:13 amBambi Francisco writes that Gawker founder, Nick Denton, will temporarily take over reporting duties at ValleyWag, his Silicon Valley gossip site. He said that he wants to bring in more business gossip instead of just personal gossip.
He tells me that he has a juicy scoop about John Battelle’s Federated Media advertising network losing a major client. The loss is a “slap in the face” to Battelle, says Denton, who self-funded Gawker Media, which was launched in 2002.
Denton hopes to triple the traffic at ValleyWag, which he said was getting an average of 20,000 or so daily pageviews. He doesn’t plan on changing the tone too much, just mixing in financial news gossip with tabloid gossip. “We’ll still publish the scoop on Larry Page’s inhouse dating, or Eric Schmidt’s long-time adultery,” he said, via AOL’s IM. I asked Denton why publishing lies about Schmidt added any value or was worth reporting on. His response: “What lies about Schmidt?” he askded. “There are a host of open secrets in Silicon Valley — which all the insiders know, and gossip about. Valleywag’s role is to reflect that conversation, and open it up to the wider world.”If Nick truly intends to step it up over at Valleywag by improving its financial and business reporting, I am sure he will exercise a long held journalistic skill: understanding the business model of the subjects he’s writing about before presuming to judge them, and contacting us for comment before publishing rumor or speculation.
Oooh burn.
-
Dell Creeps Higher
Posted by Eddy Elfenbein on November 13th, 2006 at 10:36 amDell‘s (DELL) earnings report is due on Thursday. The stock has gradually been creeping higher. Today the shares reached a five-month high. Does the market know something? It’s hard to say, but at least we haven’t had an earnings warning yet. The Street is expecting earnings of 24 cents a share, although no analyst is willing to go higher than 26 cents a share. This will be interesting to see.
-
My Favorite YouTube Spots
Posted by Eddy Elfenbein on November 11th, 2006 at 5:11 pmSince you probably have too much free time on your hands, I’d thought I’d share with you some of my favorite You Tube videos.
Miles Davis & John Coltrane
Hendrix at Woodstock
Carson/Dragnet Skit
The Little Lebowski
Bunnies Doing Jaws
The Brady Bunch Variety Hour
Johnny Cash 1959
Grateful Dead on Playboy After Dark
Goal for Scotland
Groucho at His Best
Frances Gumm
-
Archives
- July 2026
- June 2026
- May 2026
- April 2026
- March 2026
- February 2026
- January 2026
- December 2025
- November 2025
- October 2025
- September 2025
- August 2025
- July 2025
- June 2025
- May 2025
- April 2025
- March 2025
- February 2025
- January 2025
- December 2024
- November 2024
- October 2024
- September 2024
- August 2024
- July 2024
- June 2024
- May 2024
- April 2024
- March 2024
- February 2024
- January 2024
- December 2023
- November 2023
- October 2023
- September 2023
- August 2023
- July 2023
- June 2023
- May 2023
- April 2023
- March 2023
- February 2023
- January 2023
- December 2022
- November 2022
- October 2022
- September 2022
- August 2022
- July 2022
- June 2022
- May 2022
- April 2022
- March 2022
- February 2022
- January 2022
- December 2021
- November 2021
- October 2021
- September 2021
- August 2021
- July 2021
- June 2021
- May 2021
- April 2021
- March 2021
- February 2021
- January 2021
- December 2020
- November 2020
- October 2020
- September 2020
- August 2020
- July 2020
- June 2020
- May 2020
- April 2020
- March 2020
- February 2020
- January 2020
- December 2019
- November 2019
- October 2019
- September 2019
- August 2019
- July 2019
- June 2019
- May 2019
- April 2019
- March 2019
- February 2019
- January 2019
- December 2018
- November 2018
- October 2018
- September 2018
- August 2018
- July 2018
- June 2018
- May 2018
- April 2018
- March 2018
- February 2018
- January 2018
- December 2017
- November 2017
- October 2017
- September 2017
- August 2017
- July 2017
- June 2017
- May 2017
- April 2017
- March 2017
- February 2017
- January 2017
- December 2016
- November 2016
- October 2016
- September 2016
- August 2016
- July 2016
- June 2016
- May 2016
- April 2016
- March 2016
- February 2016
- January 2016
- December 2015
- November 2015
- October 2015
- September 2015
- August 2015
- July 2015
- June 2015
- May 2015
- April 2015
- March 2015
- February 2015
- January 2015
- December 2014
- November 2014
- October 2014
- September 2014
- August 2014
- July 2014
- June 2014
- May 2014
- April 2014
- March 2014
- February 2014
- January 2014
- December 2013
- November 2013
- October 2013
- September 2013
- August 2013
- July 2013
- June 2013
- May 2013
- April 2013
- March 2013
- February 2013
- January 2013
- December 2012
- November 2012
- October 2012
- September 2012
- August 2012
- July 2012
- June 2012
- May 2012
- April 2012
- March 2012
- February 2012
- January 2012
- December 2011
- November 2011
- October 2011
- September 2011
- August 2011
- July 2011
- June 2011
- May 2011
- April 2011
- March 2011
- February 2011
- January 2011
- December 2010
- November 2010
- October 2010
- September 2010
- August 2010
- July 2010
- June 2010
- May 2010
- April 2010
- March 2010
- February 2010
- January 2010
- December 2009
- November 2009
- October 2009
- September 2009
- August 2009
- July 2009
- June 2009
- May 2009
- April 2009
- March 2009
- February 2009
- January 2009
- December 2008
- November 2008
- October 2008
- September 2008
- August 2008
- July 2008
- June 2008
- May 2008
- April 2008
- March 2008
- February 2008
- January 2008
- December 2007
- November 2007
- October 2007
- September 2007
- August 2007
- July 2007
- June 2007
- May 2007
- April 2007
- March 2007
- February 2007
- January 2007
- December 2006
- November 2006
- October 2006
- September 2006
- August 2006
- July 2006
- June 2006
- May 2006
- April 2006
- March 2006
- February 2006
- January 2006
- December 2005
- November 2005
- October 2005
- September 2005
- August 2005
- July 2005
 Eddy Elfenbein is a Washington, DC-based speaker, portfolio manager and editor of the blog Crossing Wall Street. His