-
The 50-DMA Holds and the Market Rebounds
Posted by Eddy Elfenbein on July 20th, 2021 at 11:10 am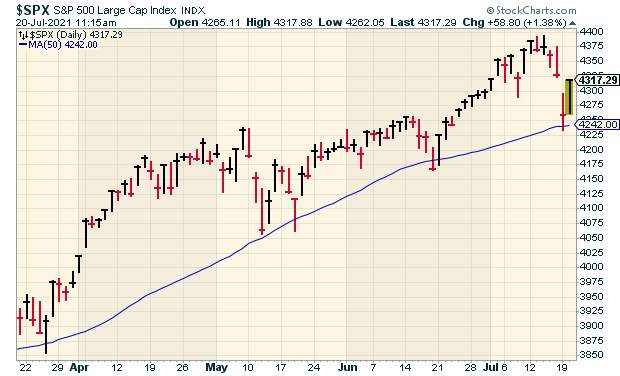
Yesterday, the S&P 500 dipped below its 50-day moving average but importantly, did not close below it. The market is rebounding nicely today.
Some of the big losers yesterday were airlines and cruise stocks. In other words, companies tied to lockdowns. That’s the fear hanging over Wall Street.
This week is all about earnings. We’ll get our first two Buy List earnings reports on Thursday.
This morning’s housing starts report showed an increase for June. Housing starts increased 6.3% to a seasonally adjusted annual rate of 1.643 million. Economists had been expecting an increase of 1.590 million.
The other report was for building permits. That dropped by 5.1% last month. Since May, lumber futures are down 70%.
-
Morning News: July 20, 2021
Posted by Eddy Elfenbein on July 20th, 2021 at 7:03 amU.S. Recession Ended in April 2020, Making It Shortest on Record
Inflation Is Here — These 35 Metrics Tell You How Much to Worry
As Stablecoins Explode in Popularity, Regulators Prepare A Response
‘A Lot of Very Young People’ Are Going to Buy the Dip in Stocks
The Battles to Come Over the Benefits of Working From Home
‘Game Over’: Food Carts Adjust to a Changed City
Top Brewers Toast Easing of Pandemic Curbs with Zero Alcohol Beer
The Invisible Hand Behind the Tokyo Olympics
Running Low on Battery Power: Brexit Britain Faces an Acid Test
In Push to Supply Tesla, Piedmont Lithium Irks North Carolina Neighbors
Israel Warns Unilever Chief Over Ben & Jerry’s Boycott
Ben & Jerry’s Will Stop Selling Ice Cream in Palestinian Territories
LVMH Gives Designer Virgil Abloh Bigger Role, Buys Stake in Off-White
SPAC U-Turn Mars Ackman’s Hedge Fund Pivot
Another Senior Goldman Sachs Executive Is Leaving – And Colleagues Are Vexed
Be sure to follow me on Twitter.
-
NBER Calls the Official Recession Dates
Posted by Eddy Elfenbein on July 19th, 2021 at 2:44 pmThe National Bureau of Economic Research is widely considered to the be the official standard for dating economic recessions.
They just called the most recent recession. The peak was in February 2020 and the trough was in April 2020. This was the fastest recession on record.
The Business Cycle Dating Committee of the National Bureau of Economic Research maintains a chronology of the peaks and troughs of US business cycles. The committee has determined that a trough in monthly economic activity occurred in the US economy in April 2020. The previous peak in economic activity occurred in February 2020. The recession lasted two months, which makes it the shortest US recession on record.
The NBER chronology does not identify the precise moment that the economy entered a recession or expansion. In the NBER’s convention for measuring the duration of a recession, the first month of the recession is the month following the peak and the last month is the month of the trough. Because the most recent trough was in April 2020, the last month of the recession was April 2020, and May 2020 was the first month of the subsequent expansion.
You’ll often hear that a recession is two or more quarters of negative economic growth. That’s not exactly right. From their website:
In determining the dates of business cycle turning points, the committee follows standard procedures to assure continuity in the chronology. Because a recession must influence the economy broadly and not be confined to one sector, the committee emphasizes economy-wide measures of economic activity. It views real gross domestic product (GDP) as the single best measure of aggregate economic activity. This concept is measured two ways by the US Bureau of Economic Analysis (BEA)—from the expenditure side and from the income side. Because the two measures have strengths and weaknesses and differ by a statistical discrepancy, the committee considers real GDP and real gross domestic income (GDI) on an equal footing. It also places considerable weight on total payroll employment as measured by the Bureau of Labor Statistics (BLS).
-
The Peak of the Presidential Cycle
Posted by Eddy Elfenbein on July 19th, 2021 at 11:16 amWe’re coming up on the traditional peak in the four-year presidential cycle.
I took the entire history of the Dow Jones back to 1896 and crunched how it performs in four-year segments.
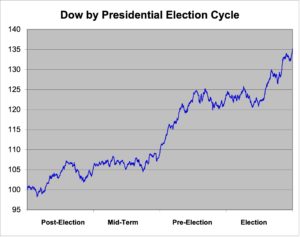
On August 4 of the post-election year, the Dow has historically peaked. This mini-bear market lasts until September 30 of the mid-term year.
Over that time, the market loses about 2.58%. That may not seem like a lot—and it’s not—but for a 14-month segment in a 125-year data series, it stands out.
For the other 34 months, the Dow has had an average gain of 38.73%. There’s another slow period from the middle of the pre-election year to the middle of the election year.
I don’t put faith in these types of stats. I think they’re interesting in a general sense. I would never make a market decision based on this.
Still, it’s interesting that incumbent presidents probably have had an effect on the stock markets. They work to make the economy peak by election day. The rally lasts for a few months before it stalls out. The market eventually bottoms around the mid-term elections.
-
Dow -700 on Covid Fears
Posted by Eddy Elfenbein on July 19th, 2021 at 10:26 amCovid is scaring the stock market once again. The Dow is currently down over 700 points. At its low, the S&P 500 was down 1.84%. This could be the worst day for market in two months. Some of the airlines are down over 5%.
Also this morning, we learned that homebuilder confidence is still high, but it’s down a bit.
A monthly sentiment index from the National Association of Home Builders dropped 1 point to 80 in July. The index stood at 72 in July 2020. Anything above 50 is considered positive. The index hit a record high of 90 in November of last year.
“Builders continue to grapple with elevated building material prices and supply shortages, particularly the price of oriented strand board, which has skyrocketed more than 500% above its January 2020 level,” said NAHB Chairman Chuck Fowke, a homebuilder from Tampa, Florida.
Robinhood is looking to sell 55 million shares between $38 and $42 per share. The ticker symbol is HOOD. It will probably go public towards the end of next week.
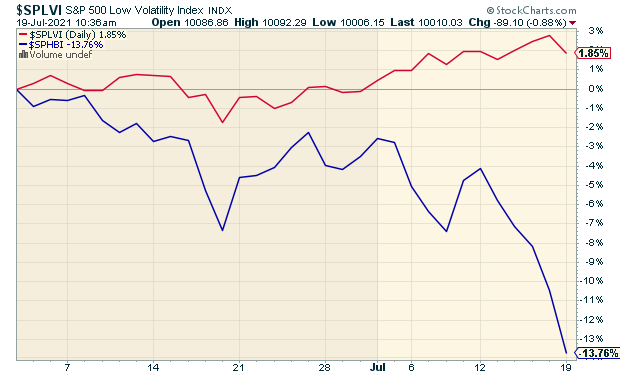
Here’s a look at the growing gap between High Beta and Low Vol stocks.
-
Morning News: July 19, 2021
Posted by Eddy Elfenbein on July 19th, 2021 at 7:10 amAs Lebanon Collapses, the Man With an Iron Grip on Its Finances Faces Questions
OPEC Plus Agrees on Oil Production Increase, Easing Pressure on Supplies and Prices
Record Steel Prices Inject Life Into Long-Suffering Industry
The Pandemic Safety Net Is Coming Apart. Now What?
Yellen Expresses Doubts on Results of Trump’s China Deal
What China Expects From Businesses: Total Surrender
China Frictions Steer Electric Automakers Away From Rare Earth Magnets
The Failure of China’s Microchip Giant Tests Beijing’s Tech Ambitions
Biden’s Antitrust Initiative Threatens a Big Railroad Takeover
Bill Ackman Rejigs Universal Deal After Regulators Probe SPAC Plan
Robinhood Seeks Up to $35 Billion Valuation in Mega U.S. IPO
Bored Ex-Lehman Trader Builds a $6.7 Billion Fortune With a Hot App
Tesla Unveils $199-A-Month Full Self-Driving Subscription Plan — But There’s A Catch
Malaysian Police Destroy 1,069 Bitcoin Mining Rigs With Steamroller
J&J Exploring Putting Talc Liabilities Into Bankruptcy
Americans Sentenced to Prison for Helping Carlos Ghosn Flee Japan
Be sure to follow me on Twitter.
-
Retail Sales Unexpectedly Increased in June
Posted by Eddy Elfenbein on July 16th, 2021 at 12:56 pmThe stock market is down again today. This could be our third loss in the last four days. The S&P 500 is on pace for its first back-to-back losses since June 17-18. The S&P 500 is trading 2.6% above its 50-day moving average, but 252 stocks in the index are trading below their 50-DMA.
This morning’s retail sales report showed an unexpected increase for June of 0.6%.
Receipts at auto dealerships fell 2.0% after declining 4.6% in May. Sales at clothing stores increased 2.6%. Consumers increased spending at restaurants and bars, leading to a 2.3% rise in receipts. Sales at restaurants and bars increased 40.2% compared to June 2020.
Receipts at electronics and appliance stores rose 3.3%; sales at furniture stores fell 3.6%. Sales at sporting goods, hobby, musical instrument and book stores dropped 1.7%. Receipts at food and beverage stores gained 0.6%. Sales at building material stores fell 1.6%.
Online retail sales rose 1.2%, likely lifted by Amazon’s Prime Day, which was emulated by other retailers.
Excluding automobiles, gasoline, building materials and food services, retail sales increased 1.1% last month after a downwardly revised 1.4% decrease in May. These so-called core retail sales correspond most closely with the consumer spending component of gross domestic product. They were previously estimated to have dropped 0.7% in May.
Here’s a great stat from Ryan Detrick. In May, lumber was up more than 130% YTD. It’s now down 20%.
Check out the growing gap between High Beta and Low Vol. The S&P 500 High Beta Index is in red and Low Vol in blue.

-
Morning News: July 16, 2021
Posted by Eddy Elfenbein on July 16th, 2021 at 7:01 amJapan Beefs Up Diplomatic Efforts on Regulating Digital Currency
ECB Policymakers Set for Showdown on Policy Path
U.S. Warns Investors on Hong Kong, Citing China’s Pressure
China Opened a National Carbon Market. Here’s Why it Matters.
Building Solar Farms May Not Build the Middle Class
More OPEC+ Crude is Needed, How Much Depends on Who You Believe
U.S. Jobless Claims, Benefits Payments Fall to Pandemic Lows
Yellen Sees ‘Several More Months of Rapid inflation’ Before Easing, Worries About Housing Impact
Biden to Reappoint Jerome Powell as Fed Chair, Say Economists
Jack Dorsey’s Square Is Building A Bitcoin-Inspired Financial Services Business
‘The Market Is Insane’: Cars Are Sold Even Before They Hit the Lot
Xiaomi Overtakes Apple as World’s No. 2 Phone Maker
Intel Is in Talks to Buy GlobalFoundries for About $30 Billion
‘Shuttle Diplomacy Gone Bad’: How Japan’s Investing Star Became Embroiled in Toshiba Board Dispute
Rolling Stone Names Top Daily Beast Staffer as New Editor-in-Chief
Be sure to follow me on Twitter.
-
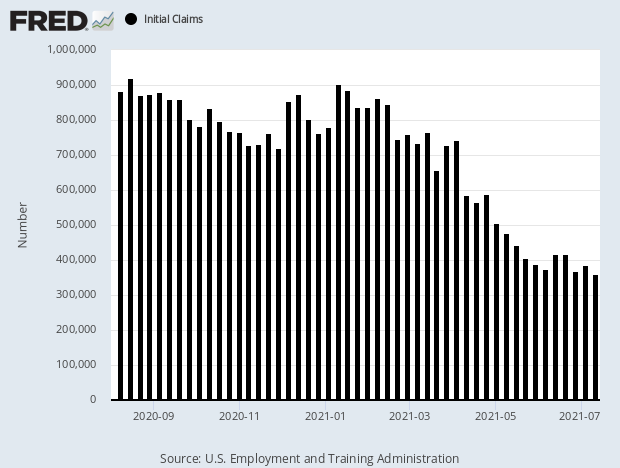
Jobless Claims Fall to 360,000
Posted by Eddy Elfenbein on July 15th, 2021 at 10:18 amThe stock market is down so far in early trading. We gapped up early yesterday and gradually drifted lower as the day wore on. By the closing bell, we had a slight gain.
This morning’s jobless claims reported came in at 360,000. That’s the lowest since March 2020.
Jay Powell is testifying again today. Yesterday was the House’s turn. Today, it’s the Senate.
A number of years ago, I trekked down to Capitol Hill to watch the semi-annual testimony. The prepared remarks are interesting. The rest of the time is grandstanding by members of Congress. I got the seat right behind Bernanke. Sorry for the blurry picture, but that’s how you know I really took it.

-
Morning News: July 15, 2021
Posted by Eddy Elfenbein on July 15th, 2021 at 7:07 amChina’s Economy Is Still Growing. But the Recovery Is Slowing Down
Inflation? Not in Japan. And That Could Hold a Warning for the U.S.
Wall Street Has Surrendered to the $500 Billion ETF Rush
The ECB Starts Work on Creating a Digital Version of the Euro
Why Wall Street Is Afraid of a Digital Dollar
Hong Kong Arrests Four in Alleged $155 Million Crypto Scheme
JPMorgan Hoards Cash as Dimon Expects Rates to Rise
How CEOs Think the Covid Crisis Will Shape Flying
Twitter’s Disappearing Snapchat Clone…Disappears
Startup Revolut Hits $33 Billion Valuation
TSMC Eyes Expansion in U.S., Japan to Meet Sustained Chip Demand
Mastercard Has Been Banned From Issuing New Cards in India
What Happens When a Private Club Goes Public?
The Unlikely Road to Riches for Russia’s Newest Billionaire
Be sure to follow me on Twitter.
-
Archives
- June 2026
- May 2026
- April 2026
- March 2026
- February 2026
- January 2026
- December 2025
- November 2025
- October 2025
- September 2025
- August 2025
- July 2025
- June 2025
- May 2025
- April 2025
- March 2025
- February 2025
- January 2025
- December 2024
- November 2024
- October 2024
- September 2024
- August 2024
- July 2024
- June 2024
- May 2024
- April 2024
- March 2024
- February 2024
- January 2024
- December 2023
- November 2023
- October 2023
- September 2023
- August 2023
- July 2023
- June 2023
- May 2023
- April 2023
- March 2023
- February 2023
- January 2023
- December 2022
- November 2022
- October 2022
- September 2022
- August 2022
- July 2022
- June 2022
- May 2022
- April 2022
- March 2022
- February 2022
- January 2022
- December 2021
- November 2021
- October 2021
- September 2021
- August 2021
- July 2021
- June 2021
- May 2021
- April 2021
- March 2021
- February 2021
- January 2021
- December 2020
- November 2020
- October 2020
- September 2020
- August 2020
- July 2020
- June 2020
- May 2020
- April 2020
- March 2020
- February 2020
- January 2020
- December 2019
- November 2019
- October 2019
- September 2019
- August 2019
- July 2019
- June 2019
- May 2019
- April 2019
- March 2019
- February 2019
- January 2019
- December 2018
- November 2018
- October 2018
- September 2018
- August 2018
- July 2018
- June 2018
- May 2018
- April 2018
- March 2018
- February 2018
- January 2018
- December 2017
- November 2017
- October 2017
- September 2017
- August 2017
- July 2017
- June 2017
- May 2017
- April 2017
- March 2017
- February 2017
- January 2017
- December 2016
- November 2016
- October 2016
- September 2016
- August 2016
- July 2016
- June 2016
- May 2016
- April 2016
- March 2016
- February 2016
- January 2016
- December 2015
- November 2015
- October 2015
- September 2015
- August 2015
- July 2015
- June 2015
- May 2015
- April 2015
- March 2015
- February 2015
- January 2015
- December 2014
- November 2014
- October 2014
- September 2014
- August 2014
- July 2014
- June 2014
- May 2014
- April 2014
- March 2014
- February 2014
- January 2014
- December 2013
- November 2013
- October 2013
- September 2013
- August 2013
- July 2013
- June 2013
- May 2013
- April 2013
- March 2013
- February 2013
- January 2013
- December 2012
- November 2012
- October 2012
- September 2012
- August 2012
- July 2012
- June 2012
- May 2012
- April 2012
- March 2012
- February 2012
- January 2012
- December 2011
- November 2011
- October 2011
- September 2011
- August 2011
- July 2011
- June 2011
- May 2011
- April 2011
- March 2011
- February 2011
- January 2011
- December 2010
- November 2010
- October 2010
- September 2010
- August 2010
- July 2010
- June 2010
- May 2010
- April 2010
- March 2010
- February 2010
- January 2010
- December 2009
- November 2009
- October 2009
- September 2009
- August 2009
- July 2009
- June 2009
- May 2009
- April 2009
- March 2009
- February 2009
- January 2009
- December 2008
- November 2008
- October 2008
- September 2008
- August 2008
- July 2008
- June 2008
- May 2008
- April 2008
- March 2008
- February 2008
- January 2008
- December 2007
- November 2007
- October 2007
- September 2007
- August 2007
- July 2007
- June 2007
- May 2007
- April 2007
- March 2007
- February 2007
- January 2007
- December 2006
- November 2006
- October 2006
- September 2006
- August 2006
- July 2006
- June 2006
- May 2006
- April 2006
- March 2006
- February 2006
- January 2006
- December 2005
- November 2005
- October 2005
- September 2005
- August 2005
- July 2005
 Eddy Elfenbein is a Washington, DC-based speaker, portfolio manager and editor of the blog Crossing Wall Street. His