-
Morning News: April 16, 2018
Posted by Eddy Elfenbein on April 16th, 2018 at 7:11 amWall Street Economists See Global Growth Cresting Not Collapsing
Oil Prices Drop as Fears About Syria Strikes Fallout Wane
If Fed Moves Unlock Billions at Banks, Here’s Who Might Win Most
Silicon Valley Venture Capitalists Prepare for an I.P.O. Wave
Wall Street Titan Takes Aim at Law That Tripped Him Up
Adecco Buys General Assembly in $412.5 Million Deal to Boost Growth
WPP CEO Departure May Herald Empire Breakup, Strategy Shift
Pentagon Cited Boeing Over Quality Concerns Going Back Years
Shire to Sell Oncology Unit for $2.4 Billion as Takeda Mulls Takeover
Ola Wants a Million Electric Rides on India’s Roads by 2021
How Tesla’s Elon Musk Makes a Strategy Out of Defiance
Elliott Stake Adds to Pressure for Whitbread Split, Analysts Say
Howard Lindzon: Reminders …The Markets and Your Data Never Sleep
Ben Carlson: 3 Ways to Make Up For a Retirement Savings Shortfall
Lawrence Hamtil: Factor Performance and Drawdown Duration in the U.S., Europe, and Japan
Be sure to follow me on Twitter.
-
CWS Market Review – April 13, 2018
Posted by Eddy Elfenbein on April 13th, 2018 at 7:08 am“Beware geeks bearing formulas.” – Warren Buffett
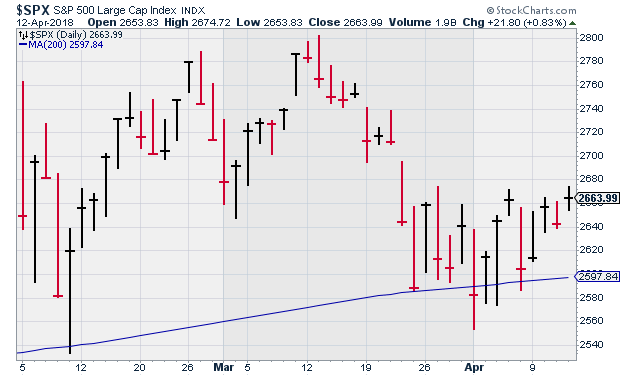
The Monday before last, the S&P 500 closed below its 200-day moving average. This was a big deal because it hadn’t happened in 21 months. Back then, the index had previously closed below its 200-DMA for a grand total of one day. This was during the freak-out following the Brexit vote.
Are we repeating ourselves? Since Monday, April 2, we’ve had a nice little rebound, but I’m skeptical that it can last much longer. Over the last three weeks, the S&P 500 has been locked in a trading range that’s about 3% wide. While daily volatility has increased, the market seems unable to get any real momentum either up or down.
Some of this seems to be driven by our on-again off-again trade war. Here’s something to think on. Earlier this week, our stock market rallied thanks to encouraging free trade talk from Chinese President Xi Jinping. It’s not every day that a Communist pseudo-dictator helps the U.S. stock market with his free-trade rhetoric. But here we are.
More importantly for us, Q1 earnings season is here. The guessing game about corporate profits is over, and we’ll soon see results. Over the next three weeks, 20 of our 25 Buy List stocks will report earnings. On balance, this should be a very good earnings season for Wall Street (thank you, tax reform) and an especially good one for us. I’ll preview some of our reports that will arrive next week. Before we get to that, though, let’s take a look at the minutes from the Fed’s last meeting.
The Fed Is More Optimistic about the Economy
Yes, yes, I know—the Fed minutes are dull as dirt. And sure, the economists speak in dry econo-jargo-babble. Fortunately for us, I’m well versed in their dark and mysterious tongue, and I’m happy to translate.
On Wednesday, the Fed released the minutes from its March 20-21 meeting. This is when the Fed decided to raise interest rates. What’s interesting about these minutes is that they show how much more optimistic the Fed is about the economy, especially compared with a few months ago. Economists, it seems, can be as fickle as investors.
I should explain that the Fed minutes are a study in indefinite pronouns. The minutes aren’t complete transcripts. Instead, we read that “some members” said this while “a few members” said that. It usually takes a little decoding, but I was surprised when “all” was used a few times. For example, “all” members expect inflation to rise in the coming months. Also, “all” members agreed that the economy has gotten better in recent months.
That’s good to see, and looking at the recent data, I have to agree. Last Friday, the government said the economy created 103,000 net new jobs in March. That’s low, but the trend is still good. In fact, we haven’t had a negative month for NFP in nearly eight years.
The unemployment rate came in at 4.1% for the sixth month in a row. That ties us for a 17-year low. One weak spot is wages. The government said that average hourly earnings are up 2.7% in the last year. That’s not bad, but it should be better.
The good news is that inflation continues to be subdued. This week we learned that headline consumer prices fell 0.06% last month. That was the first monthly drop in 10 months. Some of the drop was caused by lower energy prices. Gasoline prices were down nearly 5% in March.
The “core rate,” which excludes food and energy prices, rose by 0.18% last month. In the last year, core inflation is running at 2.1%. That’s higher than it’s been in a few months. Still, core inflation hasn’t strayed far from 2% for more than seven years.
Some of the Fed’s recent optimism is due to tax reform. However, the central bank is concerned about the prospects of a trade war. (Or so said “a strong majority,” which may be a new one.)
How does this affect us? In the near term, not much. Don’t expect a Fed rate hike at the next Fed meeting in early May. But we’ll surely get one at the June meeting. Even after that, real interest rates will still be negative. Despite the higher volatility, this is still a good time to be an investor.
The Fed is a long way from damaging the market or the economy, but investors must be careful. Don’t chase stocks. Don’t sell on every wobble. Stay focused on the long term, and stick with fundamentally-superior stocks. Now, let’s take a look at earnings season.
Q1 Buy List Earnings Calendar
Here’s a calendar of our Buy List earnings reports for this quarter. I’ve included each stock’s reporting date (there are a few we don’t know yet), ticker and Wall Street’s consensus estimate.
Company Ticker Date Estimate Torchmark TMK 18-Apr $1.45 Alliance Data Systems ADS 19-Apr $4.51 Danaher DHR 19-Apr $0.94 Snap-On SNA 19-Apr $2.73 Sherwin-Williams SHW 24-Apr $3.15 AFLAC AFL 25-Apr $0.97 Check Point Software CHKP 25-Apr $1.28 Stryker SYK 26-Apr $1.60 Moody’s MCO 27-Apr $1.71 Fiserv FISV 1-May $0.73 Becton, Dickinson BDX 3-May $2.62 Church & Dwight CHD 3-May $0.61 Ingredion INGR 3-May $1.89 Intercontinental Exchange ICE 3-May $0.87 Signature Bank SBNY TBA $2.67 Cerner CERN TBA $0.58 Cognizant Technology Solutions CTSH TBA $1.06 Carriage Services CSV TBA $0.58 Wabtec WAB TBA $0.90 Continental Building Products CBPX TBA $0.36 There are four reports scheduled for next week. On Wednesday, April 18, Torchmark (TMK) will kick things off for us. This insurance firm doesn’t generate a lot of news, which is how I like it. For Q4, they beat the Street by a penny per share. For 2017, Torchmark made $4.82 per share. That was up from $4.49 per share in 2016. Their ROE was 28.2%, which is quite good.
Wall Street expects earnings of $1.45 for Q1. That sounds about right. For all of 2018, Wall Street is looking for $6.03 per share. That’s probably a tad too low. Still, even if it’s right, that means TMK is going for 14 times earnings. That’s a good price. This is a very solid company.
On Thursday, April 19, three of our Buy List stocks are scheduled to report. I’m most curious about Alliance Data Systems (ADS). The loyalty-rewards stock has gotten slapped around badly this year. ADS dropped from a high of $278 in January down to $203 last week. Some investors think the company is about to slash its earnings forecast.
Investors were also concerned that Facebook’s limiting of the information it shares with data brokers could hurt ADS. For its part, ADS said it doesn’t have a close relationship with any social-media platform. It also reiterated its full-year guidance of $22.50 to $23 per share. For Q1, the consensus on Wall Street is for earnings of $4.51 per share.
Also on Thursday, Danaher (DHR) is due to report. Three months ago, the company said that Q1 earnings would range between 90 and 93 cents per share. Then in March, the CEO said they’ll beat that.
“We have seen a strong start to 2018 from both a core-revenue and margin perspective, and based on our results through February, we now expect first-quarter-2018 adjusted EPS to be above the high end of our previously communicated guidance range. Better than expected results in our Life Sciences and Diagnostics platforms – specifically at Cepheid – are the main drivers for this performance as we continue to see positive momentum in these businesses.”
For all of 2018, Danaher sees earnings of $4.25 to $4.35 per share. I had been expecting a little more, but I’m not worried. DHR made $4.03 per share in 2017. DHR is a keeper.
While ADS is our biggest loser YTD, Snap-on (SNA) is a close second. For Q4, SNA had earnings of $2.69 per share which was three cents above Wall Street’s consensus. For the year, the company made $10.12 per share.
Forbes recently had a good article explaining why Snap-on’s stock was a bargain. You can see the whole thing here. I’ll highlight two important facts. One is Snap-on’s improving margins. The article also notes that the concerns about Snap-on’s financing business are overblown. Wall Street expects Q1 earnings of $2.73 per share.
I also want to add Signature Bank (SBNY). Technically, the bank hasn’t said yet when they’ll report Q1 earnings, but I suspect it will be on April 19.
What I like about Signature is that their business has been improving, and I don’t believe that’s been fully reflected by the share price. For Q4, they beat the Street by 20 cents per share. The bank made $8.91 per share for 2017, and I think they have a good shot of breaking $11 per share this year. The stock is probably going for less than 12 times this year’s earnings. For Q1, Wall Street expects earnings of $2.67 per share.
When looking at banks, there’s a key metric to watch: the “efficiency ratio.” It’s a bank’s overhead as a percent of revenue. The lower this number, the better. Signature defines its efficiency ratio as net interest expense divided by total income. As a general rule, anything below 50% is considered good. For Signature, the efficiency ratio was 33.5% last quarter.
That’s all for now. Next week will be dominated by earnings news, but there will be a few key economic reports to look for. On Monday, we’ll get the retail-sales report for March. The last three reports have all showed declines. Then on Tuesday, we’ll get the industrial-production report for March. On Wednesday, the Fed will release its latest Beige Book report. Be sure to keep checking the blog for daily updates. I’ll have more market analysis for you in the next issue of CWS Market Review!
– Eddy
Syndication Partners
I’ve teamed up with Investors Alley to feature some of their content. I think they have really good stuff. Check it out!
How to Profit from Solving the World’s Water Shortage
Water is seemingly everywhere, covering about 70% of our planet. Yet, fresh water is extremely scarce – accounting for a mere 3% of the world’s supply. Of that amount, the vast majority is either locked up in glaciers or reside in inaccessible subterranean pockets.
And the fresh water that is accessible is not evenly distributed around the planet. For example, there is plenty of water in Siberia. But few people live there.
Of the amount of fresh water that is available, roughly 70% of that goes to agriculture to feed the world’s population. The enormous amount of water needed to grow the crops and livestock needed to feed and clothe the world’s growing population is creating a dire global situation.
The U.S. media tends to ignore events in the rest of the world, but there is a scary situation developing in South Africa’s second-largest city, Cape Town, with its four million residents.
Cape Town is best known as a tourist haven and the center of South Africa’s wine industry. But now population growth and a record drought in the region have combined to push the city to the brink – to being very close to ‘Day Zero’ when its water reservoirs run dry.
3 REITs Raising Dividends in May
For income stock investors, the best defense against interest rate increases from the Fed is to own shares in companies that periodically increase their dividend rates. It is a widely held yet inaccurate belief that REIT values must fall if interest rates continue to increase. REITs are active businesses in which the good ones are managed to grow income and the dividends paid to investors through the full cycle of interest rate changes. Buying stocks just before they announce a dividend increase provides an attractive opportunity for quick share price gains along with larger forward dividend payments.
In the market sector of real estate investment trusts (REITs) we can monitor how well an individual REIT is performing from its history of dividend growth. In the long-term, REIT results are primarily driven by economic growth. In the U.S. the growth rate continues to expand. Another positive for REITs is that they are not exposed to the challenges of international trade.
Most REITs announce a dividend increases once a year, in the same month each year. Across the sector there are increase announcements in almost every month in the calendar. You can often get a nice share price gain by buying shares before a dividend increase announcement hits the news wires. I maintain a database that covers about 140 REITs. I use the database to track dividend rates, yields and increases. Of the 140, about 90 have histories of regular dividend increases. There are three REITs that are likely to announce a dividend increase in May.
Morning News: April 13, 2018
Posted by Eddy Elfenbein on April 13th, 2018 at 7:05 amS&P Raises Japan’s Outlook to Positive on Stronger Growth
Trade Tensions Have Hit Stocks Hard—Why Is the Rest of the Market So Calm?
Trump Wants Back Into the TPP. Not So Fast, Say Members.
Facebook’s Zukerberg Quietly Drops Another Privacy Bomb – Facial Recognition
Trump, Having Denounced Amazon’s Shipping Service, Orders Review of the Postal Service
The Aramco Accounts: Inside the World’s Most Profitable Company
VW Chief Pledges Faster Streamlining to Speed Decisions
Tesla May Be the Most Hated (and Loved) Stock in America
General Electric: The Recent Report (Rumor) Was Music To My Ears
Zillow Intends to Buy and Flip Homes
Airbus Set to Win China Approval for Delayed A320 Neo Deliveries
Joshua Brown: The Forward P/E Ratio Has Collapsed
Michael Batnick: Here We Go Again?
Blue Harbinger: How Do You Allocate Your Trade Risk Budget?
Be sure to follow me on Twitter.
Morning News: April 12, 2018
Posted by Eddy Elfenbein on April 12th, 2018 at 7:05 amA Massive, ‘Semi-Infinite’ Trove of Rare-Earth Metals Has Been Found in Japan
Zuckerberg Faces Hostile Congress as Calls for Regulation Mount
WeWork Is Diving Headfirst Into China With a Big New Buy
Disney Forced Into Takeover Offer for Sky by U.K. Authority
Walmart Close to Buying Majority of India’s Flipkart
Toys ‘R’ Us Receives Bids of Over $1 Billion for Asian Business
Takeda Sounds Out Banks for Loans as it Moves Towards Shire Bid
Airlines Know You Hate the Airport, and Are Trying to Do Something About It
Airbus to Place Beds in Cargo Holds for Passengers on Long Flights
British Airways Owner IAG Weighs Takeover Bid for Norwegian Air
JPMorgan Sued Over Cash Advance Fees for Cryptocurrency Purchases
Breaking Into the Boom In Escape Rooms: What Entrepreneurs Need to Know
Cullen Roche: Why Does the Rebalancing Bonus Work?
Ben Carlson: The False Breakdown
Howard Lindzon: Gold and Dapps
Be sure to follow me on Twitter.
Fed’s Minutes
Posted by Eddy Elfenbein on April 11th, 2018 at 3:33 pmThe Fed released the minutes from their March 20-21 meeting. Here are some key bits.
The information reviewed for the March 20-21 meeting indicated that labor market conditions continued to strengthen through February and suggested that real gross domestic product (GDP) was rising at a moderate pace in the first quarter. Consumer price inflation, as measured by the 12‑month percentage change in the price index for personal consumption expenditures (PCE), remained below 2 percent in January. Survey‑based measures of longer-run inflation expectations were little changed on balance.
Gains in total nonfarm payroll employment were strong over the two months ending in February. The labor force participation rate held steady in January and then stepped up markedly in February, with the participation rates for prime-age (defined as ages 25 to 54) women and men moving up on net. The national unemployment rate remained at 4.1 percent. Similarly, the unemployment rates for African Americans, Asians, and Hispanics were roughly flat, on balance, in recent months. The share of workers employed part time for economic reasons edged up but remained close to its pre-recession levels. The rates of private-sector job openings and quits increased slightly, on net, over the two months ending in January, and the four-week moving average of initial claims for unemployment insurance benefits continued to be low in early March. Recent readings showed that increases in labor compensation remained modest. Compensation per hour in the nonfarm business sector advanced 2-3/4 percent over the four quarters of last year, and average hourly earnings for all employees rose 2-1/2 percent over the 12 months ending in February.
Total industrial production expanded, on net, in January and February, with gains in both manufacturing and mining. Automakers’ schedules indicated that assemblies of light motor vehicles would likely edge down in coming months. However, broader indicators of manufacturing production, such as the new orders indexes from national and regional manufacturing surveys, pointed to further solid increases in factory output in the near term.
Consumer expenditures appeared likely to rise at a modest pace in the first quarter following a strong gain in the preceding quarter. Real PCE edged down in January, and the components of the nominal retail sales data used by the Bureau of Economic Analysis to construct its estimate of PCE rose somewhat in February while the pace of light motor vehicle sales declined slightly. However, household spending was probably held back somewhat in February because of a delay in many federal tax refunds, and the subsequent delivery of those refunds would likely contribute to an increase in consumer spending in March. Moreover, the lower tax withholding resulting from the tax cuts enacted late last year, which was beginning to show through in consumers’ paychecks, would likely provide some impetus to spending in coming months. More broadly, recent readings on key factors that influence consumer spending–including gains in employment and real disposable personal income, along with households’ elevated net worth–continued to be supportive of solid real PCE growth in the near term. In addition, consumer sentiment in early March, as measured by the University of Michigan Surveys of Consumers, was at its highest level since 2004.
Real residential investment looked to be slowing in the first quarter after rising briskly in the fourth quarter. Starts of new single-family homes increased in January and February, although building permit issuance moved down somewhat. Starts of multifamily units jumped in January but fell back in February. Sales of both new and existing homes declined in January.
Growth in real private expenditures for business equipment and intellectual property appeared to be moderating in the first quarter after increasing at a solid pace in the preceding quarter. Nominal shipments of nondefense capital goods excluding aircraft edged down in January. However, recent forward-looking indicators of business equipment spending–such as the backlog of unfilled capital goods orders, along with upbeat readings on business sentiment from national and regional surveys–pointed to further solid gains in equipment spending in the near term. Firms’ nominal spending for nonresidential structures outside of the drilling and mining sector declined in January. In contrast, the number of crude oil and natural gas rigs in operation–an indicator of business spending for structures in the drilling and mining sector–continued to move up through mid-March.
Total real government purchases seemed to be flattening out, on balance, in the first quarter after rising solidly in the fourth quarter. Nominal defense spending in January and February was consistent with a decline in real federal purchases. In contrast, real purchases by state and local governments looked to be rising, as the payrolls of these governments increased in January and February and nominal state and local construction spending advanced somewhat in January.
The change in net exports was a significant drag on real GDP growth in the fourth quarter of 2017, as imports grew rapidly. The nominal U.S. international trade deficit widened in January; exports declined, led by lower exports of capital goods and industrial supplies, while imports were about flat. The slowing of real import growth following the rapid increase in the fourth quarter suggested that the drag on real GDP growth from net exports would lessen in the first quarter.
Total U.S. consumer prices, as measured by the PCE price index, increased 1-3/4 percent over the 12 months ending in January. Core PCE price inflation, which excludes changes in consumer food and energy prices, was 1-1/2 percent over that same period. The consumer price index (CPI) rose 2-1/4 percent over the 12 months ending in February, while core CPI inflation was 1-3/4 percent. Recent readings on survey-based measures of longer-run inflation expectations–including those from the Michigan survey, the Survey of Professional Forecasters, and the Desk’s Survey of Primary Dealers and Survey of Market Participants–were little changed on balance.
Foreign economic activity expanded at a moderate pace in the fourth quarter. Real GDP growth picked up in Mexico but slowed a bit in some advanced foreign economies (AFEs) and in emerging Asia. Recent indicators pointed to solid economic growth abroad in the first quarter of this year. Inflation abroad continued to be boosted by the pass-through to consumer prices of past increases in oil prices. However, excluding food and energy prices, inflation remained subdued in many foreign economies, including the euro area and Japan.
CPI Fell 0.1% in March
Posted by Eddy Elfenbein on April 11th, 2018 at 11:34 amFor the first time in 10 months, consumer prices fell in March. The CPI showed a drop of 0.1%, but that was driven by lower gas prices.
That core rate, which excludes food and energy, rose 0.2% which is basically inline with the previous trend.
Here’s the headline rate:
In the last 12 months, headline inflation is up 2.36%.
Here’s a look at the core rate:
Core inflation over the last year was 2.11%.
Morning News: April 11, 2018
Posted by Eddy Elfenbein on April 11th, 2018 at 7:02 amTrade Threats Cloud Bright World Growth Outlook, Lagarde Says
China Will Do What’s Best for China: Not Shooting Markets
Upcoming Earnings Could Pour ‘Fuel on Fire’ for Stocks
Six Takeaways From Zuckerberg’s Time in the Senate Spotlight
Day 2 of Mark Zuckerberg’s Testimony: What to Watch For
FTC Confirms What We Suspected All Along: Those ‘Warranty Void If Removed’ Stickers Are No Good
Farmers Hit the Road to Reach Shoppers Before Amazon Does
Bank of America to Stop Financing Makers of Military-Style Guns
Boeing Reels in a Huge Order From American Airlines Group, Inc.
It Built an Empire of GIFs, Buzzy News and Jokes. China Isn’t Amused.
Theranos Lays Off Most of Its Remaining Workforce
No One Likes Necco Wafers, but People Are Hoarding Them Anyway
Lawrence Hamtil: Equal-Weighting the S&P 500 vs the S&P 400
Roger Nusbaum: Tariffs Throw A Cat Amongst The Pigeons
Joshua Brown: Managing Risk is Not the Same as Taking Less Risk
Be sure to follow me on Twitter.
Morning News: April 10, 2018
Posted by Eddy Elfenbein on April 10th, 2018 at 7:07 amRussian Markets Reel After U.S. Imposes New Sanctions
‘No Direct Confrontation’: Investors Voice Relief at Xi’s Speech
U.S.-China Talks Broke Down Over Trump’s Demands on High-Tech Industries
Payday Lenders Sue CFPB as Hopes for Quick Regulatory Fix Fade
The $66 Billion Bayer-Monsanto Merger Just Got a Major Green Light — But Farmers are Terrified
Mark Zuckerberg Meets With Top Lawmakers Before Hearings
Uber Acquires Bike Share Startup JUMP
Uber Loses EU Court Case in Fight Against French Criminal Charges
Alexa P2P Could Be Amazon’s Gateway to Payments
You Won’t Have to Sign for Credit Card Purchases Much Longer
Novartis Wager on AveXis Shows Rare Diseases Command Mega Prices
Ant Financial Plans $9 Billion Round of Fresh Financing
Nick Maggiulli: The Echo Chamber
Cullen Roche: Why Bitcoin Will Never Be the Dominant Form of Money
Be sure to follow me on Twitter.
The Rise in Volatility
Posted by Eddy Elfenbein on April 9th, 2018 at 7:25 pmIt’s hard to convey the dramatic rise in the stock market’s volatility in a graph. I think this one does a good job. It’s the daily changes of the S&P 500 from mid-September until today.
In the first two-thirds of the graph, the stock market rarely went down, and rarely rose by more than 1%. Since then, it’s gotten much more interesting. We’ve already had six 2% down days this year.
In today’s session, the Dow rose as much as 440 points. I was skeptical. I didn’t see the need for a big rise after an ugly day on Friday. At 12:27, I tweeted:
Today's rally is a lot weaker than it appears.
— Eddy Elfenbein (@EddyElfenbein) April 9, 2018
As it turns out, I got close to the top. The markets soon reversed course.
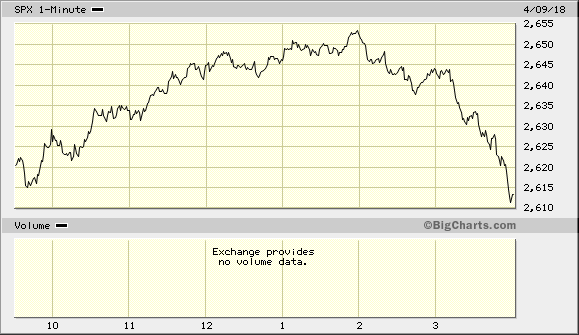
The S&P 500 closed higher by 0.33% today. While that’s not a big change for the day, we saw a lot of intraday movement. This is a very different market than the one we saw late last year.
Russian Stocks Plunge
Posted by Eddy Elfenbein on April 9th, 2018 at 10:25 amThe Russian stock market is plunging as the Trump administration announced new sanctions. Check out the price action in the Russian ETF (RSX).

From Bloomberg:
Russian stocks had their biggest drop in four years and the ruble slumped the most in the world after the U.S. slapped new sanctions on Kremlin-connected billionaires and tensions with the U.S. spiraled following the latest chemical attack in Syria.
The benchmark MOEX Russia Index sank 8.7 percent on Monday, the steepest slide since March 2014, when Moscow’s annexation of the Crimean peninsula triggered international penalties. The ruble and local bonds had their biggest drop since 2016 and the cost of insuring sovereign notes against default was set for the sharpest increase since December 2014.
Investors pulled out after the U.S. on Friday escalated penalties against Russia for meddling in the 2016 election by sanctioning dozens of Russian tycoons, companies and key allies of President Vladimir Putin. On top of that, U.S. President Donald Trump warned of a “big price to pay” in response to reports of a chemical attack outside Syria’s capital, saying President Vladimir Putin and Iran “are responsible for backing Animal Assad.”
“We haven’t seen such a united, mass retreat from Russian assets for a long time,” Kirill Tremasov, director of the analysis department at Loko-Invest said by phone. “The situation is ever more reminiscent of 2014.”
-
Archives
- July 2026
- June 2026
- May 2026
- April 2026
- March 2026
- February 2026
- January 2026
- December 2025
- November 2025
- October 2025
- September 2025
- August 2025
- July 2025
- June 2025
- May 2025
- April 2025
- March 2025
- February 2025
- January 2025
- December 2024
- November 2024
- October 2024
- September 2024
- August 2024
- July 2024
- June 2024
- May 2024
- April 2024
- March 2024
- February 2024
- January 2024
- December 2023
- November 2023
- October 2023
- September 2023
- August 2023
- July 2023
- June 2023
- May 2023
- April 2023
- March 2023
- February 2023
- January 2023
- December 2022
- November 2022
- October 2022
- September 2022
- August 2022
- July 2022
- June 2022
- May 2022
- April 2022
- March 2022
- February 2022
- January 2022
- December 2021
- November 2021
- October 2021
- September 2021
- August 2021
- July 2021
- June 2021
- May 2021
- April 2021
- March 2021
- February 2021
- January 2021
- December 2020
- November 2020
- October 2020
- September 2020
- August 2020
- July 2020
- June 2020
- May 2020
- April 2020
- March 2020
- February 2020
- January 2020
- December 2019
- November 2019
- October 2019
- September 2019
- August 2019
- July 2019
- June 2019
- May 2019
- April 2019
- March 2019
- February 2019
- January 2019
- December 2018
- November 2018
- October 2018
- September 2018
- August 2018
- July 2018
- June 2018
- May 2018
- April 2018
- March 2018
- February 2018
- January 2018
- December 2017
- November 2017
- October 2017
- September 2017
- August 2017
- July 2017
- June 2017
- May 2017
- April 2017
- March 2017
- February 2017
- January 2017
- December 2016
- November 2016
- October 2016
- September 2016
- August 2016
- July 2016
- June 2016
- May 2016
- April 2016
- March 2016
- February 2016
- January 2016
- December 2015
- November 2015
- October 2015
- September 2015
- August 2015
- July 2015
- June 2015
- May 2015
- April 2015
- March 2015
- February 2015
- January 2015
- December 2014
- November 2014
- October 2014
- September 2014
- August 2014
- July 2014
- June 2014
- May 2014
- April 2014
- March 2014
- February 2014
- January 2014
- December 2013
- November 2013
- October 2013
- September 2013
- August 2013
- July 2013
- June 2013
- May 2013
- April 2013
- March 2013
- February 2013
- January 2013
- December 2012
- November 2012
- October 2012
- September 2012
- August 2012
- July 2012
- June 2012
- May 2012
- April 2012
- March 2012
- February 2012
- January 2012
- December 2011
- November 2011
- October 2011
- September 2011
- August 2011
- July 2011
- June 2011
- May 2011
- April 2011
- March 2011
- February 2011
- January 2011
- December 2010
- November 2010
- October 2010
- September 2010
- August 2010
- July 2010
- June 2010
- May 2010
- April 2010
- March 2010
- February 2010
- January 2010
- December 2009
- November 2009
- October 2009
- September 2009
- August 2009
- July 2009
- June 2009
- May 2009
- April 2009
- March 2009
- February 2009
- January 2009
- December 2008
- November 2008
- October 2008
- September 2008
- August 2008
- July 2008
- June 2008
- May 2008
- April 2008
- March 2008
- February 2008
- January 2008
- December 2007
- November 2007
- October 2007
- September 2007
- August 2007
- July 2007
- June 2007
- May 2007
- April 2007
- March 2007
- February 2007
- January 2007
- December 2006
- November 2006
- October 2006
- September 2006
- August 2006
- July 2006
- June 2006
- May 2006
- April 2006
- March 2006
- February 2006
- January 2006
- December 2005
- November 2005
- October 2005
- September 2005
- August 2005
- July 2005
 Eddy Elfenbein is a Washington, DC-based speaker, portfolio manager and editor of the blog Crossing Wall Street. His