-
Morning News: April 22, 2013
Posted by Eddy Elfenbein on April 22nd, 2013 at 7:07 amItaly’s Deficit at EU Limit Last Year for First Time Since 2008
Europe’s Leaders Hear Call to Do More to Spur Growth
Spain Has EU’s Largest Deficit, Undermining Rajoy Pickup
U.S. Box Office Heroes Proving Mortal in China
Brent Makes Inroads Above $100 on Hopes of Improving Demand
LG Display’s Quarterly Profit Drops on Worries About Apple
ABB to Buy Power-One for $1 Billion
China Mobile First-Quarter Profit Little Changed on Costs
Slower Europe Hits Philips’ Growth
ANA, JAL Said Set to Start Battery Fixes of Grounded 787
Deutsche Bank Margin Call on Vik Turns Into $2.5 Billion Dispute
Restyled as Real Estate Trusts, Varied Businesses Avoid Taxes
Cullen Roche: Fading Magazine Covers…
Jeff Miller: Weighing the Week Ahead: Interpreting Mixed Signals
Be sure to follow me on Twitter.
-
The Original Simpsons Writers Reunite
Posted by Eddy Elfenbein on April 19th, 2013 at 10:21 pm -
Microsoft Breaks $30
Posted by Eddy Elfenbein on April 19th, 2013 at 12:01 pmThanks to yesterday’s good earnings report, shares of Microsoft ($MSFT) broke above $30 per share this morning. MSFT is currently at $29.74 per share which is a 3.3% gain for the day.
Today’s high is $30.24 (so far). Last week, MSFT got to $30.32 which is the highest price since late September.
-
CWS Market Review – April 19, 2013
Posted by Eddy Elfenbein on April 19th, 2013 at 8:08 am“Labour was the first price, the original purchase—money that was
paid for all things. It was not by gold or by silver, but by labour, that
all wealth of the world was originally purchased.” – Adam SmithThis was an ugly week for Wall Street. In the last four days, more than $1 trillion was erased from global stock markets. On Monday, the S&P 500 had its single-worst one-day loss in five months. Fortunately, we regained some lost ground on Tuesday, but Wednesday was the second-worst plunge in five months. Then on Thursday, the index closed below its 50-day moving average for the first time this year. That’s usually a bad omen for stocks.
The Worst Gold Plunge in 30 Years
But as rough as things were for stocks, gold’s been doing far worse. On last Friday and Monday, gold had its worst sell-off in three decades. In two days, the price for the yellow metal dropped more than 13% or $200 per ounce. Au was acting like Pb balloon.
What’s behind gold’s pain? That’s easy. Traders are worried that deflation is picking up and I think they’re right. This week’s CPI report showed that consumer inflation fell 0.2% in March. Leading the downward charge were energy costs; the price of gasoline fell 4.4% last month. Emerging deflation means that real interest rates are climbing and that’s bad news for commodities. All this worry about inflation has been hot air. Just look at the market. Inflation-averse investors like to buy TIPs; these are inflation-protected bonds, but this week’s TIPs auction had its worst bid-to-cover ratio in five years.
Retail sales got clipped earlier this year thanks to the end of the payroll tax holiday. That’s clearly holding some consumers back, but make no mistake, the larger story is falling commodity prices. While cyclical stocks have been trailing the market badly over the last month, I don’t believe that’s due to expected lower growth. This week’s report on industrial production was pretty good. Instead, I believe the market is taking on a more defensive posture. We heard a lot of talk about a Great Rotation out of bonds and into stocks. It appears that the rotation is simply out of commodities.
The S&P 500 hit a near-term peak in 2010 on April 23rd. In 2011, it came on April 29th, and last year, it came on April 2nd. I’m sensing a pattern here. In other words, spring sell-offs have been regular occurrences in the greatest bull market in decades.
In this week’s CWS Market Review, I want to focus on our upcoming earnings reports. Next week is going to be a busy week for our Buy List, with five earnings reports due. While Q1 earnings season is still young, the numbers for the overall market are promising. Of the 85 companies in the S&P 500, 75% have beaten earnings estimates and 51% have beaten sales estimates. Before we get to our upcoming reports, let’s look at some recent results from our Buy List starting with the strong earnings report from Microsoft.
Microsoft Is a Buy up to $32 per Share
After the closing bell on Thursday, Microsoft ($MSFT) reported quarterly earnings of 72 cents per share which was four cents better than Wall Street’s estimate. For the same quarter one year ago, the company made 60 cents per share. I’ve been bewildered by the slew of negative comments about Microsoft. Just a few days ago, Goldman lowered MSFT to “Sell.” Yes, the company does have problems, but don’t let that fool you. The overall firm is very profitable.
For the first three months of the year, MSFT’s fiscal third quarter, their net profits grew 19% to $6.06 billion. While the company is feeling the squeeze from struggling PC sales and weak reception for Windows 8, Microsoft is doing well with its corporate software and Xbox biz. They’ve also done a commendable job of keeping their costs in check. In fact, cost control was probably the main driver of the earnings beat. Looking at the top line, revenue rose 18% to $20.5 billion which matched what the Street was expecting.
It’s true that Bing is spewing red ink but let’s add some context. Last quarter, Microsoft’s online division lost $282 million, but the entire company made a profit of more than 20 times that. For now, I’m raising my Buy Below to $32 per share. Microsoft continues to be a solid bargain. The shares currently yield 3.2% and I think we’re going to see a nice dividend increase this September.
Big Earnings from our Big Bank Stocks
Just after I sent last week’s CWS Market Review, our two big banks reported earnings. For the first quarter, JPMorgan Chase ($JPM) earned $1.59 per share which was 20 cents better than estimates. Net profits rose 33% to $6.53 billion. Revenues, however, were “only” $25.8 billion which was $100 million below estimates. The earnings benefited by $1.15 billion thanks to lower loss provisions.
Bloomberg quoted analyst Charles Peabody as saying the reserve releases plus a tax-benefit and a one-time accounting adjustment helped JPM’s bottom line by 26 cents per share. Without those, the bank would have missed earnings. While the mortgage business is soaring, the profits from mortgages aren’t because rates are so low. Thanks to the negative reaction from some traders, the shares pulled back below $47. I’m not worried about JPM at all. The bank remains a good buy up to $52 per share.
Wells Fargo ($WFC) reported earnings 92 cents per share for the first quarter which topped analysts’ expectations by four cents per share. Net income jumped 22% to $5.17 billion which is a record for the bank. WFC’s revenues dropped 1.2% for the quarter but like Microsoft, they’ve been able to cut costs to please analysts.
Profits at Wells’ community banking division rose 25% to $2.92 billion. Profits in wholesale banking rose 9.5% to $2.05 billion. In their wealth and brokerage unit, profits were up 14% to $337 million. Unlike JPM, the last group is a small portion of their overall business. Wells recently got approval from the Fed to raise their dividend to 30 cents per share. Thanks to the improved financial conditions of JPM and WFC, both banks are borrowing costs have dropped and they’re wisely raising tons of cash from investors. Wells Fargo is an excellent buy up to $40 per share.
Next Week Buy List Earnings Reports
Next week is going to be a busy week for our Buy List. Five of our stocks are due to report results next week including three on Tuesday. Let’s run down the reports.
On Monday, CR Bard ($BCR) is scheduled to report Q1 earnings. Previously, the company warned us that 2013 would be a rough one but that growth would pick up next year. Wall Street currently expects earnings of $1.43 per share which is a big drop from the $1.61 per share Bard made for last year’s Q1. I’m not yet confident to say that Bard’s business will rebound strongly, but if it does then the shares are quite inexpensive at the moment. I want to see the details of the earnings report before I can make a stronger case for Bard. The shares are a buy up to $102 per share.
On Tuesday, AFLAC, Ford and Stryker are due to report. The story for AFLAC ($AFL) is straightforward: Business is going well but the weak yen is gobbling up profits. In October, one dollar fetched 78 yen. That same dollar today gets 98 yen. AFLAC has said that if the yen averages 100 for the year, operating earnings per share will range between $5.99 and $6.19 per share. The stock closed Thursday at $48.90. AFLAC is a good buy up to $54.
Ford ($F) has had remarkable success lately, and I’m particularly impressed with the company’s growth in China. The weak link, however, is Europe, and that’s not all Ford’s fault. Thanks to the euro, the continent’s economy is a mess. Ford is working hard to restructure their European operations but it will take a while to see results. Wall Street expects earnings of 39 cents per share but I think Ford is our best candidate for a big earnings beat. Ford continues to be a very good buy up to $15 per share.
Stryker ($SYK) had been the hottest stock on our Buy List. Only this week have shares showed any sign of cooling off. The stock closed Thursday just below $64 per share. I’m not so worried about Stryker’s earnings report. The company usually comes within a penny or two of Wall Street’s consensus. This time around, analysts expect earnings of $1.01 per share. The company didn’t give guidance for Q1 but said to expect earnings between $4.25 and $4.40 for the entire year. Frankly, I think they’re low-balling but it’s still early in the year. Stryker remains a good buy up to $66 per share.
Moog ($MOG-A) is one of those dull stocks that I like a lot. The company is due to report earnings on Friday, April 26th. The last earnings report was a dud and the company lowered the upper-end of its full-year guidance by 10 cents per share. Still, Moog should turn in good results. The company expects fiscal year results to range between $3.50 and $3.60 per share. Moog earned $3.33 per share last year. The stock remains a solid buy up to $50 per share.
That’s all for now. Next week is a huge week for earnings. We’re also going to get our first look at the government’s report on GDP growth for Q1. I suspect that the GDP reports for this year will be better than most folks expect. Be sure to keep checking the blog for daily updates. I’ll have more market analysis for you in the next issue of CWS Market Review!
– Eddy
-
Morning News: April 19, 2013
Posted by Eddy Elfenbein on April 19th, 2013 at 7:23 amIMF’s Lagarde Says ECB Has More Room to Ease
Japan PM Reveals Growth Strategy Based on Working Women, Health Care
Russia, Japan Edge Toward Breakthrough In Gas Supplies
Senate Energy Committee Endorses MIT Physicist Ernest Moniz to Be Energy Secretary
U.S. Weekly Jobless Claims Edge Higher
Advisers’ Senior Credentials Rules Urged by U.S. Consumer Bureau
Blackstone Said to Pull Out of Dell Bid on Falling PC Sales
GSK Accused Of Abusing ‘Dominant Position’
Public Offering Values SeaWorld at $2.5 Billion
Microsoft to IBM Struggle to Manage Mobile-Computing Shift
After Apple’s Rise, a Bruising Fall
A 5-Second Guide To What’s Happening In Markets Today
Correlation, Causality, and Casuistry
Credit Writedowns: Why The Reinhart-Rogoff Paper Was Flawed Right From The Start
Howard Lindzon: Apple…The Prologue… I Blame Tim Cook and…and Elon Musk is The New King
Be sure to follow me on Twitter.
-
Morning News: April 18, 2013
Posted by Eddy Elfenbein on April 18th, 2013 at 7:46 amJapanese Exports Rise, but Demand for Goods Is Lackluster
Germany Backs Cyprus Aid as Schaeuble Cites Default Risk
Euro Zone Crisi Has Increased I.M.F.’s Power
SEC to Move Past Financial Crisis Cases Under New Chairman White
Fed Says ‘Moderate’ Growth Across U.S. Was Led by Housing
Student Borrowers Retreat From Home Buying, Report Says
Rich Ricci, the Investment Chief of Barclays, to Step Down
Toyota to Start Making Lexuses in U.S.
Chinese Smartphone Sales Boost TSMC
EBay Sales, Forecasts Miss Estimates as PayPal Growth Slows
Morgan Stanley Beats Estimates on Brokerage-Revenue Gains
As J.C. Penney Battles Macy’s For Martha Stewart, Experts Ask: Is She Worth It?
Forget Gold, the Gourmet-Cupcake Market Is Crashing
Phil Pearlman: Reconcilable Differences
Joshua Brown: “Markets Are Debates Between People Who Are Speaking With Money”
Be sure to follow me on Twitter.
-
Ford’s Big Bet on China
Posted by Eddy Elfenbein on April 17th, 2013 at 12:09 pm -
The Dow By Presidential Election Cycle
Posted by Eddy Elfenbein on April 17th, 2013 at 11:32 amI recently downloaded all of the historical closing prices for the Dow Jones Industrial Average going back to 1896. That’s over 30,000 data points.
Today let’s take a look at how the Dow has performed over four-year presidential cycles. Below is what the average cycle looks like. I set the index to start at 100 at the beginning of the post-election year.
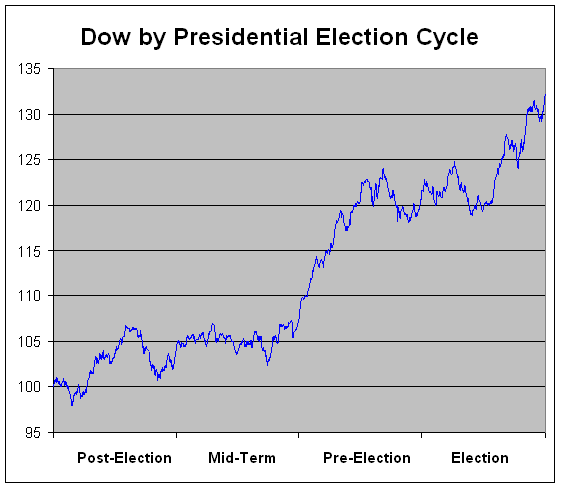
The cycle hits a rough patch beginning on August 4th of the post-election year (not too far away for us) and continues to September 30th of the mid-term. Over that span, the Dow loses an average of 4.1%.
But then things get much better. From September 30th of the mid-term until September 7th of the pre-election year, the Dow has rallied for an average gain of 21.2%. That means that nearly two-thirds of the Dow’s entire gain over four years has come in a little less than one year.
After that, the Dow slumps again. From September 7th of the pre-election year until July 24th of the election year, the Dow drops an average of 3.2%. Then things get better again. From July 24th to the end of the year, the Dow gains an average of 10.2%. If we stretch that rally until August 4th of the post-election, back to where we started, the Dow gains 17.7% in a little over one year.
After that, the Dow historically hasn’t done much of anything during the election year until July 24th. From September 7th of the pres-election year until July 24th of the election year, the Dow has lost an average of 3.2%. After that, the Dow races for a 10% rally by the end of the year (that’s a little over four months). If we stretch that rally until August 4th of the pre-election year, where we started, the Dow jumps 17.7% in a little over one year.
So we have four nearly equal periods of one year each—two bull runs and two bears.
-
Morning News: April 17, 2013
Posted by Eddy Elfenbein on April 17th, 2013 at 7:41 amThe Market Is Flashing Signs Of ‘Deep Instability’
Cyprus Finance Minister Sees Gold Sale Within Next Months
Tesco to Exit U.S. After First Profit Drop in About 20 Years
Gold Wipes $560 Billion From Central Banks as Equities Rally
Harvard Duo Defend Case For Austerity
Bank of America Earnings Rise, but Fall Short of Forecasts
Intel’s Profit Falls 25%; Outlook Less Dire
Goldman CFO: 1st-Quarter Activity Levels Mixed as Quarter Progressed
In Dell Deal, Curbing One Skewed Incentive Creates Another
J&J Earnings Beat Analyst Estimates on Sales of New Drugs
Mattel Profit Soars on Strong American Girl Sales
Macy’s Wins Temporary Bar on Some Penney Stewart Sales
Thermo Fisher to Pay $13.6b For Calif. Firm
Cullen Roche: Bernstein: The Fed Will be Behind the Curve When It’s Time to Tighten
John Hempton: Mt Gox, Bitcoin, Hordes of Chaos, Demons and Armies of Orcs…
Be sure to follow me on Twitter.
-
The Attraction of Gold
Posted by Eddy Elfenbein on April 16th, 2013 at 9:25 pmI wanted to say a few things about people who invest in gold. There are some people, not all, who are quite simply unreasonably attracted to gold. They make Goldfinger look like an amateur.
Maybe one day some cognitive scientist will find a connection between our brains and gold. For whatever reason, gold has dazzled men for millennia.
For example, gold NEVER rusts. I mean never! You can take the gold out of an Egyptian pyramid and stick it in your cavity (though you might want to clean it first). It’s also non-toxic which helps.
Gold is incredibly soft. One ounce can be stretched for 50 miles. It can be pounded down to a few MILLIONTHS of an inch thickness.
Gold is very heavy. Despite what you see in the Treasure of the Sierra Madre (“Badges? We ain’t got no badges!”), gold dust wouldn’t have blown away.
Gold has been found on every continent on earth. Gold has also had strong religious connections. It’s mentioned in the Bible more than 400 times. Marx writes of commodity fetishism, which is meant to have a religious connotation. And I won’t even get into Freud’s talk of the psychological connection of gold to feces (no, I’m not making this up).
When Moses came down from Sinai with the Ten Suggestions, the Jews were making a golden calf to worship. God instructed Moses to overlay a sanctuary for him in pure gold. In other words, gold had its bases covered—it was on both sides!
Plato mentions the gold/silver ratio to be 12. Recent historical evidence suggests that Isaac Newton was mainly an alchemist. The other stuff he did was just playing around on the side, and was probably an offshoot of his efforts to makes gold. Pieces of his hair have traces of lead and mercury.
Newton was also Master of the Mint and inadvertently put England in the gold standard. This means that one of the greatest geniuses in human history was also a civil servant who made economic policy based on a forecast. A forecast that was dead wrong.
There’s more gold at the New York Fed, waaaay below 33 Liberty Street, than in Fort Knox. Gold is also a really good conductor. So despite its high prices, it’s used in many electronics.
Earlier I mentioned Goldfinger. The Ian Fleming book was published in 1959. The plot (made into a classic 1964 movie) featured a crazy idea -– to blow up all of the U.S. gold at Fort Knox, making it radioactive and worthless. That would make Auric Goldfinger’s gold worth more. But here’s the odd part — he didn’t need to stage all that drama to make money. If he had just held on to his gold for 20 years, it would have been worth 25 times as much.
I highly recommend Peter Bernstein’s The Power of Gold: The History of an Obsession
- Load More
*UNITEDHEALTH UNDER CRIMINAL PROBE FOR POSSIBLE FRAUD: WSJ
Crossing Wall Street is looking to hire a Director of Social Media. Qualified candidates will be vain, self-centered and argumentative. Relevant skills include missing the point, name-calling, GIFs and being offended.
185% Tariffs: How the Trade War Hit One Shipment of T-Shirts
-
-
Archives
- May 2025
- April 2025
- March 2025
- February 2025
- January 2025
- December 2024
- November 2024
- October 2024
- September 2024
- August 2024
- July 2024
- June 2024
- May 2024
- April 2024
- March 2024
- February 2024
- January 2024
- December 2023
- November 2023
- October 2023
- September 2023
- August 2023
- July 2023
- June 2023
- May 2023
- April 2023
- March 2023
- February 2023
- January 2023
- December 2022
- November 2022
- October 2022
- September 2022
- August 2022
- July 2022
- June 2022
- May 2022
- April 2022
- March 2022
- February 2022
- January 2022
- December 2021
- November 2021
- October 2021
- September 2021
- August 2021
- July 2021
- June 2021
- May 2021
- April 2021
- March 2021
- February 2021
- January 2021
- December 2020
- November 2020
- October 2020
- September 2020
- August 2020
- July 2020
- June 2020
- May 2020
- April 2020
- March 2020
- February 2020
- January 2020
- December 2019
- November 2019
- October 2019
- September 2019
- August 2019
- July 2019
- June 2019
- May 2019
- April 2019
- March 2019
- February 2019
- January 2019
- December 2018
- November 2018
- October 2018
- September 2018
- August 2018
- July 2018
- June 2018
- May 2018
- April 2018
- March 2018
- February 2018
- January 2018
- December 2017
- November 2017
- October 2017
- September 2017
- August 2017
- July 2017
- June 2017
- May 2017
- April 2017
- March 2017
- February 2017
- January 2017
- December 2016
- November 2016
- October 2016
- September 2016
- August 2016
- July 2016
- June 2016
- May 2016
- April 2016
- March 2016
- February 2016
- January 2016
- December 2015
- November 2015
- October 2015
- September 2015
- August 2015
- July 2015
- June 2015
- May 2015
- April 2015
- March 2015
- February 2015
- January 2015
- December 2014
- November 2014
- October 2014
- September 2014
- August 2014
- July 2014
- June 2014
- May 2014
- April 2014
- March 2014
- February 2014
- January 2014
- December 2013
- November 2013
- October 2013
- September 2013
- August 2013
- July 2013
- June 2013
- May 2013
- April 2013
- March 2013
- February 2013
- January 2013
- December 2012
- November 2012
- October 2012
- September 2012
- August 2012
- July 2012
- June 2012
- May 2012
- April 2012
- March 2012
- February 2012
- January 2012
- December 2011
- November 2011
- October 2011
- September 2011
- August 2011
- July 2011
- June 2011
- May 2011
- April 2011
- March 2011
- February 2011
- January 2011
- December 2010
- November 2010
- October 2010
- September 2010
- August 2010
- July 2010
- June 2010
- May 2010
- April 2010
- March 2010
- February 2010
- January 2010
- December 2009
- November 2009
- October 2009
- September 2009
- August 2009
- July 2009
- June 2009
- May 2009
- April 2009
- March 2009
- February 2009
- January 2009
- December 2008
- November 2008
- October 2008
- September 2008
- August 2008
- July 2008
- June 2008
- May 2008
- April 2008
- March 2008
- February 2008
- January 2008
- December 2007
- November 2007
- October 2007
- September 2007
- August 2007
- July 2007
- June 2007
- May 2007
- April 2007
- March 2007
- February 2007
- January 2007
- December 2006
- November 2006
- October 2006
- September 2006
- August 2006
- July 2006
- June 2006
- May 2006
- April 2006
- March 2006
- February 2006
- January 2006
- December 2005
- November 2005
- October 2005
- September 2005
- August 2005
- July 2005
 Eddy Elfenbein is a Washington, DC-based speaker, portfolio manager and editor of the blog Crossing Wall Street. His