-
Morning News: April 12, 2013
Posted by Eddy Elfenbein on April 12th, 2013 at 6:38 amLondon Push to Tame Foreign Oligarchs May Trim City IPOs
Future Looks Bleaker Than Anticipated in Cyprus, Its Creditors Claim
Russia Skips Hybrids in Push for Cars Using Natural Gas
India Industrial Output Expands In February By 0.6 Percent
IMF Trims U.S. Growth Outlook in Draft Report Citing Fiscal Cuts
Economy Bears Turn Bulls Seeing 3% GDP for U.S. Few Saw in 2012
Analysts Discuss Paradigm Shift: Breaking Up Banks
JPMorgan Profit Increases 33%, Beats Estimate on Mortgage Fees
JAB to Buy Coffee Maker for $10 Billion
Checking Into What’s Behind Foursquare’s $41 Million Infusion
Infosys Shares Plunge On Weak Outlook
Former KPMG Partner Is Charged With Insider Trading
Roger Nusbaum: “Beating the Market” Makes for an Incomplete Discussion
Cullen Roche: Thoughts on the “Value” of Fiat Money
Be sure to follow me on Twitter.
-
Ross Stores Jumps on Strong Sales
Posted by Eddy Elfenbein on April 11th, 2013 at 10:27 amThe S&P 500 broke above 1,593 this morning. We had more good news from our Buy List stocks. Thanks to its good earnings report, Bed Bath & Beyond ($BBBY) got up to $68.30 today, although it’s pulled back since then.
Ford Motor ($F) is up on news of strong sales out of China. The shares are close to making a two-month high.
Our big winner for today is Ross Stores ($ROST). The discount retailer is currently up 7% thanks to a better-than-expected sales report for March. Same-stores sales jumped 2% last month. Ross had been expecting a decrease between 1% and 2%. Ross also said that it expects to top its previous earnings forecast of $1 to $1.04 per share. For April, Ross sees same-store sales rising by 5% to 6%.
Our bum stock today is Microsoft ($MSFT) which had been doing well. The shares are currently down about 4%. The catalyst for today’s sell-off was news of lousy PC sales:
On Wednesday, the research firm IDC reported that worldwide PC shipments declined 13.9 percent during the first three months of the year compared with the same period a year earlier.
To put those numbers into perspective, that is the most severe decline in the PC market since IDC began tracking the business almost two decades ago and almost double the rate of decline that the firm was expecting for the quarter.
Gartner, another research firm, had estimates that were only slightly better, showing an 11.2 percent decline in PC shipments for the first quarter.
Microsoft is due to report earnings next week.
-
Does the Stock Market Really Return 7% Per Year?
Posted by Eddy Elfenbein on April 11th, 2013 at 9:31 amI want to revisit the Ibbotson data again to look at the often-cited claim that the stock market has historically returned (capital gains and dividends) 7% per year greater than inflation. This claim has been repeated so much by Jeremy Siegel that some have called it Siegel’s Constant.
Here’s the long-term real return in blue, with a 6.9% trendline in black.
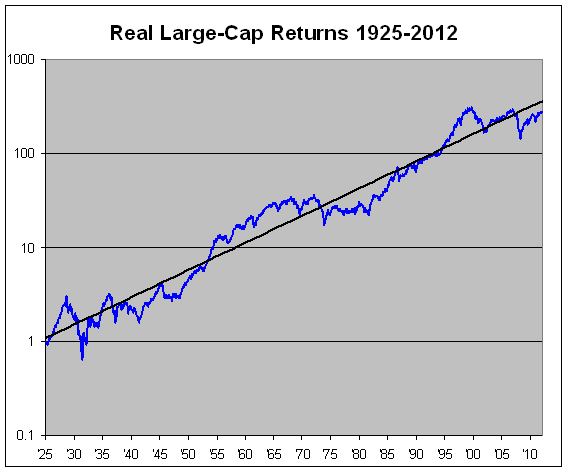
I think this is a dangerous idea for several reason. For one, the long-term real return of stocks is no longer 7%. Thanks to two giant market crashes in less than a decade, the long-term number has fallen to 6.67% (that’s since 1925). Furthermore, much of that gained comes from the post-war boom. Over that last 50 years, that real return has been a much more reasonable 5.45%.
Another problem is that this data series is highly volatile. Too volatile to call the results a constant. There have been long periods when investors haven’t made a dime from the stock market in real terms.
Looking at the data, there seem to be periods of 15 to 20 years when stocks boom, or when they bust. Notice how the blue line runs above or below the black line for long periods at a time. Still, I would say that we don’t have enough data to make the claim that the stock market does this regularly.
Here’s how the market has done versus its long-term trend. The chart below is the same as the chart above but it shows the blue line divided by the black line. When the line is rising, stocks are outperforming their long-term average. When it’s falling, stocks are trailing their long-term average. I chose a 6.9% trend line because that seems to sync up the three major peaks.
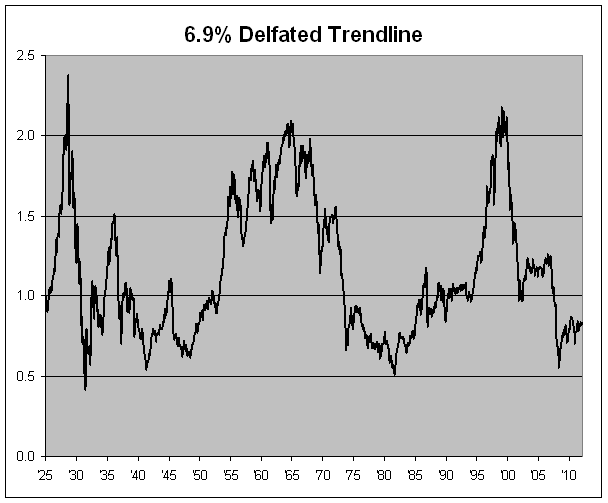
What’s interesting is that the chart above appears to be similar (though not exact) to a long-term chart of price/earnings ratios. This shouldn’t be a surprise since long-term growth in corporate profits doesn’t vary very much.
-
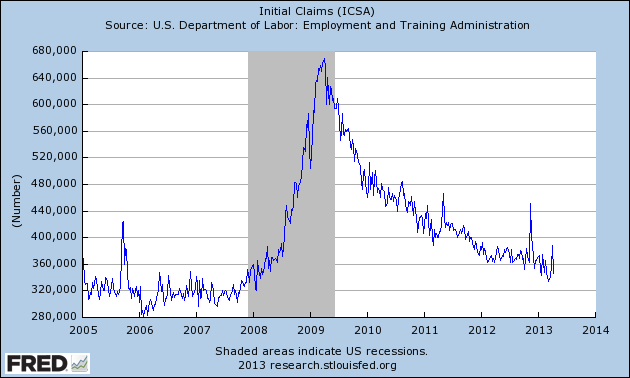
Jobless Claims Plunge
Posted by Eddy Elfenbein on April 11th, 2013 at 9:07 amThe stock market has continued to rally despite last week’s ugly jobs report. There was more bad news when jobless claims spiked. This morning, however, we learned that jobless claims dropped back to their previous range.
Jobless claims decreased by 42,000 to 346,000 in the week ended April 6, from a revised 388,000, Labor Department figures showed today in Washington. The median forecast of 49 economists surveyed by Bloomberg called for a drop to 360,000. A Labor Department official said no states were estimated and there was nothing unusual in the data.
Holidays such as Easter that fall on different weeks from year to year make it difficult to smooth out swings in the data, leading to increased volatility, the Labor Department said as the numbers were released. Waning firings, a sign employers are retaining workers to meet sales, help lay the ground for a pickup in hiring after payroll gains slowed in March.
“It’s heartening that these numbers have come down,” said Nariman Behravesh, chief economist at IHS Inc. in Lexington, Massachusetts, who forecast a decrease to 345,000, the closest among economists surveyed. “The weakness may have been overstated. This is an early piece of evidence that we’ll see a bounce back in the April employment numbers.”
The Dow closed yesterday less than 200 points away from 15,000. It was only on February 1, that we broke though 14,000.
-
Morning News: April 11, 2013
Posted by Eddy Elfenbein on April 11th, 2013 at 7:24 amChina’s March Passenger Vehicle Sales Gain 13% on Discounts
U.S. Efforts to Regulate Consultants Face Big Obstacles
Obama Meets With Blankfein, Dimon and Moynihan Today
Plosser Calls for Reducing QE Pace Citing Gains in Labor Market
FHA May Need $943-Million Bailout
Goldman Sachs, Citigroup, Received Fed Minutes Early
Seeking Relief, Banks Shift Risk to Murkier Corners
Housing Juggernaut Seen Spurring 500,000 New U.S. Workers
Toyota Joins Honda, Nissan in Car Recall on Airbag Fault
Roche First-Quarter Revenue Rises on U.S. Tamiflu Sales
Foxconn’s Sales Slump Could Foreshadow Apple (AAPL) Earnings
ConocoPhillips Halts 2014 Alaskan Arctic Drilling Plans
Phil Pearlman: Best of StockTwits Charts: Bitcoin Crashes Edition
Credit Writedowns: Japan: Taking QE to a Whole New Level
Be sure to follow me on Twitter.
-
BBBY’s Planning Assumptions for 2013
Posted by Eddy Elfenbein on April 10th, 2013 at 10:02 pmFrom Bed Bath & Beyond‘s ($BBBY) earnings call, here are their planning assumptions for 2013.
One, including the 3 stores opened to date, we currently anticipate opening approximately 45 stores across all our concepts, with the possibility of some of those pushing into the first quarter of fiscal 2014. As always, we remain flexible to take advantage of real estate opportunities that may arise.
Two, we expect to continue our program of relocating, remodeling, renovating and expanding a number of our stores during fiscal 2013.
Three, capital expenditures for fiscal 2013 are planned to be in the range of approximately $350 million, which of course remains subject to the timing and composition of projects. Projected capital expenditures, which include World Market and Linen Holdings for the full year, are primarily for new stores, existing store refurbishments and information technology enhancements such as launching our new websites by the end of the fiscal second quarter, upgrading our mobile sites and apps, enhancing network communications in our stores, implemented point-of-sale improvements and building, equipping and staffing our new IT Data Center to support our ongoing technology initiatives.
Four, we are modeling an increase of 2% to 4% in comparable store sales for the first quarter and for the full year.
Five, taking into account that the prior year was a 53-week year, and including our newly acquired companies, we are modeling consolidated net sales to increase by 17% to 19% for the first quarter and approximately 5% to 7% for the full year.
Six, depreciation for fiscal 2013 is expected to be approximately $220 million.
Seven, assuming these sales levels, modeling a continuation of the shift in the mix of merchandise sold to lower margin categories, an increase in coupon redemptions, the incremental operating costs associated with our initiatives and the consolidation of World Market and Linen Holdings, we are modeling operating profit as a percentage of net sales to deleverage for the first quarter. We also anticipate operating profit margin as a percentage of net sales to deleverage for the full year.
Eight, our annual interest line will include approximately $8.7 million in World Market interest expense, substantially resulting from the inclusion of sale-leaseback obligations related to its distribution centers.
Nine, we expect to generate positive operating cash flow and to continue to fund operations entirely from internally generated sources.
Ten, we plan to continue to repurchase shares under our $2.5 billion repurchase program, which we estimate to be completed by the end of fiscal 2015. However, this repurchase program may be influenced by several factors, including business and market conditions.
Based on these and other planning assumptions, including a tax rate that is approximately 400 to 500 basis points higher than in the fiscal first quarter of fiscal 2012, we are modeling net earnings per diluted share to be approximately $0.88 to $0.94 for the fiscal first quarter of 2013.
For the 52 weeks of fiscal 2013, including the incrementally higher tax rate assumption, we are modeling net earnings per diluted share to increase by a mid-single digit to a low-double-digit percentage range over the 53 weeks of fiscal 2012.
-
Bed Bath & Beyond Earns $1.68 Per Share
Posted by Eddy Elfenbein on April 10th, 2013 at 4:21 pmFor Q4, Bed Bath & Beyond ($BBBY) earned $1.68 per share. Three months ago, the company gave guidance of $1.60 to $1.67 per share. The Street had been expecting $1.75 per share. This is basically what people expected. Quarterly sales rose 24.5%.
For Q1, BBBY sees earnings ranging between 88 and 94 cents per share. Wall Street had been expecting 95 cents per share. For the full year, the company expects earnings-per-share to rise from “mid single to a low double digit percentage range.” For 2012, the company earned $4.56 per share, so a 4% to 11% increase translates to a range of $4.74 to $5.06 per share for 2013.
Here are the sales and earnings figures for the past few quarters:
Quarter Sales Gross Profit Operating Profit Net Profit EPS May-99 $356,633 $146,214 $28,015 $17,883 $0.06 Aug-99 $451,715 $185,570 $53,580 $33,247 $0.12 Nov-00 $480,145 $196,784 $50,607 $31,707 $0.11 Feb-00 $569,012 $238,233 $77,138 $48,392 $0.17 May-00 $459,163 $187,293 $36,339 $23,364 $0.08 Aug-00 $589,381 $241,284 $70,009 $43,578 $0.15 Nov-01 $602,004 $246,080 $64,592 $40,665 $0.14 Feb-01 $746,107 $311,802 $101,898 $64,315 $0.22 May-01 $575,833 $234,959 $45,602 $30,007 $0.10 Aug-01 $713,636 $291,342 $84,672 $53,954 $0.18 Nov-02 $759,438 $311,030 $83,749 $52,964 $0.18 Feb-02 $879,055 $370,235 $132,077 $82,674 $0.28 May-02 $776,798 $318,362 $72,701 $46,299 $0.15 Aug-02 $903,044 $370,335 $119,687 $75,459 $0.25 Nov-03 $936,030 $386,224 $119,228 $75,112 $0.25 Feb-03 $1,049,292 $443,626 $168,441 $105,309 $0.35 May-03 $893,868 $367,180 $90,450 $57,508 $0.19 Aug-03 $1,111,445 $459,145 $155,867 $97,208 $0.32 Nov-04 $1,174,740 $486,987 $161,459 $100,506 $0.33 Feb-04 $1,297,928 $563,352 $231,567 $144,248 $0.47 May-04 $1,100,917 $456,774 $128,707 $82,049 $0.27 Aug-04 $1,273,960 $530,829 $189,108 $120,008 $0.39 Nov-05 $1,305,155 $548,152 $190,978 $121,927 $0.40 Feb-05 $1,467,646 $650,546 $283,621 $180,980 $0.59 May-05 $1,244,421 $520,781 $150,884 $98,903 $0.33 Aug-05 $1,431,182 $601,784 $217,877 $141,402 $0.47 Nov-06 $1,448,680 $615,363 $205,493 $134,620 $0.45 Feb-06 $1,685,279 $747,820 $304,917 $197,922 $0.67 May-06 $1,395,963 $590,098 $148,750 $100,431 $0.35 Aug-06 $1,607,239 $678,249 $219,622 $145,535 $0.51 Nov-07 $1,619,240 $704,073 $211,134 $142,436 $0.50 Feb-07 $1,994,987 $862,982 $309,895 $205,842 $0.72 May-07 $1,553,293 $646,109 $154,391 $104,647 $0.38 Aug-07 $1,767,716 $732,158 $211,037 $147,008 $0.55 Nov-08 $1,794,747 $747,866 $203,152 $138,232 $0.52 Feb-08 $1,933,186 $799,098 $259,442 $172,921 $0.66 May-08 $1,648,491 $656,000 $118,819 $76,777 $0.30 Aug-08 $1,853,892 $739,321 $187,421 $119,268 $0.46 Nov-08 $1,782,683 $692,857 $136,374 $87,700 $0.34 Feb-09 $1,923,274 $785,058 $231,282 $141,378 $0.55 May-09 $1,694,340 $666,818 $142,304 $87,172 $0.34 Aug-09 $1,914,909 $773,393 $222,031 $135,531 $0.52 Nov-09 $1,975,465 $812,412 $245,611 $151,288 $0.58 Feb-10 $2,244,079 $955,496 $370,741 $226,042 $0.86 May-10 $1,923,051 $775,036 $225,394 $137,553 $0.52 Aug-10 $2,136,730 $874,918 $296,902 $181,755 $0.70 Nov-10 $2,193,755 $896,508 $305,110 $188,574 $0.74 Feb-11 $2,504,967 $1,076,467 $461,052 $283,451 $1.12 May-11 $2,109,951 $857,572 $288,948 $180,578 $0.72 Aug-11 $2,314,064 $950,999 $371,636 $229,372 $0.93 Nov-11 $2,343,561 $958,693 $357,020 $228,544 $0.95 Feb-12 $2,732,314 $1,163,669 $550,765 $351,043 $1.48 May-12 $2,218,292 $887,199 $313,398 $206,836 $0.89 Aug-12 $2,593,015 $1,032,669 $365,137 $224,330 $0.98 Nov-12 $2,701,801 $1,074,010 $361,649 $232,750 $1.03 Feb-13 $3,401,477 $1,394,877 $598,034 $373,872 $1.68 -
Jamie’s Shareholder Letter
Posted by Eddy Elfenbein on April 10th, 2013 at 2:01 pmHere’s Jamie Dimon’s letter to shareholders. It’s quite long and he goes into many different subjects including the London Whale fiasco.
-
S&P 500 = 1,588
Posted by Eddy Elfenbein on April 10th, 2013 at 1:52 pmThe stock market continues to roll higher. The S&P 500 has been as high as 1,588.94. The index broke the 158 level 30 years ago this week.
I think Wall Street is pleased by today’s Fed minutes. I’ve read through them and nothing really jumps out at me. It’s pretty much as I expected.
On our Buy List, boring little Moog ($MOG-A) is up more than 3.5% today. Stryker ($SYK) finally got to $67 today, another new 52-week high. SYK has been a great stock for us this year. It’s already up 22% on the year for us.
-
New All-Time Intra-Day High
Posted by Eddy Elfenbein on April 10th, 2013 at 9:43 amHere are a few items I wanted to highlight this morning.
Despite the resurgence of fear in the media recently, the stock market continues to do well. The S&P 500 has jumped up to another all-time high this morning. In fact, the index finally took out its intra-day high of 1,576.09 from October 11, 2007. Today’s high was (so far) 1,576.10.
The Federal Reserve accidentally emailed out its Fed minutes five hours early. The minutes are starting to get more coverage in the media since traders are looking for any clue that QE is coming to an end. For now, I think they’re misinterpreting rather pedestrian comments as firm policy positions. QE isn’t coming to an end but it’s very reasonable for the Fed officials to discuss when that ought to happen.
Bed Bath & Beyond ($BBBY) will release its fourth-quarter earnings today. In last week’s CWS Market Review, I said that it would be out on Monday. My apologies for the error. This report will cover the important holiday season for BBBY.
Microsoft ($MSFT) has come to life recently. The shares are close to breaking above $30 per share. The company is joining other tech outfits in complaining to the EU that Android is a below-cost competitor.
The Ford Focus was named the best-selling car in the world. Last year, Ford ($F) sold just over 1 million units, up 16% from 2011.
- Load More
What does it mean when Tom Cruise, (who believes that Lord Xenu sacrificed the thetans in a volcano—or something like that), appears to be the sanest person in Hollywood?
The S&P 500 just wrapped up its best May in 30 years.
Trump Media raised around $1.44 billion from selling stock and about $1 billion in convertible bonds to buy Bitcoin for its treasury
-
-
Archives
- May 2025
- April 2025
- March 2025
- February 2025
- January 2025
- December 2024
- November 2024
- October 2024
- September 2024
- August 2024
- July 2024
- June 2024
- May 2024
- April 2024
- March 2024
- February 2024
- January 2024
- December 2023
- November 2023
- October 2023
- September 2023
- August 2023
- July 2023
- June 2023
- May 2023
- April 2023
- March 2023
- February 2023
- January 2023
- December 2022
- November 2022
- October 2022
- September 2022
- August 2022
- July 2022
- June 2022
- May 2022
- April 2022
- March 2022
- February 2022
- January 2022
- December 2021
- November 2021
- October 2021
- September 2021
- August 2021
- July 2021
- June 2021
- May 2021
- April 2021
- March 2021
- February 2021
- January 2021
- December 2020
- November 2020
- October 2020
- September 2020
- August 2020
- July 2020
- June 2020
- May 2020
- April 2020
- March 2020
- February 2020
- January 2020
- December 2019
- November 2019
- October 2019
- September 2019
- August 2019
- July 2019
- June 2019
- May 2019
- April 2019
- March 2019
- February 2019
- January 2019
- December 2018
- November 2018
- October 2018
- September 2018
- August 2018
- July 2018
- June 2018
- May 2018
- April 2018
- March 2018
- February 2018
- January 2018
- December 2017
- November 2017
- October 2017
- September 2017
- August 2017
- July 2017
- June 2017
- May 2017
- April 2017
- March 2017
- February 2017
- January 2017
- December 2016
- November 2016
- October 2016
- September 2016
- August 2016
- July 2016
- June 2016
- May 2016
- April 2016
- March 2016
- February 2016
- January 2016
- December 2015
- November 2015
- October 2015
- September 2015
- August 2015
- July 2015
- June 2015
- May 2015
- April 2015
- March 2015
- February 2015
- January 2015
- December 2014
- November 2014
- October 2014
- September 2014
- August 2014
- July 2014
- June 2014
- May 2014
- April 2014
- March 2014
- February 2014
- January 2014
- December 2013
- November 2013
- October 2013
- September 2013
- August 2013
- July 2013
- June 2013
- May 2013
- April 2013
- March 2013
- February 2013
- January 2013
- December 2012
- November 2012
- October 2012
- September 2012
- August 2012
- July 2012
- June 2012
- May 2012
- April 2012
- March 2012
- February 2012
- January 2012
- December 2011
- November 2011
- October 2011
- September 2011
- August 2011
- July 2011
- June 2011
- May 2011
- April 2011
- March 2011
- February 2011
- January 2011
- December 2010
- November 2010
- October 2010
- September 2010
- August 2010
- July 2010
- June 2010
- May 2010
- April 2010
- March 2010
- February 2010
- January 2010
- December 2009
- November 2009
- October 2009
- September 2009
- August 2009
- July 2009
- June 2009
- May 2009
- April 2009
- March 2009
- February 2009
- January 2009
- December 2008
- November 2008
- October 2008
- September 2008
- August 2008
- July 2008
- June 2008
- May 2008
- April 2008
- March 2008
- February 2008
- January 2008
- December 2007
- November 2007
- October 2007
- September 2007
- August 2007
- July 2007
- June 2007
- May 2007
- April 2007
- March 2007
- February 2007
- January 2007
- December 2006
- November 2006
- October 2006
- September 2006
- August 2006
- July 2006
- June 2006
- May 2006
- April 2006
- March 2006
- February 2006
- January 2006
- December 2005
- November 2005
- October 2005
- September 2005
- August 2005
- July 2005
 Eddy Elfenbein is a Washington, DC-based speaker, portfolio manager and editor of the blog Crossing Wall Street. His