-
Morning News: April 10, 2013
Posted by Eddy Elfenbein on April 10th, 2013 at 7:36 amU.S. Seeks Less Austerity in Euro Zone
BoJ Bazooka Sends Japanese Debt Reeling
The Mystery of China’s Export Numbers
WTO Cuts 2013 Trade Forecast After Record Slow Growth In 2012
Obama Budget Targets Millionaires, Replaces Sequester Cuts
Obama Nominee Pledges Case-by-Case Review of Gas Exports
Lenders Used Aid to Repay TARP
Retiree Health Benefits: Facing Extinction?
Scant Relief in Foreclosure Payouts
First Solar Issues Optimistic Guidance; Shares Jump 48%
Blackstone Solicits Partners for Dell Bid
J.C. Penney: A National Disgrace
Jeff Carter: New Pitching Idea for Startups
Howard Lindzon: Momentum Wrap – Back Near All-Time Highs. Here Comes The Sun?
Be sure to follow me on Twitter.
-
So What if We Had a Flat Tax?
Posted by Eddy Elfenbein on April 9th, 2013 at 10:24 amLast year, the CBO released a report on historical effective tax rates. I ran through the data with an odd goal in mind. I wanted to see if I could replicate the existing tax burden with a simple flat tax.
I don’t mean to say that I’m a flat tax advocate. I simply wanted to look at what Americans actually pay and see if I could mimic the real thing with the simple rules of a flat tax.
The answer is, not really, at least not very accurately. The CBO report only gave me eight data points to work with.
Still, this type of analysis has value. In fact, there are emerging fields of study, like Chaos Theory, that look to find simple rules that lie beneath highly complex structures.
Here’s what I was able to come up with. The graph below is my Faux Flat Tax going back to 1979. The blue line follows the left scale and is the flat tax rate. The black line follows the right scale and is the standard household deduction. The deduction is in 2009 dollars.
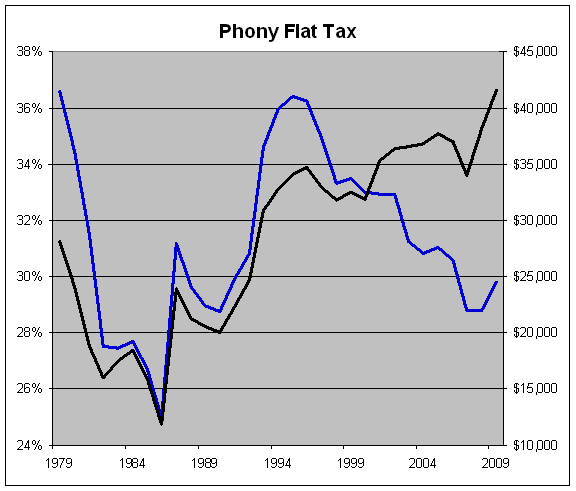
For 2009, I came up with a tax rate of 29.81% and a deduction of $41,541. So every penny a household makes under that is completely tax free. Every penny above it is taxed at 29.81%. That includes everything—income taxes, social security, Medicare, corporate taxes, the whole shebang. And most importantly, we can abolish the IRS (wait for applause).
I realize these aren’t quite the numbers that most flat taxers have in mind, but my goal is mimicry. I took the current tax code “as is” and tried to be revenue neutral. Obviously, if I had more data points I could be more accurate.
Looking at the table does reveal some interesting information. When the two lines rise, the tax code becomes more progressive (higher taxes on the rich and less on the poor). When both lines fall, the reverse happens.
What I find interesting is that despite using just eight data points, there seems to be some continuity through the years. So even if I had much more data, I think this is a reasonable approximation of what a clear-the-table flat tax would look like.
Notice, for example, how the two lines tended to track each other somewhat for most of the 1980s and early 90s. So there was some method to the madness. The relationship only broke down over the past few years as we’ve seen larger deductions and lower tax rates. The big spike in deductions near the end represents the effect of the payroll tax holiday.
One of the drawbacks of my flat tax is no matter how impressive my R-square is (.9994 in 2009), any small deviation can be rather unpleasant for certain taxpayers. That’s the messiness of using a simple model to replace a complex one. The flat tax doesn’t quite capture the right “bend” of the current tax burden. For example, under my flat tax, households making $93,800 would have a tax hike of more than $1,400. I don’t think they would be terribly impressed by my stab at being revenue neutral.
As a general rule, my flat tax is close to the current burden but it tends to be slightly more progressive. The major reason is due to social insurance taxes. Since so many lower-income workers are completely exempt from any taxation under my theoretical flat tax, it’s made up for with higher taxes at the upper end.
Let me explain how I got my numbers. I apologize but this is going to get mathy. In the data files of the CBO report, Tab 1 has the effective tax rates and Tab 3 has the pre-tax income for eight subsections; the lowest four income quintiles, plus four subsections for the top quintile (percentiles 81 to 90, 91 to 95, 96 to 99 and the Top 1%).
If you run a scatter plot with the X-axis being the eight income points and the Y-axis being the tax paid (income times effective tax rate), you get this:
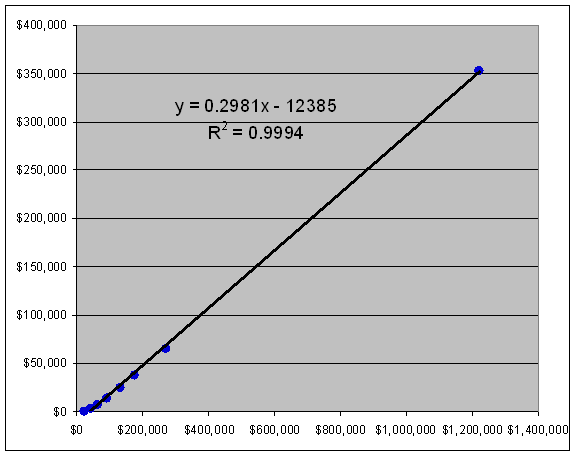
That’s for 2009. Using the trend line function, I added a linear trend line and the linear equation is also included. In the equation, y = mx + b, m is our flat tax rate and b/m is the deduction. As you can see, that’s how I got 29.81%.
Here’s the Flat Tax Data I used for the computations. Columns B through I have the household incomes for the eight groups (note that the definition for household income changed in 1986), columns J through Q have the taxes paid and columns R through Y have the effective tax rates.
On lines 35 to 66, I list the flat tax info. Column B has the tax rate by using the SLOPE function. On Column C, I get the deduction by using the INTERCEPT function.
-
Morning News: April 9, 2013
Posted by Eddy Elfenbein on April 9th, 2013 at 7:34 amChina’s Stocks Rise Most in 2 Weeks After Inflation Slows
In Berlin, Treasury Secretary Talks Up Policies To Spur Demand
European Leaders Keep Telling Themselves The Same Huge Lie — And It’s Ruining The Economy
Emerging Asian Economies on Track for Solid Growth, Development Bank Says
Christie’s to Be First Foreign Independent Auction House in China
Bernanke Says Fed to Press Banks to Curb Liquidity Risk
Fannie Mae Profit May Swell Treasury Coffers as Debt Limit Looms
Ford Focus Grabs Global Sales Crown as World Buys Small
GE Buys Lufkin for $3.3 Billion as Immelt Adds to Energy
Billabong in Talks Over $300 Million Takeover
5 Things Ron Johnson Did Right At JC Penney
Caribou Coffee Closings: Chain Reveals Massive Nationwide Shutterings, Chicago Area Hit Hard
Wary of China, Companies Head to Cambodia
Cullen Roche: Economic Surprise Indices Turning Lower
Joshua Brown: Merrill: How to Play the Bond Market
Be sure to follow me on Twitter.
-
The Yen Continues to Weigh on AFLAC
Posted by Eddy Elfenbein on April 8th, 2013 at 1:58 pmAFLAC ($AFL) is back below $50 and the culprit isn’t hard to spot — the weaker yen. Since October, the yen has gotten hammered by the U.S. dollar.
In March, the yen staged a quick relief rally, but that recently collapsed. It now takes 99 yen to buy one U.S. dollar. In October, it took just 78. I think we’re going to break 100 soon.
The reason for the big change is that Japan’s new government is aggressively trying to weaken its currency in order to help their economy. The Nikkei Index has responded by shooting up from 9,000 to as high as 13,200. That’s a huge move for such a short time period.
AFLAC said in their 10-K that if the yen averages 100 for this year, that will shave 87 cents off their operating earnings-per-share. At 100 yen to the dollar, AFLAC’s earnings range would be $5.99 to $6.19 per share for 2013.
Exchange Rate EPS Range Growth Rate Yen Impact 79.81 $6.86 to $7.06 3.9% to 7.0% $0.00 85 $6.60 to $6.80 0% to 3% -$0.26 90 $6.37 to $6.57 (3.5%) to (0.5%) -$0.49 95 $6.17 to $6.37 (6.5%) to (3.5%) -$0.69 100 $5.99 to $6.19 (9.2%) to (6.2%) -$0.87 -
R.I.P.: Margaret Thatcher
Posted by Eddy Elfenbein on April 8th, 2013 at 12:30 pmMargaret Thatcher died today at the age of 87. Here’s the intro of a post I a wrote few years ago comparing Britain in the 1970s to General Motors:
In 1979, the British economy was in free fall. Inflation was spiraling out of control. The unions were demanding commensurate pay increases, and when they didn’t get them, they struck. The country that had stood up to the Luftwaffe was failing apart. The garbage men went on strike and soon piles of “rubbish” dotted the countryside. Even the gravediggers went on strike and corpses were gruesomely left unburied.
The winter of 1978-79 was called the Winter of Discontent, echoing the opening lines of Richard III. The situation was so bad that Her Majesty’s government had to apply for a loan from the IMF. This was back in the days when that had some sense of shame to it. You were even expected to pay it back.
A reporter asked the Prime Minister, James, Callaghan, his opinion of the “the mounting chaos in the country.” Callaghan said: “Well, that’s a judgment that you are making. I promise you that if you look at it from outside, and perhaps you’re taking rather a parochial view at the moment, I don’t think that other people in the world would share the view that there is mounting chaos.”
That was it. British socialism died right there. The commanding heights were nothing more than a literal heap of trash. The next day, The Sun‘s headline read: “Crisis? What Crisis?”
-
Morning News: April 8, 2013
Posted by Eddy Elfenbein on April 8th, 2013 at 8:01 amIMF’s Lagarde Says Substantial Part of Global Economy Better
Luxembourg ‘Open’ To Bank Transparency, Luc Frieden
Italy To Pay 40 Billion Euros Of State Debt To Companies
Unemployment Woes: Americans Drop Out Of Labor Force As Job Market Stagnates
How Dismal Were March’s Job Numbers?
How The Feds Will Know If You Have Health Insurance
The Top Tax Scams to Watch For
Why Amazon’s Jeff Bezos Invested in ‘Business Insider’
Carl Icahn Refuses To Drop Proxy Fight Option In Dell Proposal, WSJ Reports
On JOBS Act Anniversary, Why Can’t Everyday People Invest In Startups?
HP Board Revamp Gives CEO Chance to Shake Off Troubles
China’s Xi Warns Against Regional Chaos as Korea Tensions Rise
Deposit Insurance After Iceland and Cyprus
Roger Nusbaum: The Big Picture for the Week of April 7, 2013
Be sure to follow me on Twitter.
-
What Risk Premium?
Posted by Eddy Elfenbein on April 5th, 2013 at 1:06 pmMore fun from the Ibbotson Yearbook. Here’s a look at large-cap stocks dividend by long-term Treasury bonds, also known as the risk premium (although short-term rates are more often used).
The risk premium is one the most important ideas in finance. In short, it tells us how much you get paid to take on the risk of owning stocks instead of guaranteed government bonds. (Note: According to Ibbotson, the Treasury bond data series is based on a 20-year T-bond.)
I disagree with most mainline thinking on this issue in that I believe the risk premium is much lower than is commonly believed. Most academics think it’s around 5% or so. I think the long-run premium is probably about 2%. Eric Falkenstein thinks it doesn’t exist at all.
According to the Ibbotson numbers, large-cap stocks have outperformed Treasury bonds by an average of 3.93% per year since 1925.
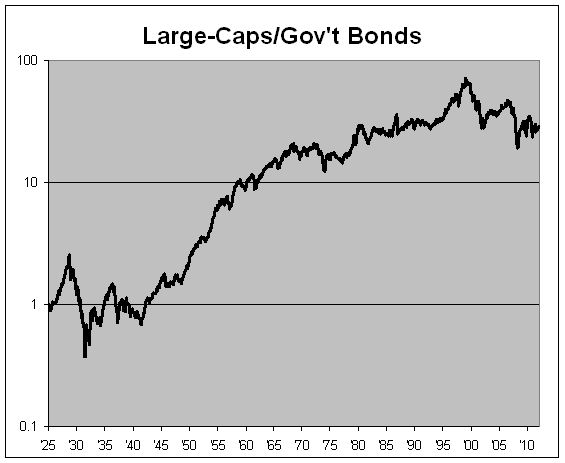
But as the chart shows, that data series is very volatile. Government bonds have outperformed large-cap stocks since November 1980. That’s more than 32 years of no risk premium. Since May 1969, the risk premium has been a grand total of 0.77%. Over the last 12 years, it looks really ugly. Treasury bonds have beaten large-caps by a painful 207% to 24% margin.
Due to the ultra-low yields for Treasuries, I suspect large-caps will outperform bonds by 5% in the intermediate range. The yield on the 20-year T-bond closed yesterday at 2.6%. If we assume a 2% risk premium, that translates to a return for stocks of 7.6%, and that includes dividends which currently run around 2%.
-
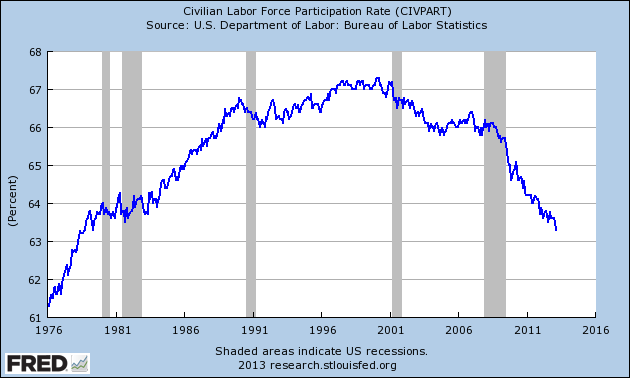
March NFP: +88K
Posted by Eddy Elfenbein on April 5th, 2013 at 8:32 amYikes, this morning’s jobs report was ugly. The economy added just 88,000 nonfarm payroll jobs in March, and 95,000 of those were private sector. Wall Street had been expecting a gain of 190,000 total, and 200,000 private sector jobs. This is the biggest NFP “miss” in more than three years. The labor force participation rate has fallen to its lowest point since 1979. The Dow is off 137 points right now. January’s NFP was revised higher to 29,000, and February by 32,000. The unemployment rate fell to 7.6%. There’s now an all-time record 101.7 million Americans over the age of 16 without a job. That’s an increase of 28 million since 1999.
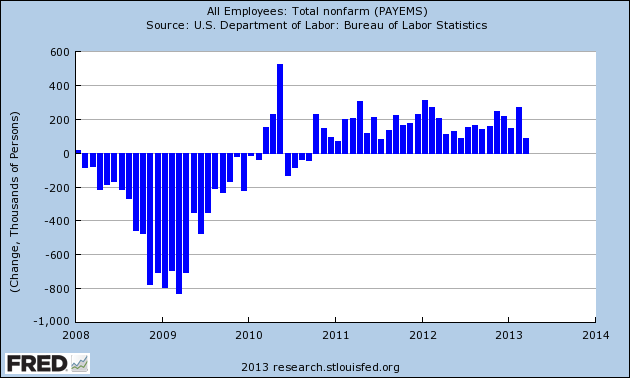
Here’s a look at the plunge in the labor force participation rate:
-
CWS Market Review – April 5, 2013
Posted by Eddy Elfenbein on April 5th, 2013 at 7:20 am“There is only one side of the market, and it is not the bull
side or the bear side, but the right side.” – Jesse LivermoreLet me give you the briefest summation of Wall Street over the last six months: Investors worry about something that’s unlikely to happen, the financial media amplifies said worry, calming voices are ignored, the markets trends downward, the financial media then calls for civility and public-spiritedness to address the needless worry they just promoted, incredibly the world doesn’t end, the worries fade away, volatility falls and the market quietly rallies.
We’ve repeated this dance so many times I’m beginning to lose count. There was the Fiscal Cliff, the debt ceiling (remember the $1-trillion coin), the elections in Italy, the fiasco in Cyprus and the Great Rotation out of bonds. The latest worry is war rumblings from North Korea. While the rhetoric is disturbing, the reality is that Pyongyang’s bark is far worse than its bite.
What’s interesting is that the market has so far ignored the threats from North Korea. I suspect that we’re going through Apocalypse Fatigue. Michael Gayed has suggested we’re in a Honey Badger market: Whatever latest worry comes our way, stock market don’t care. I suspect he’s on to something.
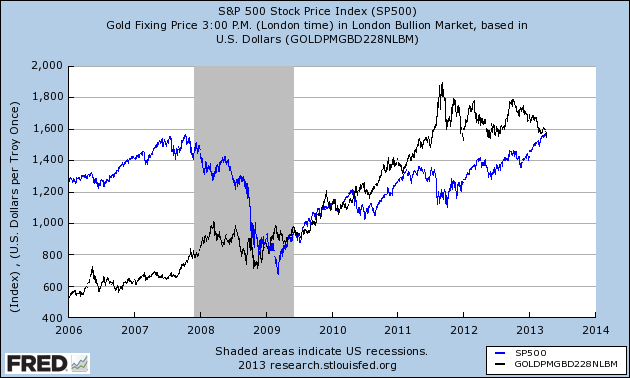
There are, however, stealth movements occurring within the market that we need to pay attention to. Since the middle of March, the market has become more defensive. A lot more defensive. The more-conservative sectors have led the more-aggressive sectors. In a few cases, the divergence has been rather stunning. The Healthcare ETF ($XLV), for example, has beaten the S&P 500 for the last 12 days in a row. Both Utilities ($XLU) and Consumer Staples ($XLP) have been recent leaders as well.
The move towards defensive stocks is telling us something. Coupled with the recent drop in gold, this suggests that investors are finally shying away from risk. The price of gold actually fell below the S&P 500 for the first time since May 4, 2010 (see chart above). I won’t go so far as to say this portends a bear market, but it may spell an end to the market’s appetite for risk.
What to do now: Investors should remain calm and make sure they own high-quality stocks such as the ones on our Buy List. Dividends are especially important right now. A 3% yield might not seem like a lot, but traders will swim to those lifeboats if things get rough. Earnings season starts next week, and I expect that the gap between winners are losers will grow even wider. Patience and discipline are our keys.Updates on Every Buy List Stock
This week, I want to do something a little different. Since there hasn’t been much news lately, and since earnings season is about to begin, I thought I’d offer a brief update for every stock on the Buy List.
AFLAC ($AFL) broke above $53 earlier this week before pulling back. Later this month, we’ll find out how much the weaker yen has been biting away at AFL’s bottom line. After showing a little strength recently, the yen plunged again on Thursday. Yen or not, I still like AFLAC’s market position. The shares are a buy up to $54.
Bed Bath & Beyond ($BBBY) will report fiscal Q4 earnings on April 10th. On the last earnings call, BBBY said to expect Q4 earnings to range between $1.60 and $1.67 per share. The Street had been expecting $1.75, so the stock got spanked. The good news was that the stock became a very good bargain, and I sounded the alarm in mid-February. The stock has rallied very nicely since then. I’m going to keep our Buy Below at $65. I suspect BBBY will earn about $1.70 per share, give or take, but I’m more interested in hearing their outlook for the rest of 2013. Stay tuned.
CA Technologies ($CA) got off to a great start this year but has pretty much stagnated ever since. In January, I predicted the company would beat earnings, and that’s exactly what happened. On the surface, CA appears to be a dull company, but don’t let that fool you. The stock currently yields just over 4%. CA is a good buy up to $27.
Cognizant Technology Solutions ($CTSH) has drifted lower in recent weeks. If you don’t own CTSH, this is a good opportunity. The IT outsourcer soundly beat earnings in January and guided higher for Q1 and the entire year. CTSH said it sees full-year 2013 earnings of at least $4.31, which means the stock is going for 17.3 times earnings. Buy up to $82.
CR Bard ($BCR) has been rather sluggish this year. In January, the company warned that this year will be rough, but 2014 should be very good. The stock isn’t in my doghouse just yet, but I want to hear better things from them before I’m willing to raise my Buy Below price. For now, Bard is a buy up to $102.
DirecTV ($DTV) has been one of our best performers of late. Last week, I raised DTV’s Buy Below to $59 after it beat earnings by 42 cents per share. This is an excellent stock, but I think the shares may take a breather for a bit around $55 since it’s run up so quickly.
FactSet Research Systems ($FDS) has found a base around $90 per share. If you recall, the stock took a beating after reporting decent earnings. At least, I thought they were decent. Traders, however, seemed to disagree. Don’t let the sell-off scare you: FactSet is a very good company. FDS remains a buy below $95.
Fiserv ($FISV) made a new 52-week high on Monday. Fiserv is as solid as they come. Q1 earnings are due out on April 29th. Fiserv is a buy up to $88.
Ford Motor ($F) had a good sales report for March. Earnings should be out around the middle of the month. The Street currently expects 39 cents per share, which is flat from a year ago. Ford is doing well, but Europe may still be an anchor. Ford is a buy up to $15 per share.
Harris Corp. ($HRS) may be the single-best value on our Buy List right now. The stock took another hit after Oppenheimer said that Harris is running below its full-year revenue forecast. For now, I trust Harris’s record more than Oppenheimer’s. Earnings are due out at the end of the month. Harris is a buy up to $53 per share.
JPMorgan Chase ($JPM) will report Q1 earnings on Thursday, April 11th. Wall Street expects $1.38 per share. Hopefully, Jamie Dimon won’t shoot his mouth off on the earnings call. JPM has pulled back over the past few weeks. Don’t let that rattle you. JPM remains a solid buy up to $52.
Medtronic ($MDT) is another good example of a stock that fell after its earnings report but has since gained back everything it lost. Like Stryker, Medtronic has ridden the healthcare rally this year. Look for good earnings next month and another dividend increase in June. Buy below $48.
Microsoft ($MSFT) is due to report earnings on April 17th. Wall Street’s consensus is for 77 cents per share. The last earnings report was pretty good. On Wednesday, the shares hit a five-month high. If volatility makes you nervous, this is an excellent low-vol stock. Microsoft is a buy up to $30.
Moog ($MOG-A) lowered the upper end of their full-year guidance by 10 cents per share in January. The CEO said they’re off to a slow start this year. After a strong rally in December in January, the shares have pulled back recently. Moog is a buy up to $50.
Nicholas Financial ($NICK) still yields a rich 3.23% even after its recent price surge. I haven’t heard any news about the buyout offer, but I wouldn’t be surprised if others are interested in NICK. The fact is that with rates so low, big investors are looking at non-traditional places to get yield like used car loans. NICK is a good buy up to $16.
Oracle ($ORCL) got hit after a lousy earnings report. I have to apologize for this one. I thought Oracle would do much better. But never count Oracle out. I’m going to drop my Buy Below down to $35.
Ross Stores ($ROST) had a good earnings report two weeks ago and the shares have rallied. ROST is a solid buy up to $62.
Stryker ($SYK) is our second-best performer this year. But don’t chase it. Earnings are due out on April 23rd. They didn’t give a Q1 forecast, but said to expect $4.25 to $4.40 per share for all of 2013. That’s probably too low. Buy SYK anytime you see it below $66.
Wells Fargo ($WFC) remains a solid buy up to $40. Look for a strong earnings report around the middle of the month.
WEX Inc. ($WXS) announced that on April 15th, they’re changing their ticker symbol to WEX. Frankly, I like this move. I hate it when ticker symbols don’t match the name. Let me add that I kept the Buy Below on WEX at $75 despite the market price being above $75. I did this because I don’t want investors to chase this one. As disciplined investors, we wait for good stocks to come to us. Well, on Wednesday and Thursday, the stock fell below $75 during the day. WEX remains a buy up to $75 per share.
That’s all for now. Earnings season kicks off next week. Remember: We’ll see earnings reports next week from JPMorgan Chase and Bed Bath & Beyond. On Wednesday, the Fed will release the minutes from their March 29-30 meeting. This might actually be newsworthy, depending on how much they talked about ending their bond purchases. Be sure to keep checking the blog for daily updates. I’ll have more market analysis for you in the next issue of CWS Market Review!
– Eddy
-
Morning News: April 5, 2013
Posted by Eddy Elfenbein on April 5th, 2013 at 6:51 amMoney Funds Meet Zero Yields by Breaking Buck Taboo
ECB’s Coeure Sees Euro Zone Inflation Straying Off Course
BOJ Ripples Felt in Europe as Government Bonds Rise
Kim Vows Increased Climate-Change Role to Help Ease Poverty
Finland Turns to Venture Funds to Rescue Economy
Yellen: Fed Should Focus On Jobs, Even If Inflation Edges Past Target
The Market Is In A Tug-O-War The Likes Of Which Hasn’t Been Seen In Three Decades
Regulators Probing Alleged Mortgage Insurance Kickback Scheme
Samsung Sees Big Profit Boost From Smartphones
Freeh Says Corzine’s Risky Strategy Helped Fell MF Globals
Shake-Up On Hewlett-Packard Board
Texas Refinery is Saudi Foothold in U.S. Market
Facebook Software Puts It Front and Center on Android Phones
Howard Lindzon: Don’t Be Stubborn…Retail is NOT Dead
Stone Street: Put Me in Coach!
Be sure to follow me on Twitter.
- Load More
Costco 1st Quarter Revenues...
2025: $63 Billion
2020: $37 Billion
2015: $26 Billion
2010: $18 Billion
2005: $12 Billion
2000: $7 Billion
1995: $4 Billion
That's a 10% annualized growth rate over the last 30 years.
$COSTBezos once said: "The thing I've noticed is when the anecdotes and the data disagree, the anecdotes are usually right. There's something wrong with the way you are measuring it."
Applies to so much more than business. Never let a statistic blind you from seeing the naked truth…I imagine it would.
"New Stalin monument in Moscow subway stirs debate".
-
-
Archives
- May 2025
- April 2025
- March 2025
- February 2025
- January 2025
- December 2024
- November 2024
- October 2024
- September 2024
- August 2024
- July 2024
- June 2024
- May 2024
- April 2024
- March 2024
- February 2024
- January 2024
- December 2023
- November 2023
- October 2023
- September 2023
- August 2023
- July 2023
- June 2023
- May 2023
- April 2023
- March 2023
- February 2023
- January 2023
- December 2022
- November 2022
- October 2022
- September 2022
- August 2022
- July 2022
- June 2022
- May 2022
- April 2022
- March 2022
- February 2022
- January 2022
- December 2021
- November 2021
- October 2021
- September 2021
- August 2021
- July 2021
- June 2021
- May 2021
- April 2021
- March 2021
- February 2021
- January 2021
- December 2020
- November 2020
- October 2020
- September 2020
- August 2020
- July 2020
- June 2020
- May 2020
- April 2020
- March 2020
- February 2020
- January 2020
- December 2019
- November 2019
- October 2019
- September 2019
- August 2019
- July 2019
- June 2019
- May 2019
- April 2019
- March 2019
- February 2019
- January 2019
- December 2018
- November 2018
- October 2018
- September 2018
- August 2018
- July 2018
- June 2018
- May 2018
- April 2018
- March 2018
- February 2018
- January 2018
- December 2017
- November 2017
- October 2017
- September 2017
- August 2017
- July 2017
- June 2017
- May 2017
- April 2017
- March 2017
- February 2017
- January 2017
- December 2016
- November 2016
- October 2016
- September 2016
- August 2016
- July 2016
- June 2016
- May 2016
- April 2016
- March 2016
- February 2016
- January 2016
- December 2015
- November 2015
- October 2015
- September 2015
- August 2015
- July 2015
- June 2015
- May 2015
- April 2015
- March 2015
- February 2015
- January 2015
- December 2014
- November 2014
- October 2014
- September 2014
- August 2014
- July 2014
- June 2014
- May 2014
- April 2014
- March 2014
- February 2014
- January 2014
- December 2013
- November 2013
- October 2013
- September 2013
- August 2013
- July 2013
- June 2013
- May 2013
- April 2013
- March 2013
- February 2013
- January 2013
- December 2012
- November 2012
- October 2012
- September 2012
- August 2012
- July 2012
- June 2012
- May 2012
- April 2012
- March 2012
- February 2012
- January 2012
- December 2011
- November 2011
- October 2011
- September 2011
- August 2011
- July 2011
- June 2011
- May 2011
- April 2011
- March 2011
- February 2011
- January 2011
- December 2010
- November 2010
- October 2010
- September 2010
- August 2010
- July 2010
- June 2010
- May 2010
- April 2010
- March 2010
- February 2010
- January 2010
- December 2009
- November 2009
- October 2009
- September 2009
- August 2009
- July 2009
- June 2009
- May 2009
- April 2009
- March 2009
- February 2009
- January 2009
- December 2008
- November 2008
- October 2008
- September 2008
- August 2008
- July 2008
- June 2008
- May 2008
- April 2008
- March 2008
- February 2008
- January 2008
- December 2007
- November 2007
- October 2007
- September 2007
- August 2007
- July 2007
- June 2007
- May 2007
- April 2007
- March 2007
- February 2007
- January 2007
- December 2006
- November 2006
- October 2006
- September 2006
- August 2006
- July 2006
- June 2006
- May 2006
- April 2006
- March 2006
- February 2006
- January 2006
- December 2005
- November 2005
- October 2005
- September 2005
- August 2005
- July 2005
 Eddy Elfenbein is a Washington, DC-based speaker, portfolio manager and editor of the blog Crossing Wall Street. His