-
Goodbye Dow 13,000
Posted by Eddy Elfenbein on April 9th, 2012 at 5:26 pmToday was an ugly day on Wall Street. The market is still reeling from Friday’s jobs report. The cylicals were hit especially hard as were many financials.
There are a few things to remember: The market has climbed almost continuously for six-straight months, so some give back is to be expected. Also, the jobs report is hardly evidence that the new recession is on the way. It merely signals that jobs growth isn’t quite as robust as we thought. These numbers will be revised and the other evidence continues to show a modestly improving jobs environment.
One outlier in today’s selloff was Nicholas Financial ($NICK). The shares closed at $12.42 which is a 5.48% fall from Thursday’s close. The stock got as low at $12.14 in today’s trading. I wouldn’t worry about this at all.
There’s absolutely no news to indicate that NICK is in any trouble. This is purely a market-driven event. If anything, the belief that the Fed will hold down rates for a while longer is actually good news for NICK. Going by today’s close, the stock yields 3.22%.
-
The Reckoning for Friday’s Jobs Report
Posted by Eddy Elfenbein on April 9th, 2012 at 10:18 amThe stock market is getting its first chance to react to Friday’s lousy jobs report, and not surprisingly, it’s not happy. The Dow is down 140 points and the S&P 500 is below 1,380.
The cyclicals and financials are taking most of the hits. The gold market is up which makes sense if traders expect the Fed will be more accommodative (though it’s kinda hard to be any more accommodative at this point). The bond market is also rallying.
This could be the fourth down day in a row for the market. Plus, it would finally snap the “up, up, down, down, down” trend of the past three weeks. Still, this isn’t that much of a drop. We’re currently off about 2.7% from the 44-month high we made last Monday.
I said that the stock market had two hurdles coming — one was the jobs report and the second was earnings season. Wall Street clearly didn’t like the first, so now it’s up to the second. As I’ve said, I expect the market to bounce around for a few weeks until we have a clearer picture of what the second half of 2012 will look like. That’s why I’m not only focusing on earnings but also on company guidance.
-
Morning News: April 9, 2012
Posted by Eddy Elfenbein on April 9th, 2012 at 7:26 amIn Europe, Unease Over Bank Debt
China Inflation Data Keeps Policy Bias on Growth
Japan Current Account Moving to Surplus Adds Support for Yen
Russian Stocks Drop on Central Bank Rates Decision, Lower Crude
Qatar Builds Up Xstrata Stake Ahead of Glencore Deal
Brazil Will Not Levy Taxes on All Foreign Capital
Crude Oil Lower After Disappointing US, China Data
Jobs Pose Challenge S&P 500 Has Overcome Nine Times
Federal Funds to Train the Jobless Are Drying Up
JPMorgan Trader Iksil Fuels Prop-Trading Debate With Bets
AT&T, CWA Remain in Talks After Labor Contracts Expire
Sony to Cut Estimated 10,000 Jobs
Jeff Miller: Weighing the Week Ahead: More Excuses for Selling?
Phil Pearlman: The Anticipation and the Reality of Correction Shrinkology
Be sure to follow me on Twitter.
-
The Jobs Report Was a Bust
Posted by Eddy Elfenbein on April 6th, 2012 at 11:14 amI said that the stock market will probably stay in a holding pattern until we get a better idea of how well the jobs market is recovering and how the corporate earnings front looks.
This morning we learned that the jobs market isn’t quite so hot. The Labor Department reported that a meager 120,000 nonfarm payroll jobs were created last month. That’s half the gain from February. Wall Street had been expecting a gain of 205,000. The unemployment rate ticked down to 8.2% from 8.3% the month before.
Over the last seven years, the U.S. economy has created a grand total of minus 13,000 nonfarm payroll jobs. If we were to have the same jobs-to-population ratio as 12 years ago, there would have to be 14.6 million more jobs, or 22.6 million fewer people. There is now an all-time record of 100.5 million American adult civilians without jobs (civilian non-institutional population over the age 16 not working). That’s a 34% increase since 2000.
Although the stock market is closed today, the bond market rose as investors migrated toward more conservative assets.

-
CWS Market Review – April 6, 2012
Posted by Eddy Elfenbein on April 6th, 2012 at 6:50 amOn Thursday, the stock market finished the fifteenth day in a row of its “up, up, down, down, down” pattern. Why is this happening? Honestly, I have no idea and it’s safe to say that even trying to find a reason will only lead us to being fooled by randomness. But as I said last week, the stock market is most likely entering a trading range until we have a better handle on how the jobs market and earnings outlook shake out.
In this week’s issue of CWS Market Review, I want to highlight some of our most promising upcoming earnings reports. I’ll also explain why assets are suddenly disentangling. If you want to sound smart, you can say the correlations are declining, but between you and me, this simply means that the normal order is reasserting itself—and that’s a very good omen for our Buy List.
Bed Bath & Beyond Soars on Blow-Out Earnings
Before we get to that, let’s talk about our star pupil of the week: Bed Bath & Beyond ($BBBY). The stock soared 8.5% on Thursday after a blowout earnings report. BBBY is a wonderful company and it’s in a great position to prosper from renewed consumer spending.
After the closing bell on Wednesday, Bed Bath & Beyond said it netted $1.48 per share for its fiscal fourth quarter. That creamed Wall Street’s consensus by 15 cents per share. Not too shabby. In December, the company told us to expect Q4 earnings to range between $1.28 and $1.33 per share. So their results were even better than they expected.
Looking through the numbers, the details were exceptionally strong. Profits jumped 32% from the fourth quarter of 2010. Quarterly sales rose by 9.1% and the key retailing metric, comparable store sales, rose by 6.8%. For the year, Bed Bath & Beyond earned $4.06 per share which was also a 32% increase over the year before. Sales rose 8.5% to $9.5 billion, and comparable store sales increased by 5.9%.
I’ve discussed before how growing margins have aided corporate profits, but the effect has been especially pronounced at Bed Bath & Beyond. This is the twelfth quarter in a row in which the company has expanded its net margins. In the three years since fiscal 2009, total sales have grown by 32%, but net earnings are up by an amazing 133%. The reason is that net profit margins increased from 5.9% in 2009 to 10.4% last year.

Even with as good as the numbers are, I was especially impressed by Bed Bath & Beyond’s guidance. For Q1, BBBY sees earnings ranging between 79 cents and 83 cents per share. They earned 72 cents per share in last year’s Q1. For the full-year figure, they project earnings “to increase by a high single to a low double digit percentage range.” If we take that mean to 10%, it translates to a full-year forecast of $4.47 per share.
This is excellent news. We now have a 24% year-to-date gain and that comes on top of a nice 18% gain we racked up last year. BBBY continues to exceed expectations. I said in December that I thought the Street’s forecast for 2012 of $4.39 was too high. Shows what I know! Plus, I urged investors to be cautious about this stock going into earnings. Now we have solid evidence of how well things are going. In fact, I suspect that the company is low-balling us with this latest guidance. We have a winner on our hands. I’m raising my buy price on BBBY to $75 per share.
The Stock Market’s Return to Normalcy
During most of last year, the stock market was jerked around by an annoying tug-of-war between risk-on and risk-off trades. The U.S. stock market became highly correlated with the dollar/euro trade, and that was tied to the latest political rumors in Europe. Not only were stocks correlated with currencies, but also stocks were highly correlated with each other.
When this happens, it’s very frustrating for our investing style which focuses on high-quality stocks. I prefer to see a lot of dispersion among stocks (meaning everybody doing their own thing). Last year, it seemed like every stock behaved like every other stock. One odd offshoot of this effect is that the handful of stocks that didn’t follow the crowd saw highly abnormal activity. Netflix ($NFLX) was probably the best example. The company soared to an absurd valuation simply because it was one of the very few ideas that seemed to be working. Not surprisingly, the stock has plunged back to earth over the past several months.
The financial media often reported that most actively managed mutual funds underperformed the broader indexes last year. That’s true, but it missed an important fact: The relative performance of active managers is highly correlated to the relative performance of small-cap stocks.
This makes perfect sense since the index funds dominate the mega-cap stocks. With the rising level of fear last year, investors flocked to larger (and hopefully) safer names. Now we’re learning that some of those big-name stocks may not be so safe. Blue chips like ExxonMobil ($XOM) have badly lagged the market this year.
Fortunately, the U.S. stock market has slowly untangled itself from the ups and downs of Europe. As bad as the events in Greece are, they’re very small within the realm of global finance. One outcome of the market’s return to normalcy is that daily volatility has declined dramatically. This year, volatility has had its biggest decline in 78 years.
The WSJ recently noted that stock correlations are at their lowest level since before the financial crisis. I view this as a very positive development for us, and investors will soon realize that there will be a very large gap between good stocks and bad stocks.
Look for Good Earnings from Ford
Earnings season begins next week and I’m already going through my preparations. Outside of our Buy List, I’m not especially optimistic for the results this time around. One company that I think has a very good chance of surprising investors is Ford ($F). Wall Street currently expects earnings of 38 cents per share, which seems very low to me.
The news at Ford continues to get better. In my humble opinion, the company has a very good shot of earning $1.50 per share for this year, which means the stock is going for a little over eight times earnings. That’s a very good bargain. I was pleased to see Ford report its best March sales in five years. Plus, a major analyst recently raised his earnings estimate for the automaker. Ford is also ramping up production in China. The stock is a very good buy up to $15 per share.
Another earnings report to keep an eye on is CA Technologies ($CA). Three months ago, the company stunned Wall Street by beating earnings estimates by more than 20%. CA also raised its dividend five-fold. Look for more good results in a few weeks. Some other earnings surprises to watch for are from Wright Express ($WXS), JPMorgan Chase ($JPM) and Moog ($MOG-A). As I said, the market may be choppy over the next few weeks, so please don’t get discouraged. The trends are definitely in our favor.
That’s all for now. Remember that the market will be closed on Good Friday. Be sure to keep checking the blog for daily updates. I’ll have more market analysis for you in the next issue of CWS Market Review!
– Eddy
-
Morning News: April 6, 2012
Posted by Eddy Elfenbein on April 6th, 2012 at 6:21 amSwiss Franc Showdown Looms as Jordan Defends SNB Ceiling
Spain to Present Budget Stability Plan to EU After Bonds Fell
World’s Richest Lose $9 Billion as Global Markets Decline
Crackdown on Tax Havens Opens Opportunities for Bankers
Federal Judge Approves $25 Billion Mortgage Pact
Investors’ Prying Eyes Blinded by New Law
Microsoft is Writing Checks to Fill Out Its App Store
Facebook to Nasdaq Gives CEO Greifeld a Victory Over NYSE
Samsung Profit Exceeds Estimates on Smartphone, TV Demand
Spring, in the Air and on the Racks, Helps Retailers
Airbus Wins 90 Net Orders in Jan-March
Motley Fool 52-Week-High Alert: Starbucks
Spectrum Says Bladder Cancer Drug Fails, Buys Allos
Stone Street: NFPreview Charts
Roger Nusbaum: Deep (Portfolio) Thoughts With Marc Faber
Be sure to follow me on Twitter.
-
Reprise: The Elfenbein Gold Model
Posted by Eddy Elfenbein on April 5th, 2012 at 1:23 pmThere’s been a lot of discussion about the price of gold lately. Below I’m reposting my idea for how to model the price of gold. I originally ran this post 18 months ago and it became, by far, the most clicked-on post I ever ran. Cullen Roche of Pragmatic Capitalist was kind enough to also run this post today at his site (by the way, that’s an excellent blog). Also today, Felix Salmon discussed his views on the price of gold.
Here’s my original post from October 2010:
One of the most controversial topics in investing is the price of gold. Eleven years ago, gold dropped as low as $252 per ounce. Since then, the yellow metal has risen more than five-fold, easily outpacing the major stock market indexes—and it seems to move higher every day.
Some goldbugs say this is only the beginning and that gold will soon break $2,000, then $5,000 and then $10,000 per ounce.
But the question is, “How can anyone reasonably calculate what the price of gold is?” For stocks, we have all sorts of ratios. Sure, those ratios can be off…but at least they’re something. With gold, we have nothing. After all, gold is just a rock (ok ok, an element).
How the heck can we even begin to analyze gold’s value? There’s an old joke that the price of gold is understood by exactly two people in the entire world. They both work for the Bank of England and they disagree.
In this post, I want to put forth a possible model for evaluating the price of gold. The purpose of the model isn’t to say where gold will go but to look at the underlying factors that drive gold. Let me caution that as with any model, this model has its flaws, but that doesn’t mean it isn’t useful.
The key to understanding the gold market is to understand that it’s not really about gold at all. Instead, it’s about currencies, and in our case that means the dollar. Gold is really the anti-currency. It serves a valuable purpose in that it keeps all the other currencies honest (or exposes their dishonesty).
This may sound odd but every currency has an interest rate tied to it. In essence, that interest rate is what the currency is all about. All those dollar bills in your wallet have an interest rate tied to them. The euro, the pound and the yen also all have interest rates tied to them.
Before I get to my model, I want to take a step back for a moment and discuss a strange paradox in economics known as Gibson’s Paradox. This is one the most puzzling topics in economics. Gibson’s Paradox is the observation that interest rates tend to follow the general price level and not the rate of inflation. That’s very strange because it seems obvious that as inflation rises, interest rates ought to keep up. And as inflation falls back, rates should move back as well. But historically, that wasn’t the case.
Instead, interest rates rose as prices rose, and rates only fell when there was deflation. This paradox has totally baffled economists for years. Yet it really does exist. John Maynard Keynes called it “one of the most completely established empirical facts in the whole field of quantitative economics.” Milton Friedman and Anna Schwartz said that “the Gibsonian Paradox remains an empirical phenomenon without a theoretical explanation.”
Even many of today’s prominent economists have tried to tackle Gibson’s Paradox. In 1977, Robert Shiller and Jeremy Siegel wrote a paper on the topic. In 1988 Robert Barsky and none other than Larry Summers took on the paradox in their paper “Gibson’s Paradox and the Gold Standard,” and it’s this paper that I want to focus on. (By the way, in this paper the authors thank future econobloggers Greg Mankiw and Brad DeLong.)
Summers and Barsky explain that the Gibson Paradox does indeed exist. They also say that it’s not connected with nominal interest rates but with real (meaning after-inflation) interest rates. The catch is that the paradox only works under a gold standard. Once the gold standard is gone, the Gibson Paradox fades away.
It’s my hypothesis that Summers and Barsky are on to something and that we can use their insight to build a model for the price of gold. The key is that gold is tied to real interest rates. Where I differ from them is that I use real short-term interest rates whereas they focused on long-term rates.
Here’s how it works. I’ve done some back-testing and found that the magic number is 2% (I’m dumbing this down for ease of explanation). Whenever the dollar’s real short-term interest rate is below 2%, gold rallies. Whenever the real short-term rate is above 2%, the price of gold falls. Gold holds steady at the equilibrium rate of 2%. It’s my contention that this was what the Gibson Paradox was all about since the price of gold was tied to the general price level.
Now here’s the kicker: there’s a lot of volatility in this relationship. According to my backtest, for every one percentage point real rates differ from 2%, gold moves by eight times that amount per year. So if the real rates are at 1%, gold will move up at an 8% annualized rate. If real rates are at 0%, then gold will move up at a 16% rate (that’s been about the story for the past decade). Conversely, if the real rate jumps to 3%, then gold will drop at an 8% rate.
Here’s what the model looks like against gold over the past two decades:

The relationship isn’t perfect but it’s held up fairly well over the past 15 years or so. The same dynamic seems at work in the 15 years before that, but I think the ratios are different.
In effect, gold acts like a highly-leveraged short position in U.S. Treasury bills and the breakeven point is 2% (or more precisely, a short on short-term TIPs).
Let me make this clear that this is just a model and I’m not trying to explain 100% of gold’s movement. Gold is subject to a high degree of volatility and speculation. Geopolitical events, for example, can impact the price of gold. I would also imagine that at some point, gold could break a replacement price where it became so expensive that another commodity would replace its function in industry, and the price would suffer.
Instead of explaining all of gold, my aim is to pinpoint the underlying factors that are strongly correlated with gold. The number and ratios I used (2% break-even and 8-to-1 ratio) seem to have the strongest correlation for recent history. How did I arrive at them? Simple trial and error. The true numbers may be off and I’ll leave the fine-tuning for someone else.
In my view, there are a few key takeaways.
The first and perhaps the most significant is that gold isn’t tied to inflation. It’s tied to low real rates which are often the by-product of inflation. Right now we have rising gold and low inflation. This isn’t a contradiction. (John Hempton wrote about this recently.)
The second point is that when real rates are low, the price of gold can rise very, very rapidly.
The third is that when real rates are high, gold can fall very, very quickly.
Fourth, there’s no reason for there to be a relationship between equity prices and gold (like the Dow-to-gold ratio).
Fifth, the TIPs yield curve indicates that low real rates may last for a few more years.
The final point is that the price of gold is essentially political. If a central banker has the will to raise real rates as Volcker did 30 years ago, then the price of gold can be crushed.
Technical note: If you want to see how the heck I got these numbers, please see this spreadsheet.
Column A is the date.
Column B is an index of real returns for T-bills I got from the latest Ibbotson Yearbook. It goes through the end of last year.
Column C is a 2% trendline.
Column D is adjusting B by C.
Column E is inverting Column D since we’re shorting.
Column F computes the monthly change the levered up 8-to-1.
Column G is the Model with a starting price of $275 (in red).
Column H is the price of gold. It goes up to last September. -
Would You Buy This Stock?
Posted by Eddy Elfenbein on April 5th, 2012 at 12:01 pmWhat do you think?

-
Jobless Claims Fall…Again
Posted by Eddy Elfenbein on April 5th, 2012 at 9:19 amI’m starting to lose count of how many times weekly jobless claims have dropped to a four-year low, but it happened again today. Combined with yesterday’s ADP report, this sets us up for an optimistic jobs report tomorrow. Economists expect to a see nonfarm payroll gain of 230,000.
The futures market currently indicates that the market will open lower today. This looks like it could be the 15th day in a row of the “up, up, down, down, down” trend.
One stock will probably buck the market today. Bed Bath & Beyond ($BBBY) looks to open over $69 per share this morning.
-
Morning News: April 5, 2012
Posted by Eddy Elfenbein on April 5th, 2012 at 6:01 amDraghi Scotches ECB Exit Talk as Spain Keeps Crisis Alive
Euribor Rates Hit New 21-month Lows After ECB Meeting
Greece to Swap 20.3 Billion Euros of Foreign-Law Bonds April 11
Bank of Japan Nominee Kono Rejected as Lawmakers Seek Easing
Shares Dip as Fed Aims to Pull Back
Americans Brace for Next Foreclosure Wave
Wall St. Examines Fine Print in a Bill for Start-Ups
Huffington Gains More Control in AOL Revamping
British Airways’ Europe-Empire Zeal Tested by AMR-JAL Crunch
Refinery Gets a Look From Delta, Perplexing Analysts
Dimon Letter Derides Contrived, Confusing Financial Rules
Electronic Dance Concerts Turn Up Volume, Tempting Investors
Merkel Gunning for Germany as Luxury Rifles Draw Russians
Jeff Carter: A Manufactured Crisis
Be sure to follow me on Twitter.
- Load More
You can do very well by betting on the big winners before they became the big winners.
"Japan’s births mark record low in 2024, plummet below 700,000." They predicted it would get here by 2039 but made it 15 years early. ?
Florida's Housing Market 'Turning Down Fast'
-
-
Archives
- June 2025
- May 2025
- April 2025
- March 2025
- February 2025
- January 2025
- December 2024
- November 2024
- October 2024
- September 2024
- August 2024
- July 2024
- June 2024
- May 2024
- April 2024
- March 2024
- February 2024
- January 2024
- December 2023
- November 2023
- October 2023
- September 2023
- August 2023
- July 2023
- June 2023
- May 2023
- April 2023
- March 2023
- February 2023
- January 2023
- December 2022
- November 2022
- October 2022
- September 2022
- August 2022
- July 2022
- June 2022
- May 2022
- April 2022
- March 2022
- February 2022
- January 2022
- December 2021
- November 2021
- October 2021
- September 2021
- August 2021
- July 2021
- June 2021
- May 2021
- April 2021
- March 2021
- February 2021
- January 2021
- December 2020
- November 2020
- October 2020
- September 2020
- August 2020
- July 2020
- June 2020
- May 2020
- April 2020
- March 2020
- February 2020
- January 2020
- December 2019
- November 2019
- October 2019
- September 2019
- August 2019
- July 2019
- June 2019
- May 2019
- April 2019
- March 2019
- February 2019
- January 2019
- December 2018
- November 2018
- October 2018
- September 2018
- August 2018
- July 2018
- June 2018
- May 2018
- April 2018
- March 2018
- February 2018
- January 2018
- December 2017
- November 2017
- October 2017
- September 2017
- August 2017
- July 2017
- June 2017
- May 2017
- April 2017
- March 2017
- February 2017
- January 2017
- December 2016
- November 2016
- October 2016
- September 2016
- August 2016
- July 2016
- June 2016
- May 2016
- April 2016
- March 2016
- February 2016
- January 2016
- December 2015
- November 2015
- October 2015
- September 2015
- August 2015
- July 2015
- June 2015
- May 2015
- April 2015
- March 2015
- February 2015
- January 2015
- December 2014
- November 2014
- October 2014
- September 2014
- August 2014
- July 2014
- June 2014
- May 2014
- April 2014
- March 2014
- February 2014
- January 2014
- December 2013
- November 2013
- October 2013
- September 2013
- August 2013
- July 2013
- June 2013
- May 2013
- April 2013
- March 2013
- February 2013
- January 2013
- December 2012
- November 2012
- October 2012
- September 2012
- August 2012
- July 2012
- June 2012
- May 2012
- April 2012
- March 2012
- February 2012
- January 2012
- December 2011
- November 2011
- October 2011
- September 2011
- August 2011
- July 2011
- June 2011
- May 2011
- April 2011
- March 2011
- February 2011
- January 2011
- December 2010
- November 2010
- October 2010
- September 2010
- August 2010
- July 2010
- June 2010
- May 2010
- April 2010
- March 2010
- February 2010
- January 2010
- December 2009
- November 2009
- October 2009
- September 2009
- August 2009
- July 2009
- June 2009
- May 2009
- April 2009
- March 2009
- February 2009
- January 2009
- December 2008
- November 2008
- October 2008
- September 2008
- August 2008
- July 2008
- June 2008
- May 2008
- April 2008
- March 2008
- February 2008
- January 2008
- December 2007
- November 2007
- October 2007
- September 2007
- August 2007
- July 2007
- June 2007
- May 2007
- April 2007
- March 2007
- February 2007
- January 2007
- December 2006
- November 2006
- October 2006
- September 2006
- August 2006
- July 2006
- June 2006
- May 2006
- April 2006
- March 2006
- February 2006
- January 2006
- December 2005
- November 2005
- October 2005
- September 2005
- August 2005
- July 2005
 Eddy Elfenbein is a Washington, DC-based speaker, portfolio manager and editor of the blog Crossing Wall Street. His
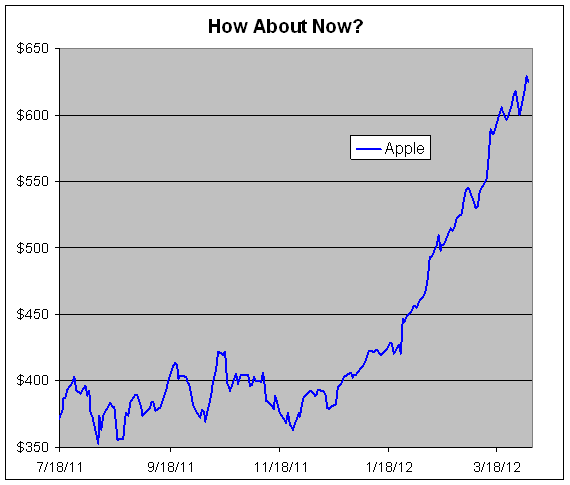