The 2012 Buy List
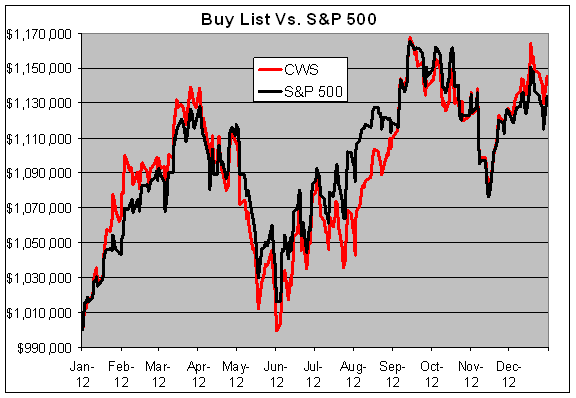
The 2012 trading year has come to a close. I’m happy to report that our Buy List had another market-beating year. The 20 stocks on the Crossing Wall Street Buy List gained 14.56% while the S&P 500 gained 13.41%. This is the sixth year in a row that we have beaten the market.
Including dividends, our Buy List gained 17.85% compared with 16.00% for the S&P 500. The dividend yield for the Buy List worked out to 2.16% while it was 2.28% for the S&P 500. For the year, our beta was 1.0376.
Over the seven-year history of the Buy List, we’ve gained 62.30% to the S&P 500’s 32.65%. Our annual turnover has been just 25% which means we’ve only changed five stocks per year. The seven-year beta is 0.9591.
I’ll restate the rules of the Buy List. I choose a portfolio of 20 stocks at the beginning of the year. After that, the Buy List is locked for the year and I can’t make any changes until the following year. For tracking purposes, I assume that the Buy List is a $1 million portfolio equally divided among the 20 stocks. You can check the performance of the Buy List anytime at our Buy List page.
My goal is to show investors that by choosing stocks wisely and by sticking with high-quality stocks, they can beat the market—and that’s exactly what we’ve done. I try to beat the market by a few percentage points and to do it with less risk.
Our top-performing stock in 2012 was WEX Inc. ($WXS) which gained 38.85%. Other big winners were Harris Corp. ($HRS) up 35.85%, Fiserv ($FISV) up 34.54% and JPMorgan Chase ($JPM) up 32.24%.
Here’s how each stock performed:
| Stock |
Shares |
12/31/2011 |
Beginning |
12/31/2012 |
Ending |
Profit/Loss |
| AFL |
1155.8021 |
$43.26 |
$50,000.00 |
$53.12 |
$61,396.21 |
22.79% |
| BBBY |
862.5151 |
$57.97 |
$50,000.00 |
$55.91 |
$48,223.22 |
-3.55% |
| CA |
2472.7992 |
$20.22 |
$50,000.00 |
$21.98 |
$54,352.13 |
8.70% |
| BCR |
584.7953 |
$85.50 |
$50,000.00 |
$97.74 |
$57,157.89 |
14.32% |
| DTV |
1169.3171 |
$42.76 |
$50,000.00 |
$50.16 |
$58,652.95 |
17.31% |
| FISV |
851.2087 |
$58.74 |
$50,000.00 |
$79.03 |
$67,271.02 |
34.54% |
| F |
4646.8401 |
$10.76 |
$50,000.00 |
$12.95 |
$60,176.58 |
20.35% |
| HRS |
1387.3474 |
$36.04 |
$50,000.00 |
$48.96 |
$67,924.53 |
35.85% |
| HCBK |
8000.0000 |
$6.25 |
$50,000.00 |
$8.13 |
$65,040.00 |
30.08% |
| JNJ |
762.4276 |
$65.58 |
$50,000.00 |
$70.10 |
$53,446.17 |
6.89% |
| JOSB |
1025.4307 |
$48.76 |
$50,000.00 |
$42.58 |
$43,662.84 |
-12.67% |
| JPM |
1503.7594 |
$33.25 |
$50,000.00 |
$43.97 |
$66,120.30 |
32.24% |
| MDT |
1307.1895 |
$38.25 |
$50,000.00 |
$41.02 |
$53,620.91 |
7.24% |
| MOG-A |
1138.1744 |
$43.93 |
$50,000.00 |
$41.03 |
$46,699.29 |
-6.60% |
| NICK |
3900.1560 |
$12.82 |
$50,000.00 |
$12.40 |
$48,361.93 |
-3.28% |
| ORCL |
1949.3177 |
$25.65 |
$50,000.00 |
$33.32 |
$64,951.27 |
29.90% |
| RAI |
1207.1463 |
$41.42 |
$50,000.00 |
$41.43 |
$50,012.07 |
0.02% |
| SYK |
1005.8338 |
$49.71 |
$50,000.00 |
$54.82 |
$55,139.81 |
10.28% |
| SYY |
1704.7392 |
$29.33 |
$50,000.00 |
$31.66 |
$53,972.04 |
7.94% |
| WXS |
921.1496 |
$54.28 |
$50,000.00 |
$75.37 |
$69,427.04 |
38.85% |
| Total |
|
|
$1,000,000 |
|
$1,145,608.20 |
14.56% |
Here’s how the Buy List performed throughout the year.
Posted by Eddy Elfenbein on December 31st, 2012 at 7:43 pm
The information in this blog post represents my own opinions and does not contain a recommendation for any particular security or investment. I or my affiliates may hold positions or other interests in securities mentioned in the Blog, please see my Disclaimer page for my full disclaimer.
-
 Eddy Elfenbein is a Washington, DC-based speaker, portfolio manager and editor of the blog Crossing Wall Street. His Buy List has beaten the S&P 500 over the last 20 years. (more)
-
Archives