I downloaded all the numbers and crunched some interesting results. I’ll present some here and add more later on during the week.
| Day |
Count |
Average Daily Gain |
| Monday |
5,662 |
-0.0961% |
| Tuesday |
5,904 |
0.0388% |
| Wednesday |
5,963 |
0.0484% |
| Thursday |
5,867 |
0.0221% |
| Friday |
5,845 |
0.0599% |
| Saturday |
2,601 |
0.0525% |
Mondays have been the worst day by far, but Mondays performed a lot better after Meltdown Monday in 1987. Consider this fact: Since November 13, 1987, Monday and Tuesdays combined are up 595.68% for the Dow, while Wednesday, Thursday and Friday combined are up 9.72%. For more a quarter of a century, nearly the Dow’s entire gain has come during the first 40% of the week.
Here are the cumulative gains by each day of the week. With my version of Excel, I could only make a chart going back to 1912.
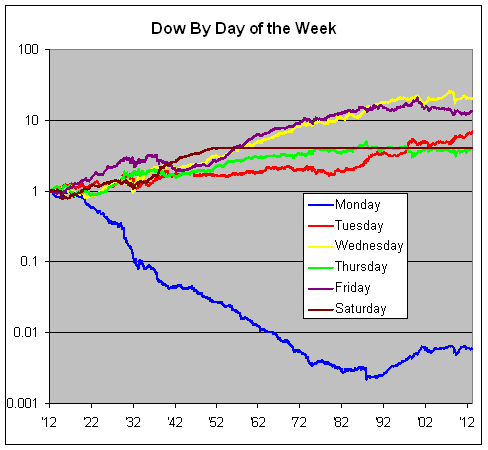
You can see how poorly Monday has done, although it’s done much better since 1987. Tuesday has also improved.
I’m struck by how poorly the other three days have done in recent years. Going back to July 1995, all the Thursdays combined are flat; the same for Fridays going back to April 1983, and Thursdays haven’t made a single dime for the Dow going back to January 1976. Since March 22, 1979, Tuesdays have returned more than the other four days of the week combined.
After 117 years, there have been 31,842 trading days. The average daily gain is 0.02458%. In simpler terms, that’s roughly a one penny gain each day for every $40 invested. The standard deviation is 1.10018%. This means that the Dow swings, on average, 45 times its average daily gain. Think about that at the end of each trading day.
The Dow’s total gain after 117 years is equal to its best 98 days combined, or its best 0.3%, those 98 days when the index gained 4.54% or more. Fifty-four of those days came between 1929 and 1933, and ten more came during a six-month span from late 2008 to early 2009. There hasn’t been one since.
Posted by Eddy Elfenbein on April 14th, 2013 at 7:01 pm
The information in this blog post represents my own opinions and does not contain a recommendation for any particular security or investment. I or my affiliates may hold positions or other interests in securities mentioned in the Blog, please see my Disclaimer page for my full disclaimer.
-
 Eddy Elfenbein is a Washington, DC-based speaker, portfolio manager and editor of the blog Crossing Wall Street. His Buy List has beaten the S&P 500 over the last 20 years. (more)
-
Archives