The 2013 Buy List
The 2013 trading year has come to a close, and it was a great year for Wall Street and our Buy List.
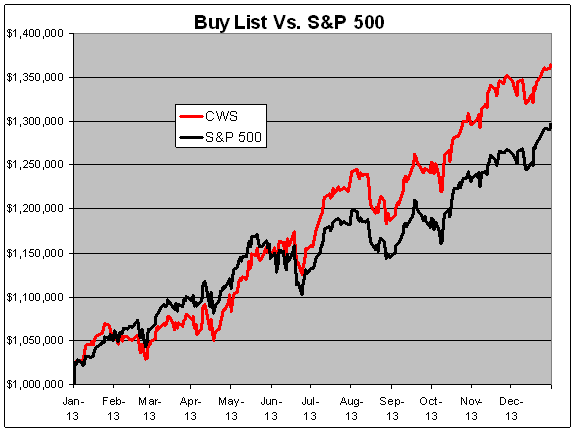
For the year, our Buy List gained 36.42%. Including dividends, we gained 38.48%. This was the seventh year in a row in which we beat the S&P 500.
The S&P 500 gained 29.60%. Including dividends, the index gained 32.39%. The dividend yield of our Buy List was 1.51%. For the S&P 500, it was 2.15%. The Buy List’s “beta” was 1.0067.
All 20 stocks on the Buy List rose this year. The #1 performer was Moog ($MOG-A) which gained 65.59%. The worst was Oracle ($ORCL) which gained 14.83%.
Over the eight-year history of our Buy List, our total compounded gain, including dividends, is 124.71%. For the S&P 500, the total return is 75.62%.
I’ll restate the rules of the Buy List. I choose a portfolio of 20 stocks at the beginning of the year. After that, the Buy List is locked for the year and I can’t make any changes until the following year. For tracking purposes, I assume that the Buy List is a $1 million portfolio equally divided among the 20 stocks. You can check the performance of the Buy List anytime at our Buy List page.
My goal is to show investors that by choosing stocks wisely and by sticking with high-quality stocks, they can beat the market—and that’s exactly what we’ve done.
Here’s how each stock performed:
| Stock |
Shares |
12/31/2012 |
Beginning |
12/31/2013 |
Ending |
Profit/Loss |
| AFL |
941.2651 |
$53.12 |
$50,000.00 |
$66.80 |
$62,876.51 |
25.75% |
| BBBY |
894.2944 |
$55.91 |
$50,000.00 |
$80.30 |
$71,811.84 |
43.62% |
| CA |
2,274.7953 |
$21.98 |
$50,000.00 |
$33.65 |
$76,546.86 |
53.09% |
| CTSH |
676.7731 |
$73.88 |
$50,000.00 |
$100.98 |
$68,340.55 |
36.68% |
| BCR |
511.5613 |
$97.74 |
$50,000.00 |
$133.94 |
$68,518.52 |
37.04% |
| DTV |
996.8102 |
$50.16 |
$50,000.00 |
$69.06 |
$68,839.71 |
37.68% |
| FDS |
567.7947 |
$88.06 |
$50,000.00 |
$108.58 |
$61,651.15 |
23.30% |
| FISV |
1,265.3422 |
$39.515 |
$50,000.00 |
$59.05 |
$74,718.46 |
49.44% |
| F |
3,861.0039 |
$12.95 |
$50,000.00 |
$15.43 |
$59,575.29 |
19.15% |
| HRS |
1,021.2418 |
$48.96 |
$50,000.00 |
$69.81 |
$71,292.89 |
42.59% |
| JPM |
1,137.1390 |
$43.97 |
$50,000.00 |
$58.48 |
$66,499.89 |
33.00% |
| MDT |
1,218.9176 |
$41.02 |
$50,000.00 |
$57.39 |
$69,953.68 |
39.91% |
| MSFT |
1,871.9581 |
$26.71 |
$50,000.00 |
$37.41 |
$70,029.95 |
40.06% |
| MOG-A |
1,218.6205 |
$41.03 |
$50,000.00 |
$67.94 |
$82,793.08 |
65.59% |
| NICK |
4,032.2581 |
$12.40 |
$50,000.00 |
$15.74 |
$63,467.74 |
26.94% |
| ORCL |
1,500.6002 |
$33.32 |
$50,000.00 |
$38.26 |
$57,412.96 |
14.83% |
| ROST |
924.3853 |
$54.09 |
$50,000.00 |
$74.93 |
$69,264.19 |
38.53% |
| SYK |
912.0759 |
$54.82 |
$50,000.00 |
$75.14 |
$68,533.38 |
37.07% |
| WFC |
1,462.8438 |
$34.18 |
$50,000.00 |
$45.40 |
$66,413.11 |
32.83% |
| WEX |
663.3939 |
$75.37 |
$50,000.00 |
$99.03 |
$65,695.90 |
31.39% |
| Total |
|
|
$1,000,000.00 |
|
$1,364,235.66 |
36.42% |
Note that Fiserv split 2-for-1 on December 17.
Here’s how the Buy List performed throughout the year:
Posted by Eddy Elfenbein on December 31st, 2013 at 6:04 pm
The information in this blog post represents my own opinions and does not contain a recommendation for any particular security or investment. I or my affiliates may hold positions or other interests in securities mentioned in the Blog, please see my Disclaimer page for my full disclaimer.
-
 Eddy Elfenbein is a Washington, DC-based speaker, portfolio manager and editor of the blog Crossing Wall Street. His Buy List has beaten the S&P 500 over the last 20 years. (more)
-
Archives