Investing By Day of the Month
Is there a monthly pattern to the stock market?
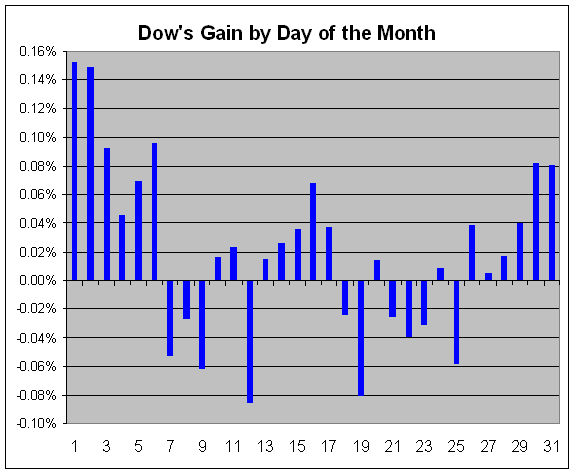
To find out, I took the entire history of the Dow — all 32,000 data points — and broke down how the Dow has performed by each day of the month. Here are my results:
| Day of the Month |
Count |
Gain/Loss |
| 1 |
983 |
0.153% |
| 2 |
1032 |
0.149% |
| 3 |
1045 |
0.092% |
| 4 |
965 |
0.045% |
| 5 |
1035 |
0.069% |
| 6 |
1062 |
0.096% |
| 7 |
1057 |
-0.053% |
| 8 |
1084 |
-0.027% |
| 9 |
1085 |
-0.062% |
| 10 |
1083 |
0.016% |
| 11 |
1065 |
0.023% |
| 12 |
999 |
-0.085% |
| 13 |
1071 |
0.015% |
| 14 |
1081 |
0.026% |
| 15 |
1086 |
0.036% |
| 16 |
1081 |
0.068% |
| 17 |
1083 |
0.037% |
| 18 |
1081 |
-0.024% |
| 19 |
1078 |
-0.081% |
| 20 |
1084 |
0.015% |
| 21 |
1071 |
-0.026% |
| 22 |
1023 |
-0.040% |
| 23 |
1065 |
-0.031% |
| 24 |
1057 |
0.009% |
| 25 |
972 |
-0.058% |
| 26 |
1044 |
0.039% |
| 27 |
1068 |
0.005% |
| 28 |
1059 |
0.017% |
| 29 |
1001 |
0.040% |
| 30 |
918 |
0.082% |
| 31 |
605 |
0.080% |
The best days are clustered around the beginning and end of each month. Here’s what the table above looks like in graph form:
Here’s what the performance looks like.
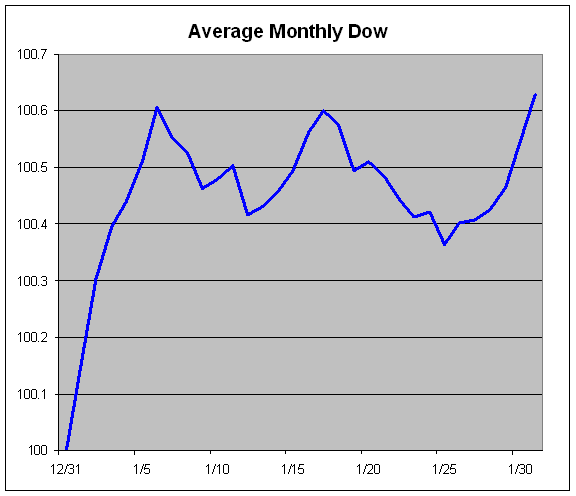
Note that this isn’t literally what the Dow’s average month looks like because the market isn’t open every single day. This is merely a representation of what the cumulative gain looks like based on each day’s average gain or loss.
We can see that the turn of the month is quite good, but the middle of the month sags.
Posted by Eddy Elfenbein on March 24th, 2014 at 1:59 pm
The information in this blog post represents my own opinions and does not contain a recommendation for any particular security or investment. I or my affiliates may hold positions or other interests in securities mentioned in the Blog, please see my Disclaimer page for my full disclaimer.
-
 Eddy Elfenbein is a Washington, DC-based speaker, portfolio manager and editor of the blog Crossing Wall Street. His Buy List has beaten the S&P 500 over the last 20 years. (more)
-
Archives