The 2014 Buy List
The 2014 trading year is officially on the books. It was another profitable year for our Buy List. I want to thank everyone for your support. We again showed that a set-and-forget portfolio of high-quality stocks can do well.
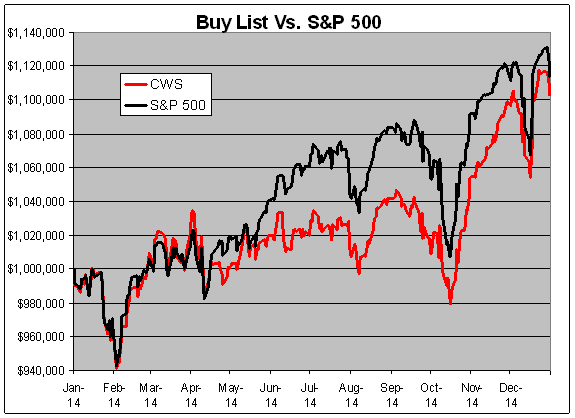
Here are the final numbers. For the year, our Buy List gained 10.26%. Including dividends, we were up 11.80%.
Unfortunately, we were beaten out by the S&P 500, but it was close. For 2014, the S&P 500 gained 11.39% and 13.69% when you include dividends. The return from dividends for our Buy List was 1.39% while it was 2.06% for the S&P 500. This was the first time since 2006 that the S&P 500 outperformed our Buy List. For those who care about such things, the Buy List’s “beta” was 0.9361.
Nine of our Buy List stocks were up more than 20%. There was nearly a four-way tie for our top-performing stock of the year. Ultimately, Medtronic ($MDT) edged out Ross Stores ($ROST) 25.81% to 24.80%, while DirecTV ($DTV) and Stryker ($SYK) were right behind tied at 25.54%. Fifteen of our 20 stocks made money last year. The biggest loser was IBM ($IBM) which lost 14.46%.
Over the nine-year history of our Buy List, our total compounded gain, including dividends, is 151.28%. For the S&P 500, the nine-year total return is 99.66%.
The chart below details the Buy List’s performance. I’ve listed each stock, along with the number of shares and the starting and ending prices. For tracking purposes, I assume the Buy List is a $1 million portfolio that starts equally divided among the 20 stocks.
| Stock |
Shares |
12/31/2013 |
Beginning |
12/31/2014 |
Ending |
Profit/Loss |
| AFL |
748.5030 |
$66.80 |
$50,000.00 |
$61.09 |
$45,726.05 |
-8.55% |
| BBBY |
622.6650 |
$80.30 |
$50,000.00 |
$76.17 |
$47,428.39 |
-5.14% |
| CA |
1,485.8841 |
$33.65 |
$50,000.00 |
$30.45 |
$45,245.17 |
-9.51% |
| CTSH |
990.2952 |
$50.49 |
$50,000.00 |
$52.66 |
$52,148.95 |
4.30% |
| BCR |
373.3015 |
$133.94 |
$50,000.00 |
$166.62 |
$62,199.50 |
24.40% |
| DTV |
724.0081 |
$69.06 |
$50,000.00 |
$86.70 |
$62,771.50 |
25.54% |
| EBAY |
911.2448 |
$54.87 |
$50,000.00 |
$56.12 |
$51,139.06 |
2.28% |
| ESRX |
711.8451 |
$70.24 |
$50,000.00 |
$84.67 |
$60,271.92 |
20.54% |
| FISV |
846.7401 |
$59.05 |
$50,000.00 |
$70.97 |
$60,093.14 |
20.19% |
| F |
3,240.4407 |
$15.43 |
$50,000.00 |
$15.50 |
$50,226.83 |
0.45% |
| IBM |
266.5671 |
$187.57 |
$50,000.00 |
$160.44 |
$42,768.03 |
-14.46% |
| MCD |
515.3045 |
$97.03 |
$50,000.00 |
$93.70 |
$48,284.03 |
-3.43% |
| MDT |
871.2319 |
$57.39 |
$50,000.00 |
$72.20 |
$62,902.94 |
25.81% |
| MSFT |
1,336.5410 |
$37.41 |
$50,000.00 |
$46.45 |
$62,082.33 |
24.16% |
| MOG-A |
735.9435 |
$67.94 |
$50,000.00 |
$74.03 |
$54,481.90 |
8.96% |
| ORCL |
1,306.8479 |
$38.26 |
$50,000.00 |
$44.97 |
$58,768.95 |
17.54% |
| QCOM |
673.4007 |
$74.25 |
$50,000.00 |
$74.33 |
$50,053.87 |
0.11% |
| ROST |
667.2895 |
$74.93 |
$50,000.00 |
$94.26 |
$62,898.71 |
25.80% |
| SYK |
665.4245 |
$75.14 |
$50,000.00 |
$94.33 |
$62,769.49 |
25.54% |
| WFC |
1,101.3216 |
$45.40 |
$50,000.00 |
$54.82 |
$60,374.45 |
20.75% |
| Total |
|
|
$1,000,000 |
|
$1,102,635.22 |
10.26% |
Note that Cognizant Technologies Solutions ($CTSH) split 2-for-1 on March 10.
Here’s how the Buy List performed throughout the year.
Posted by Eddy Elfenbein on December 31st, 2014 at 7:20 pm
The information in this blog post represents my own opinions and does not contain a recommendation for any particular security or investment. I or my affiliates may hold positions or other interests in securities mentioned in the Blog, please see my Disclaimer page for my full disclaimer.
-
 Eddy Elfenbein is a Washington, DC-based speaker, portfolio manager and editor of the blog Crossing Wall Street. His Buy List has beaten the S&P 500 over the last 20 years. (more)
-
Archives