CWS Market Review – April 1, 2016
“As in roulette, the same is true of the stock trader, who will find
that the expense of trading weighs the dice heavily against him.”
– Benjamin Graham
The first quarter of 2016 is officially on the books, and it was one of the more dramatic quarters in Wall Street history. Imagine if you hadn’t followed the market one iota since the close of business on New Year’s Eve. Like Rip Van Winkle, you fell asleep.
Then, three months later, you suddenly awoke and asked how the market did. I’d tell you that the S&P 500 gained 0.77%, and that with dividends, it’s up 1.35% YTD. You’d probably assume it was a flat and boring market.
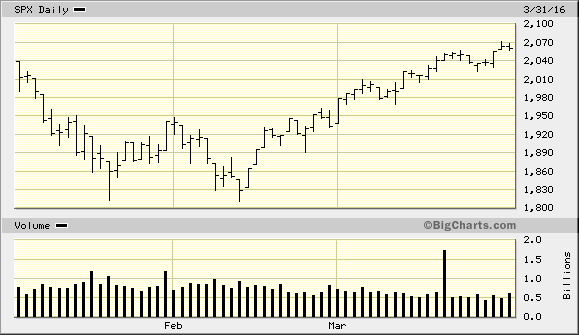
In reality, it was anything but. At its low, on February 11, the S&P 500 was down more than 11.4% for the year. That made it one of the worst starts to a year in Wall Street history. Then, suddenly, the bulls took charge. The S&P 500 soared 12.8% off its low. This was the greatest quarterly comeback in the index’s history.
(I should point out that I appeared on Bloomberg on February 12. I’m not saying that I caused the market to turn around all by myself. Obviously, there may have been some minor factors at play. Who really knows?)
The first quarter has been a tale of two markets, and it was also a good lesson in the futility of trying to time Wall Street. I’ll give you a good example: Wabtec (WAB), one of my favorite stocks, went from being a 15% loser on the year to being an 11.5% winner. This all happened in one quarter!
In this week’s CWS Market Review, we’ll take a closer look at the frenetic first quarter. I’ll also preview the upcoming earnings report from Bed Bath & Beyond (BBBY). Later on, I’ll look at the Buy List’s performance so far. We’re losing to the market, but not by much. Also, Barron’s had some nice things to say about Cerner (CERN), one of our quieter stocks. But first, let’s look at the market’s dramatic comeback.
The Greatest Quarterly Comeback in History
This was a jarring quarter for many investors. At first, folks were heading for the hills. During January, investors pulled nearly $5 billion out of global equity mutual funds. Since then, they’ve plowed nearly $7.5 billion back. Stocks are suddenly popular again.
Ryan Detrick notes a fun stat. Over the past five quarters, the S&P 500 has gained a grand total of 0.84 points. Yet, it moved a total of 4,735 points to get there. In other words, so much of the market’s day-to-day volatility is meaningless. Maybe Rip Van Winkle was on to something.
Much of the market’s direction-changing has been due to the Federal Reserve. Or more accurately, it’s been the factors that have come to influence the Fed. In December, the Fed raised interest rates for the first time in nine years. The Fed went out of its way to telegraph its plans, and the market still flopped. At the start of the year, the Fed was planning to raise interest rates four times in 2016, and another four times in 2017.
The market thought that was too much too soon, and stocks started to fall. It looked as if the S&P 500 would get its first 20% decline in years. Bank stocks were in especially bad shape. But the Fed got the word and gradually started to backtrack on it plans.
On February 10, Chairwoman Yellen testified before the House Financial Services Committee and sounded noticeably more concerned about the economy. Central bankers are trained to speak in bland jargony phrases, so when Yellen said, “Financial conditions in the United States have recently become less supportive of growth,” you knew something was up.
Investors took the cue that the Fed was no longer in a hurry to raise interest rates. The S&P 500 broke the “Tchaikovsky Low” of 1,812 and started to rally. The market got more good news when the Fed passed on raising rates at its mid-March meeting. The FOMC also released a “dovish” policy statement, meaning it was less concerned about the threat of inflation.
What’s also struck me has been the remarkable decline in volatility. It’s interesting how the arrival of a volatile market is considered an event. But when volatility fades, no one seems to notice. In my opinion, that’s a big mistake.
The S&P 500 has now run 13 straight days without closing up or down by more than 1%. Before then, the market had been averaging 1% days more than every other day. That’s a stunning change. In fact, seven of the 13 days have had changes of less than 0.2%. In the S&P 500 chart above, notice how the daily high-low bars get progressively narrower. Bottom line: Things are a heckuva lot calmer these days.
We got more good news this week from the Fed when Janet Yellen made some encouraging remarks. I think the best way to look at this is by calling it a “stealth rate cut.” Yellen knows that she can influence the market more easily with her words than with her actions. After all, the “C” in FOMC stands for “committee,” so she needs to get her colleagues to go along with her policies.
On Tuesday, she spoke before the Economic Club of New York and said that the uncertain economic environment justified a slower path towards interest-rate increases. Of course, this had been implied at the March meeting, but now we’re hearing it more clearly.
The stock market responded by rallying on Tuesday and Wednesday. The S&P 500 got to its highest point all year. Many defensive sectors broke out to new 52-week highs. Interestingly, stocks had their first departure from oil in several months. Since October, the movement in stocks has been closely mirrored by a move in oil. That’s probably a case of the market serving as a proxy for consumer demand. However, the recent bump up in stock prices came as the price of oil fell. It’s not a major departure, and we can’t say if it’s the beginning of a trend, but it’s certainly noticeable. I suspect it’s bad news for oil bulls, especially with a big OPEC meeting coming in two weeks.
The futures market reacted quickly to Janet’s words. Not that long ago, investors had been expecting the Fed to move. Now, not so much. The futures market is now about evenly divided on whether there will be a rate hike in November.
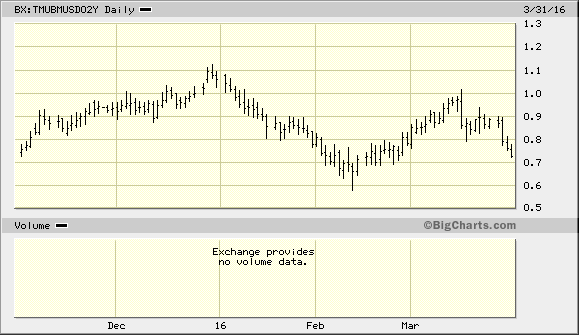
In the bond pits, the yield on the two-year Treasury is down to 0.73% (see above). In the middle of March, it was at 0.98%. Here’s a fascinating stat: In January, the two-year Treasury was yielding 42 basis points more than the one-year Treasury. Now that spread is down to 14 basis points. What that means is that the market had been expecting a series of rate hikes next year. Now it’s not so sure.
As I’ve been saying, this is good news for investors. I can’t predict where stocks will go, but we can certainly recognize that the math is on the side of stocks. The dividend yield of the S&P 500 is more than 30 basis points better than the yield on the 10-year Treasury. Many individual stocks are yielding even more. Look for another dividend hike from Microsoft later this month.
Some of my favorite Buy List stocks at the moment include Signature Bank (SBNY) and Biogen (BIIB). I also like Cognizant Technology Solutions (CTSH). This week, I’m raising my Buy Below on Cognizant to $65 per share. Now let’s look at how the Buy List did during Q1.
Our Buy List YTD
Unfortunately, our Buy List trailed the overall market for Q1, but not by much. I’m not trying to put a happy spin on the numbers; we’re only slightly behind the market. Through the first three months of this year, our Buy List is down 0.66%, while the S&P 500 gained 0.77%. With dividends, our Buy List is down 0.30%, while the S&P 500 is up 1.43%. That’s a pretty small deficit, and I believe we can easily make it up before the year is done.
Interestingly, most of our stocks (11 of 20) are actually beating the S&P 500. The problem is, our losers have been losing more than our winners are winning. With investing, that’s not uncommon. Our top performer so far is Stryker, with a 15% YTD gain. Fiserv, Wabtec, HEICO and Hormel Foods fill out the Top 5.
Our two big losers are Alliance Data Systems (ADS), which is down 20.4%, and Express Scripts (ESRX), which is down 21.4%. You may recall that in January, ADS lost 19% in a single day. That’s a big part of our deficit right there. Still, I think our portfolio is poised for a strong earnings season, which begins later this month. Speaking of earnings, we have an off-cycle report coming our way next week from Bed Bath & Beyond.
Earnings Preview for Bed Bath & Beyond
I know I surprised a number of readers when I decided to keep Bed Bath & Beyond (BBBY) on this year’s Buy List, but I’m not sorry I did (it’s currently up 2.88% YTD). The home-furnishings store had a horrible 2015, and it seemed like all the news was bad.
I wouldn’t call our strategy straight “value investing,” but I won’t turn down a good bargain. Last year, BBBY fell more than 36% and closed the year at $48.25 per share. By February, the stock fell below $42 per share.
Bed Bath will report its fiscal Q4 earnings on Wednesday, April 6. This will be for December, January and February. Earlier this year, BBBY said they see Q4 earnings ranging between $1.72 and $1.86 per share. While that’s not great, it’s not that bad either. For comparison, BBBY made $1.80 per share in last year’s Q4.
The company has already made $3.19 per share for the first three quarters of its fiscal year, so its guidance works out to a full-year range of $4.91 to $5.05 per share. That’s compared with $5.03 per share last year. Basically, the company has been having a flat year, which is also what much of the rest of the corporate world has had. BBBY has also been buying back lots of shares, which has aided EPS growth. Their diluted share count is down 11% in the last year.
I’ll be curious to hear if they give a profit outlook for the current fiscal year. I think they can earn between $5 and $5.30 per share. That still means the stock is going for less than 10 times earnings. That’s not a bad deal.
Barron’s Gives Cerner Some Love
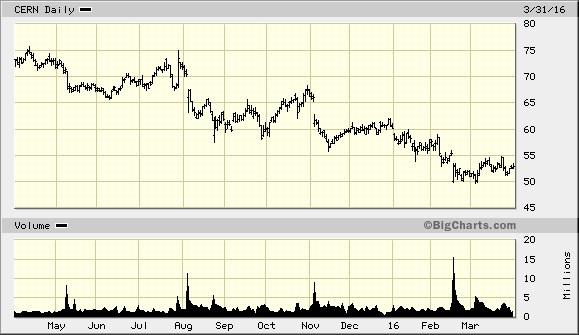
Cerner (CERN) is one of my favorite new stocks this year, but I’m afraid their business, healthcare IT, is a bit boring. The stock hasn’t done very well in the past year, but I have high hopes for it.
In this weekend’s Barron’s, Vito J. Racanelli had some nice things to say about Cerner. The following is an extended excerpt from the article, which I thought was important enough to pass along. Racanelli first notes the weakness in the stock, but adds:
Nevertheless, the company’s still-robust earnings visibility, a hefty $14.2 billion backlog, and ongoing demand to reduce the country’s rampaging health-care costs, suggest that Cerner could turn out to be a quiet winner for long-term-oriented investors.
A return to a higher P/E isn’t necessary for the stock to rise by as much as a third in the next 24 months. Cerner needs to maintain its impressive track record of double-digit percentage growth in sales and profit.
With a $17.5 billion market capitalization, this North Kansas City, Mo.-based company sells and services software and systems, both clinical and financial, for 20,000 healthcare organizations around the world. Its clients include hospitals, clinics, physician practices, laboratories, and retail pharmacies.
Cerner is in a stable industry, and its big backlog provides predictability, says Tom Weary, chief investment officer at Lau Associates in Delaware. There’s a high economic moat, too, because Cerner’s installations have high switching costs and come with years of maintenance and support contracts, the latter totaling nearly a quarter of sales.
Racanelli then breaks down some numbers:
Cerner sports a decade-long record of 15% sales growth and 20%-plus growth in earnings per share. Perhaps sales growth has slowed to 10%, and EPS growth to 15%. But both are growing much faster than the broad market.
Given its current size, Cerner might not be able to grow as fast as it once did, but the P/E discounts a slower pace of growth already, and probably more. The P/E doesn’t have to expand for the stock to work, Weary says.
In the past 12 months, analysts’ 2016 consensus earnings estimate has fallen 7%, to $2.34, for a P/E of 22 times. That’s the lowest P/E since the financial crisis of 2008-09, a period in which Cerner increased sales and EPS. Applying the current P/E to 2017 consensus earnings of $2.70 a share yields a $60 target price, up 15%. Doing the same with the 2018 consensus estimate of $3.13 a share puts the stock at $69, up 34%.
Shares of CERN closed Thursday at $52.96. Cerner’s Q1 earnings report will probably come out in late April. The company said they expect Q1 revenue between $1.15 billion and $1.2 billion, and EPS between 52 and 54 cents. For all of 2016, Cerner sees revenue ranging between $4.9 billion and $5.1 billion, and EPS between $2.30 and $2.40. Cerner has a solid business.
That’s all for now. The March jobs report is due out later this morning. It’s interesting how much the jobs report has declined in influence, now that the Fed finally raised rates. On Wednesday of next week, the Fed will release the minutes of its mid-March meeting. It will be interesting to hear the details of what they discussed. Next week, we’ll also get reports on factory orders, trade and consumer credit. Be sure to keep checking the blog for daily updates. I’ll have more market analysis for you in the next issue of CWS Market Review!
– Eddy
Posted by Eddy Elfenbein on April 1st, 2016 at 7:08 am
The information in this blog post represents my own opinions and does not contain a recommendation for any particular security or investment. I or my affiliates may hold positions or other interests in securities mentioned in the Blog, please see my Disclaimer page for my full disclaimer.
- Tweets by @EddyElfenbein
-
-
Archives
- April 2024
- March 2024
- February 2024
- January 2024
- December 2023
- November 2023
- October 2023
- September 2023
- August 2023
- July 2023
- June 2023
- May 2023
- April 2023
- March 2023
- February 2023
- January 2023
- December 2022
- November 2022
- October 2022
- September 2022
- August 2022
- July 2022
- June 2022
- May 2022
- April 2022
- March 2022
- February 2022
- January 2022
- December 2021
- November 2021
- October 2021
- September 2021
- August 2021
- July 2021
- June 2021
- May 2021
- April 2021
- March 2021
- February 2021
- January 2021
- December 2020
- November 2020
- October 2020
- September 2020
- August 2020
- July 2020
- June 2020
- May 2020
- April 2020
- March 2020
- February 2020
- January 2020
- December 2019
- November 2019
- October 2019
- September 2019
- August 2019
- July 2019
- June 2019
- May 2019
- April 2019
- March 2019
- February 2019
- January 2019
- December 2018
- November 2018
- October 2018
- September 2018
- August 2018
- July 2018
- June 2018
- May 2018
- April 2018
- March 2018
- February 2018
- January 2018
- December 2017
- November 2017
- October 2017
- September 2017
- August 2017
- July 2017
- June 2017
- May 2017
- April 2017
- March 2017
- February 2017
- January 2017
- December 2016
- November 2016
- October 2016
- September 2016
- August 2016
- July 2016
- June 2016
- May 2016
- April 2016
- March 2016
- February 2016
- January 2016
- December 2015
- November 2015
- October 2015
- September 2015
- August 2015
- July 2015
- June 2015
- May 2015
- April 2015
- March 2015
- February 2015
- January 2015
- December 2014
- November 2014
- October 2014
- September 2014
- August 2014
- July 2014
- June 2014
- May 2014
- April 2014
- March 2014
- February 2014
- January 2014
- December 2013
- November 2013
- October 2013
- September 2013
- August 2013
- July 2013
- June 2013
- May 2013
- April 2013
- March 2013
- February 2013
- January 2013
- December 2012
- November 2012
- October 2012
- September 2012
- August 2012
- July 2012
- June 2012
- May 2012
- April 2012
- March 2012
- February 2012
- January 2012
- December 2011
- November 2011
- October 2011
- September 2011
- August 2011
- July 2011
- June 2011
- May 2011
- April 2011
- March 2011
- February 2011
- January 2011
- December 2010
- November 2010
- October 2010
- September 2010
- August 2010
- July 2010
- June 2010
- May 2010
- April 2010
- March 2010
- February 2010
- January 2010
- December 2009
- November 2009
- October 2009
- September 2009
- August 2009
- July 2009
- June 2009
- May 2009
- April 2009
- March 2009
- February 2009
- January 2009
- December 2008
- November 2008
- October 2008
- September 2008
- August 2008
- July 2008
- June 2008
- May 2008
- April 2008
- March 2008
- February 2008
- January 2008
- December 2007
- November 2007
- October 2007
- September 2007
- August 2007
- July 2007
- June 2007
- May 2007
- April 2007
- March 2007
- February 2007
- January 2007
- December 2006
- November 2006
- October 2006
- September 2006
- August 2006
- July 2006
- June 2006
- May 2006
- April 2006
- March 2006
- February 2006
- January 2006
- December 2005
- November 2005
- October 2005
- September 2005
- August 2005
- July 2005
 Eddy Elfenbein is a Washington, DC-based speaker, portfolio manager and editor of the blog Crossing Wall Street. His