The 2/10’s Track Record
There are lots of good metrics that tell you how well the economy did. There are very few that tell you how well the economy is doing. But there are almost none that tell you how well the economy is about to do.
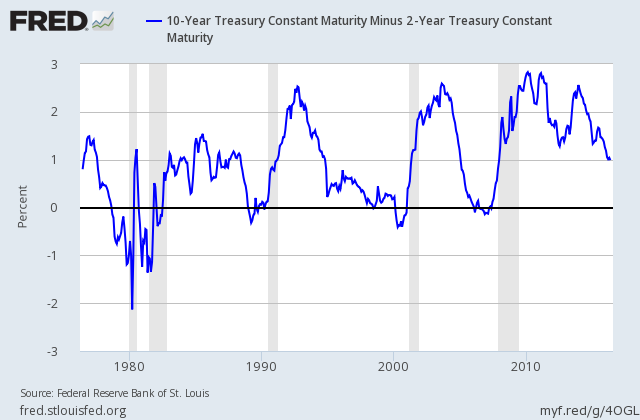
One example of the last one is the spread between the 2- and 10-year Treasury yields. When the spread has turned negative, it’s been a fairly good indicator that a recession is close by.
Check out this chart showing the 2/10 spread along with the recession periods (the gray shaded areas).
That’s not bad. Compared with the Fed or Wall Street, it’s outstanding.
I wanted to run the numbers and see how well the 2/10 spread did. Here’s the 2/10 spread versus the number of times the economy was in recession 12 months in the future.
| Lower |
Upper |
Recession Months |
Total Months |
| Under |
-0.50 |
13 |
24 |
| -0.49 |
-0.01 |
22 |
49 |
| 0.00 |
0.25 |
8 |
47 |
| 0.26 |
0.50 |
1 |
46 |
| 0.51 |
0.75 |
4 |
39 |
| 0.76 |
1.00 |
2 |
39 |
| 1.01 |
1.50 |
3 |
85 |
| 1.51 |
2.00 |
3 |
56 |
| 2.01 |
Over |
0 |
83 |
If the chart doesn’t make sense, here’s what I did: I sorted each month by its 2/10 spread and then I sorted the months into nine different buckets. (I’ve listed the upper and lower bounds on the table.) Next I looked exactly 12 months into the future and counted the total number of months and the number of months the economy was officially in recession.
In short, the lower the spread, the greater the odds of a recession. The tipping point is about 0.12%. Right now, the spread is at 0.92.
Posted by Eddy Elfenbein on June 20th, 2016 at 10:06 pm
The information in this blog post represents my own opinions and does not contain a recommendation for any particular security or investment. I or my affiliates may hold positions or other interests in securities mentioned in the Blog, please see my Disclaimer page for my full disclaimer.
-
 Eddy Elfenbein is a Washington, DC-based speaker, portfolio manager and editor of the blog Crossing Wall Street. His Buy List has beaten the S&P 500 over the last 20 years. (more)
-
Archives