The 2016 Buy List
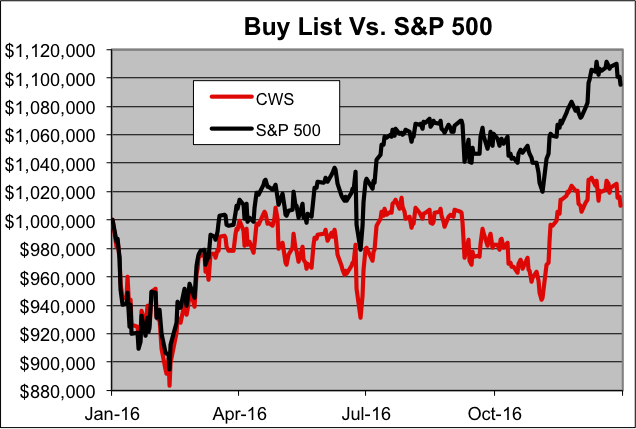
The 2016 trading year is on the books! For 2016, the S&P 500 gained 9.54%, while our Buy List gained 0.99%. Although we did make a profit, we trailed the broader market. This was only the second time in the last decade in which we lost to the market.
Including dividends, the S&P 500 gained 11.96% this year, while our Buy List gained 2.17%.
Over the long haul, we’re still doing quite well. Over the last 11 years, the total compounded gain for the Buy List is 169.39%, compared with 126.63% for the S&P 500.
Our biggest winner this year was HEICO (HEI) which gained nearly 42%. Stryker (SYK) was a distant second with a 28.91% gain. Stericycle (SRCL) was our biggest loser with a loss of 36.12%. Next came Cerner (CERN) and Express Scripts (ESRX) which both lost just over 21%.
For people who care about such things, the “beta” of our Buy List in 2016 was 1.0164. The correlation of the daily changes of the Buy List to the changes of the S&P 500 was 92.6%.
The chart below details the Buy List’s performance. I’ve listed each stock, along with the number of shares and the starting and ending prices. For tracking purposes, I assume the Buy List is a $1 million portfolio that starts equally divided among the 20 stocks.
| Stock | Shares | 12/31/15 | Beginning | 12/30/16 | Ending | Profit/Loss |
| ADS | 180.7861 | $276.57 | $50,000.00 | $228.50 | $41,309.62 | -17.38% |
| AFL | 834.7245 | $59.90 | $50,000.00 | $69.60 | $58,096.83 | 16.19% |
| BBBY | 1,036.2694 | $48.25 | $50,000.00 | $40.64 | $42,113.99 | -15.77% |
| BCR | 263.9358 | $189.44 | $50,000.00 | $224.66 | $59,295.82 | 18.59% |
| BIIB | 163.2120 | $306.35 | $50,000.00 | $283.58 | $46,283.66 | -7.43% |
| CERN | 830.9789 | $60.17 | $50,000.00 | $47.37 | $39,363.47 | -21.27% |
| CTSH | 833.0556 | $60.02 | $50,000.00 | $56.03 | $46,676.11 | -6.65% |
| ESRX | 572.0169 | $87.41 | $50,000.00 | $68.79 | $39,349.04 | -21.30% |
| F | 3,548.6160 | $14.09 | $50,000.00 | $12.13 | $43,044.71 | -13.91% |
| FISV | 546.6871 | $91.46 | $50,000.00 | $106.28 | $58,101.90 | 16.20% |
| HEI | 919.7940 | $54.36 | $50,000.00 | $77.15 | $70,962.11 | 41.92% |
| HRL | 1,264.5422 | $39.54 | $50,000.00 | $34.81 | $44,018.71 | -11.96% |
| MSFT | 901.2257 | $55.48 | $50,000.00 | $62.14 | $56,002.16 | 12.00% |
| ROST | 929.1953 | $53.81 | $50,000.00 | $65.60 | $60,955.21 | 21.91% |
| SBNY | 326.0090 | $153.37 | $50,000.00 | $150.20 | $48,966.55 | -2.07% |
| SNA | 291.6642 | $171.43 | $50,000.00 | $171.27 | $49,953.33 | -0.09% |
| SRCL | 414.5937 | $120.60 | $50,000.00 | $77.04 | $31,940.30 | -36.12% |
| SYK | 537.9815 | $92.94 | $50,000.00 | $119.81 | $64,455.56 | 28.91% |
| WAB | 703.0371 | $71.12 | $50,000.00 | $83.02 | $58,366.14 | 16.73% |
| WFC | 919.7940 | $54.36 | $50,000.00 | $55.11 | $50,689.85 | 1.38% |
| Total | $1,000,000.00 | $1,009,945.07 | 0.99% |
Note that Hormel Foods (HRL) split 2-for-1 on February 10.
Here’s how the Buy List performed throughout the year:
Here’s the data behind the dividend-adjusted returns. I’ve listed each stock’s beginning price, ending price and dividend-adjusted starting price. My source for dividend-adjusted prices is StockCharts.
 Eddy Elfenbein is a Washington, DC-based speaker, portfolio manager and editor of the blog Crossing Wall Street. His