The 2017 Buy List
The 2017 trading year is on the books! For 2017, the S&P 500 gained 19.42% while our Buy List gained 20.58%. However, if we include dividends (and total return is what really counts), then the S&P 500 gained 21.83% while out Buy List gained 21.79%.
In other words, we lost to the market by 0.04%! That comes to down to one penny over the whole year for every $25 invested.
I’m very competitive, so I hate losing to the market, even if it’s by a teeny amount. I will, however, add a few words in my defense. This was a difficult market to beat because a small number of very large companies did very well. That tended to distort the market’s overall return. About 55% of the stocks in the S&P 500 failed to beat the S&P 500.
Still, over the long haul, our Buy List has done very well. Over the last 12 years, the total compounded gain for the Buy List is 228.09%, compared with 176.11% for the S&P 500.
Our biggest winner this year was Moody’s (MCO), which gained more than 56%. HEICO (HEI) came in second. HEI was our #1 performer in 2016. Twenty-one of our 25 stocks finished in the black in 2017. Our biggest loser was Signature Bank (SBNY), which lost 8.6%.
For people who care about such things, the “beta” of our Buy List in 2017 was 1.0092. The correlation of the daily changes of the Buy List to the changes of the S&P 500 was 83.6%.
The chart below details the Buy List’s performance. I’ve listed each stock along with the number of shares and the starting and ending prices. For tracking purposes, I assume the Buy List is a $1 million portfolio that starts out equally divided among the 25 stocks.
| Stock | Shares | 12/30/16 | Beginning | 12/29/17 | Ending | Profit/Loss |
| AFL | 574.7126 | $69.60 | $40,000 | $87.78 | $50,448.27 | 26.12% |
| ADS | 175.0547 | $228.50 | $40,000 | $253.48 | $44,372.87 | 10.93% |
| AXTA | 1470.5882 | $27.20 | $40,000 | $32.36 | $47,588.23 | 18.97% |
| CERN | 844.4163 | $47.37 | $40,000 | $67.39 | $56,905.21 | 42.26% |
| CNK | 1042.7529 | $38.36 | $40,000 | $34.82 | $36,308.66 | -9.23% |
| CBPX | 1731.6017 | $23.10 | $40,000 | $28.15 | $48,744.59 | 21.86% |
| CTSH | 713.9033 | $56.03 | $40,000 | $71.02 | $50,701.41 | 26.75% |
| BCR | 178.0468 | $224.66 | $40,000 | $331.24 | $58,976.22 | 47.44% |
| DHR | 513.8746 | $77.84 | $40,000 | $92.82 | $47,697.84 | 19.24% |
| ESRX | 581.4799 | $68.79 | $40,000 | $74.64 | $43,401.66 | 8.50% |
| FISV | 376.3643 | $106.28 | $40,000 | $131.13 | $49,352.65 | 23.38% |
| HEI | 648.0881 | $61.72 | $40,000 | $94.35 | $61,147.11 | 52.87% |
| HRL | 1149.0951 | $34.81 | $40,000 | $36.39 | $41,815.57 | 4.54% |
| INGR | 320.1024 | $124.96 | $40,000 | $139.80 | $44,750.32 | 11.88% |
| ICE | 708.9685 | $56.42 | $40,000 | $70.56 | $50,024.82 | 25.06% |
| MSFT | 643.7078 | $62.14 | $40,000 | $85.54 | $55,062.77 | 37.66% |
| MCO | 424.3131 | $94.27 | $40,000 | $147.61 | $62,632.86 | 56.58% |
| ROST | 609.7561 | $65.60 | $40,000 | $80.25 | $48,932.93 | 22.33% |
| RPM | 743.0801 | $53.83 | $40,000 | $52.42 | $38,952.26 | -2.62% |
| SHW | 148.8427 | $268.74 | $40,000 | $410.04 | $61,031.46 | 52.58% |
| SBNY | 266.3116 | $150.20 | $40,000 | $137.26 | $36,553.93 | -8.62% |
| SJM | 312.3536 | $128.06 | $40,000 | $124.24 | $38,806.81 | -2.98% |
| SNA | 233.5494 | $171.27 | $40,000 | $174.30 | $40,707.66 | 1.77% |
| SYK | 333.8619 | $119.81 | $40,000 | $154.84 | $51,695.18 | 29.24% |
| WAB | 481.8116 | $83.02 | $40,000 | $81.43 | $39,233.92 | -1.92% |
| Total | $1,000,000 | $1,205,845.20 |
Note that HEICO (HEI) split 5-for-4 on April 19.
Note on CR Bard (BCR). The company was bought out by Becton Dickinson (BDX). The deal was completed on December 29, the final trading day of the year. For the year-end price, we used the final price for BCR, which was $332.24, although BCR didn’t trade during the day on December 29.
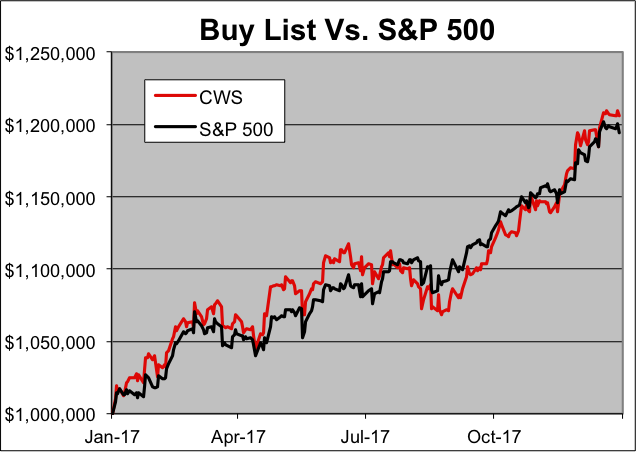
Here’s how the Buy List performed throughout the year:
Here’s the data behind the dividend-adjusted returns. I’ve listed each stock’s beginning price, ending price and dividend-adjusted starting price. My source for dividend-adjusted prices is StockCharts.
 Eddy Elfenbein is a Washington, DC-based speaker, portfolio manager and editor of the blog Crossing Wall Street. His