The 2018 Buy List
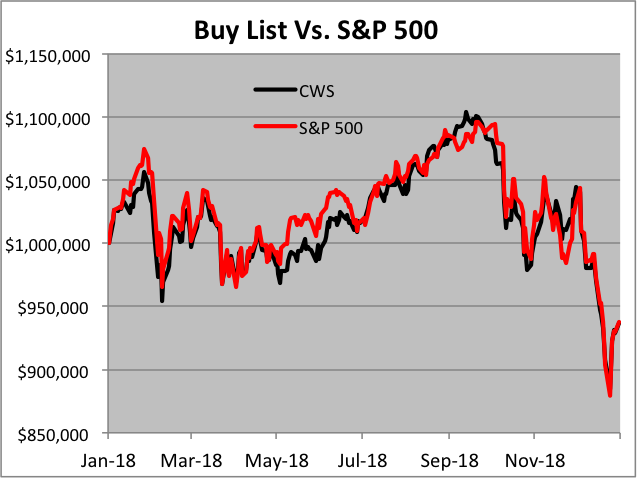
The 2018 trading year is on the books! For 2018, the S&P 500 lost 6.24% while our Buy List lost 6.30%. Including dividends, the S&P 500 lost 4.38% while our Buy List lost 5.11%. So we trailed the overall market, but to be fair, not by much.
Our Buy List fell 3% behind the market by May, but it performed much better since then. Also, we were weighed down by big losses in Carriage Services and Alliance Data Systems.
For the long-term, we’ve done quite well. Over the last 13 years, our Buy List has gained 211.32% while the S&P 500 has gained 164.00%.
Our biggest winner this year was Church & Dwight (CHD) which gained more than 31%. CHD was a new addition to this year’s Buy List. Eleven of our stocks finished positive this year, and 14 of our 25 stocks beat the S&P 500 in terms of price. The problem is that the big losers held us back.
For people who care about such things, the “beta” of our Buy List in 2018 was 0.8085. That’s pretty low for us. The correlation of the daily changes of the Buy List to the changes of the S&P 500 was 93.34%.
The chart below details the Buy List’s performance. I’ve listed each stock along with the number of shares and the starting and ending prices. For tracking purposes, I assume the Buy List is a $1 million portfolio that starts out equally divided among the 25 stocks.
| Stock | Shares | 12/29/17 | Beginning | 12/31/18 | Ending | Profit/Loss |
| AFL | 911.3694 | $43.89 | $40,000.00 | $45.56 | $41,521.99 | 3.80% |
| ADS | 157.8034 | $253.48 | $40,000.00 | $150.08 | $23,683.13 | -40.79% |
| BDX | 186.8635 | $214.06 | $40,000.00 | $225.32 | $42,104.08 | 5.26% |
| CSV | 1,555.8149 | $25.71 | $40,000.00 | $15.50 | $24,115.13 | -39.71% |
| CERN | 593.5599 | $67.39 | $40,000.00 | $52.44 | $31,126.28 | -22.18% |
| CHKP | 386.0259 | $103.62 | $40,000.00 | $102.65 | $39,625.56 | -0.94% |
| CHD | 797.2892 | $50.17 | $40,000.00 | $65.76 | $52,429.74 | 31.07% |
| CTSH | 563.2216 | $71.02 | $40,000.00 | $63.48 | $35,753.31 | -10.62% |
| CBPX | 1,420.9591 | $28.15 | $40,000.00 | $25.45 | $36,163.41 | -9.59% |
| DHR | 430.9416 | $92.82 | $40,000.00 | $103.12 | $44,438.70 | 11.10% |
| FDS | 207.5119 | $192.76 | $40,000.00 | $200.13 | $41,529.36 | 3.82% |
| FISV | 610.0816 | $65.57 | $40,000.00 | $73.49 | $44,834.90 | 12.09% |
| HRL | 1,099.2031 | $36.39 | $40,000.00 | $42.68 | $46,913.99 | 17.28% |
| INGR | 286.1230 | $139.80 | $40,000.00 | $91.40 | $26,151.64 | -34.62% |
| ICE | 566.8934 | $70.56 | $40,000.00 | $75.33 | $42,704.08 | 6.76% |
| SJM | 321.9575 | $124.24 | $40,000.00 | $93.49 | $30,099.81 | -24.75% |
| MCO | 270.9844 | $147.61 | $40,000.00 | $140.04 | $37,948.66 | -5.13% |
| ROST | 498.4424 | $80.25 | $40,000.00 | $83.20 | $41,470.41 | 3.68% |
| RPM | 763.0675 | $52.42 | $40,000.00 | $58.78 | $44,853.11 | 12.13% |
| SHW | 97.5515 | $410.04 | $40,000.00 | $393.46 | $38,382.61 | -4.04% |
| SBNY | 291.4177 | $137.26 | $40,000.00 | $102.81 | $29,960.65 | -25.10% |
| SNA | 229.4894 | $174.30 | $40,000.00 | $145.29 | $33,342.51 | -16.64% |
| SYK | 258.3312 | $154.84 | $40,000.00 | $156.75 | $40,493.42 | 1.23% |
| TMK | 440.9657 | $90.71 | $40,000.00 | $74.53 | $32,865.17 | -17.84% |
| WAB | 491.2195 | $81.43 | $40,000.00 | $70.25 | $34,508.17 | -13.73% |
| Total | $1,000,000.00 | $937,019.81 | -6.30% |
Note that AFLAC (AFL) split 2-for-1 on March 19, and Fiserv (FISV) split 2-for-1 on March 20.
Here’s how the Buy List performed throughout the year:
Here’s the data behind the dividend-adjusted returns. I’ve listed each stock’s beginning price, ending price and dividend-adjusted starting price.
 Eddy Elfenbein is a Washington, DC-based speaker, portfolio manager and editor of the blog Crossing Wall Street. His