CWS Market Review – August 16, 2019
“Don’t gamble; take all your savings and buy some good stock and hold it till it goes up, then sell it. If it don’t go up, don’t buy it.” – Will Rogers
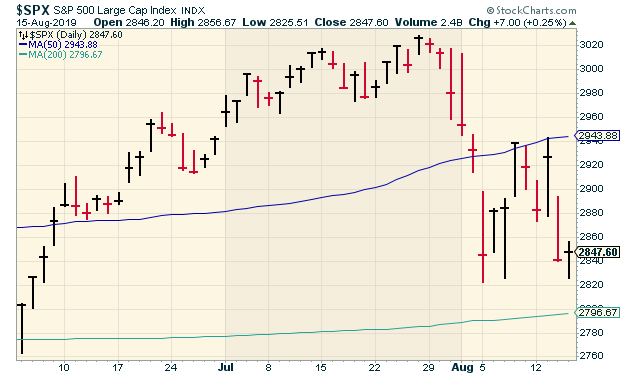
What had been a fairly quiet summer on Wall Street has gotten rather more dramatic recently. On August 5, the Dow plunged 767 points. That was followed by a plunge of 800 points on August 14.
In percentage terms, of course, those drops are barely a scratch, but it’s jarring, especially when compared with the calm market we’ve had. We also had the news this week that the yield curve finally inverted. Specifically, the yield on two-year Treasuries exceeded that of ten-year Treasuries. This event caused a Category 1 freakout among market commenters. I’m surprised FEMA wasn’t called in. The yield curve even got a presidential tweet (in all caps).
This is an odd market. Investors have been gobbling up bonds at a frenetic pace. This week, the yield on the 30-year Treasury dropped to an all-time low, and the Federal Reserve looks to cut rates again. There’s renewed talk that a recession is just around the bend.
First let me say: don’t worry. In this week’s CWS Market Review, I’ll walk you through the mysterious territory of Wall Street and let you know what you should be doing. By the way, our Buy List has been zipping past the market nearly every day recently. We’re on our way to beating the market again this year. But first, let’s look at the great yield curve inversion of 2019.
What an Inverted Yield Curve Means for Us
On Wednesday, the yield curve finally inverted. What does that mean? In plain language, the yield on the two-year Treasury was above that of the ten-year Treasury.
Gotcha, but what does that mean?
In still plainer talk, investors aren’t being paid to take on more risk. Lending your money to Uncle Sam for two years pays you the same as lending for ten. You’re not getting anything for taking on the risk of eight more years. Well, if people aren’t being paid to take on risk, guess what: they won’t.
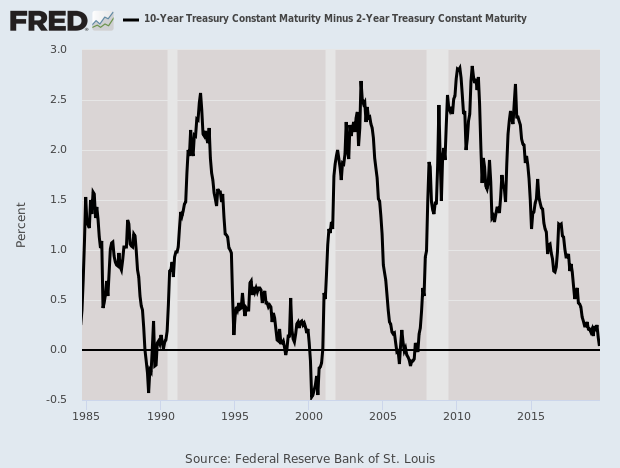
Not taking on risk is not a good thing for the economy. That’s the why the 2/10 Spread has a pretty good track record of predicting recessions. It’s not so much the inversion that’s bad; it’s what it means. By the way, there are lots of ways to measure the yield curve. The 2/10 is just one, but it’s the one in the news.
I want to stress a few notes of caution. Let’s look at the world of economic stats.
Lagging indicators: sure, we got plenty of those.
Coincident indicators: eh, a few.
Leading indicators: not much.
The 2/10 is one. As the saying goes, it’s hard to make predictions, especially about the future.
With the 2/10, we gain a rare example of a forward indicator with a decent track record, but it comes at the expense of timing. Simply put, the world doesn’t automatically explode once the 2/10 gets inverted. It’s more of a dimmer switch than a toggle.
The key is that the 2/10 isn’t bad news itself. The world of finance loves to fetishize numbers. Instead, we should focus on what those numbers represent. An inverted 2/10 spread is basically like all the fire trucks being down at Arby’s having lunch. When trouble does come—and it will—the response will be more difficult.
In December 1988, the 2/10 inverted more than 18 months ahead of the recession. In May 1998, the 2/10 briefly inverted. It fought that off, but it became inverted again in February 2000. The recession began a year later.
During the last recession, the 2/10 spread first inverted in December 2005, but the recession didn’t begin for another two years.
Still, that track record beats a lot of humans. Remember that all metrics have downsides. That’s not a reason to dismiss them. It means we have to be aware of the limitations of our analytical tools.
The bottom line is that the yield curve inversion is a big deal, but it’s no reason to run for the exits. The Federal Reserve will probably lower rates next month, and perhaps a few more times after that. That could revert the curve. In fact, a 0.5% cut isn’t out of the question.
The Two-Tiered U.S. Economy
I also have to mention that we’re at an interesting juncture for the economy. The U.S. economy is currently moving at two different speeds. The consumer part of the economy is doing well. Folks are out there buying stuff. The last retail-sales report was quite good, and Walmart had a very encouraging earnings report. (It’s funny, but the Walmart earnings report is de facto a report on American consumer spending.)
However, the industrial part of the economy is feeling winded. This week’s industrial-production report wasn’t so hot. A lot of cyclical stocks haven’t done much (like RPM or Continental Building Products). People ask me if the market is going to sag, but in reality, a lot of the stock market has been in correction mode for several months. Energy stocks in particular have been dead. There are four key cyclical sectors: Financials, Energy, Materials and Industrials. All four have been weak lately.
We may also be at the limits of what monetary policy can do for the economy. Granted, I’m being more speculative here. Jay Powell and his friends can lower rates. That’s not hard. But it doesn’t mean that banks will start making loans. The demand part is the problem. The situation is far more advanced in Europe where interest rates are negative. A bank in Denmark just launched the world’s first negative interest rate mortgage. The bank will pay borrowers 0.5% to buy a home. This is a new world.
It seems odd that the U.S. would want to follow Germany and Japan down the maze they’ve been trapped in. There’s $15 trillion worth of negative-rate bonds in the world at the moment. We could be in a vicious cycle of low rates not creating demand, which is creating still-lower rates.
One key bright spot for the economy is the housing market. It’s steadily expanding. As long as that’s happening, the odds of a recession are very low. Next week, we’ll get the latest reports on new- and existing-home sales. That’s probably as important as the yield curve.
For now, investors should continue to focus on high-quality stocks. You may have noticed that on days when the market gets nervous, our Buy List stocks tend to do much better. Our Buy List has beaten the S&P 500 14 times in the last 16 days. The only hitch is that it means we’ve lost less. Over that time, the S&P 500 has lost 5.69% while we’re down just 1.38%. For the year, we’re beating the S&P 500 19.87% to 13.59% (not including dividends).
I want to highlight a few Buy List stocks that look particularly good at the moment. I like where Raytheon (RTN) is right now. My Buy Below is currently $195 per share, but if you can get RTN below $180, that’s a good deal. Check Point Software (CHKP) also looks quite good. Any buy below $110 is a smart move. Lastly, there’s Eagle Bancorp (EGBN). I’ll warn you that EGBN is more speculative, but that’s how the game is played. Of course, the legal issues are a problem, but if all goes well, then this bank is going for a nice bargain.
Now let’s look at some upcoming earnings reports.
Earnings Preview for Ross Stores and Hormel Foods
Now that Q2 earnings season is behind us, we have the earnings reports for Buy List stocks with quarters that ended in July. There are only three stocks like that. Ross Stores and Hormel Foods are due to report earnings next Thursday, August 22. JM Smucker reports the following Tuesday, August 22. I’ll preview the jelly folks next week. Let’s now look at the first two.
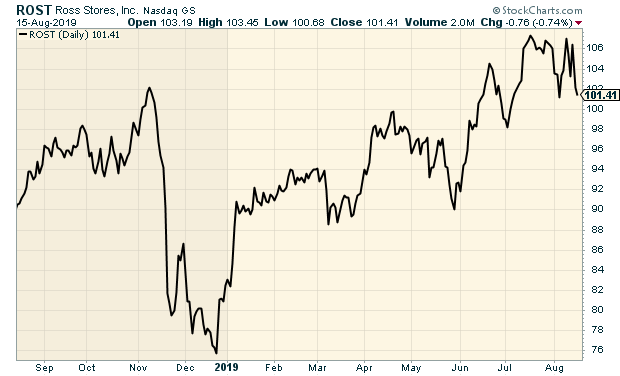
Ross Stores (ROST) continues to be one of my favorite retailers, and they’re doing quite well in the Age of Amazon. Three months ago, the deep-discounter reported fiscal Q1 earnings of $1.15 per share. Those numbers were quite good. For context, Ross told us to expect earnings between $1.05 and $1.11 per share. As usual, Ross is pretty conservative with its guidance.
The CEO noted that ladies’ apparel has been somewhat weak. Ross is also facing higher transportation costs. All of that puts a squeeze on operating margins. For any business that caters to bargain-conscious shoppers, that can be a big problem. For now, Ross seems to be handling it well.
For Q2, Ross sees comparable-store sales growth of 1% to 2%. For EPS, the company sees the exact same as Q1: $1.05 to $1.11 per share. Ross now sees full-year earnings of $4.38 to $4.52 per share. That includes seven cents per share thanks to a favorable tax benefit. The old range was $4.30 to $4.52 per share. Adjusting for that, in effect, ROST’s guidance range narrowed thanks to a one-cent increase at the low end and a five-cent decrease at the high end.
Let’s remember that Ross took a swan dive late last year. The shares fell from $103 to $76 in just a few weeks. It was scary, but I’m glad we held on. The stock gradually made its way back. On Tuesday of this week, Ross got briefly got above $108 per share. Look for another good report from Ross Stores next Thursday.
Hormel Foods (HRL) has been one of our laggards this year. Through Thursday, shares of HRL are down 3% on the year. Despite the sluggish performance, I can’t say that HRL has been a big disappointment.
Three months ago, Hormel beat by a penny. The problem is that they lowered their full-year guidance. Hormel now sees sales of $9.5 billion to $10 billion. The previous guidance was $9.7 billion to $10.2 billion. They also lowered their EPS guidance to $1.71 – $1.85. The previous range was $1.77 to $1.91 per share.
Jim Snee, Hormel’s CEO, said that despite record sales, last quarter did not meet their expectations: “African swine fever in China started to impact global hog and pork markets this quarter, which led to rapidly increasing input costs. In response, we have announced pricing action across our branded value-added portfolio in the Grocery Products, Refrigerated Foods and International segments.”
Snee said that the lower guidance “is based on the input cost increases experienced in the second quarter and a forecast for volatile domestic pork prices in the second half of fiscal 2019.”
Hormel’s outlook is troubling, but I’m still confident the company can manage its way through short-term issues. Wall Street is looking for earnings of 37 cents per share.
Before I go, there’s one more important item. Torchmark has changed its name to Globe Life (GL). The new ticker symbol is GL. Nothing else changes, and the share price and Buy Below are the exact same.
That’s all for now. There’s not a whole lot in the way of economic news next week, but I’ll be keeping an eye out for a few things. On Wednesday, the Federal Reserve will release the minutes of their last meeting. This is when they decided to cut interest rates. Also on Wednesday, we’ll get the report on sales of existing homes. Then on Friday, the report for sales of new homes comes out. For the most part, the housing sector is expanding. Be sure to keep checking the blog for daily updates. I’ll have more market analysis for you in the next issue of CWS Market Review!
– Eddy
Posted by Eddy Elfenbein on August 16th, 2019 at 7:08 am
The information in this blog post represents my own opinions and does not contain a recommendation for any particular security or investment. I or my affiliates may hold positions or other interests in securities mentioned in the Blog, please see my Disclaimer page for my full disclaimer.
- Tweets by @EddyElfenbein
-
-
Archives
- April 2024
- March 2024
- February 2024
- January 2024
- December 2023
- November 2023
- October 2023
- September 2023
- August 2023
- July 2023
- June 2023
- May 2023
- April 2023
- March 2023
- February 2023
- January 2023
- December 2022
- November 2022
- October 2022
- September 2022
- August 2022
- July 2022
- June 2022
- May 2022
- April 2022
- March 2022
- February 2022
- January 2022
- December 2021
- November 2021
- October 2021
- September 2021
- August 2021
- July 2021
- June 2021
- May 2021
- April 2021
- March 2021
- February 2021
- January 2021
- December 2020
- November 2020
- October 2020
- September 2020
- August 2020
- July 2020
- June 2020
- May 2020
- April 2020
- March 2020
- February 2020
- January 2020
- December 2019
- November 2019
- October 2019
- September 2019
- August 2019
- July 2019
- June 2019
- May 2019
- April 2019
- March 2019
- February 2019
- January 2019
- December 2018
- November 2018
- October 2018
- September 2018
- August 2018
- July 2018
- June 2018
- May 2018
- April 2018
- March 2018
- February 2018
- January 2018
- December 2017
- November 2017
- October 2017
- September 2017
- August 2017
- July 2017
- June 2017
- May 2017
- April 2017
- March 2017
- February 2017
- January 2017
- December 2016
- November 2016
- October 2016
- September 2016
- August 2016
- July 2016
- June 2016
- May 2016
- April 2016
- March 2016
- February 2016
- January 2016
- December 2015
- November 2015
- October 2015
- September 2015
- August 2015
- July 2015
- June 2015
- May 2015
- April 2015
- March 2015
- February 2015
- January 2015
- December 2014
- November 2014
- October 2014
- September 2014
- August 2014
- July 2014
- June 2014
- May 2014
- April 2014
- March 2014
- February 2014
- January 2014
- December 2013
- November 2013
- October 2013
- September 2013
- August 2013
- July 2013
- June 2013
- May 2013
- April 2013
- March 2013
- February 2013
- January 2013
- December 2012
- November 2012
- October 2012
- September 2012
- August 2012
- July 2012
- June 2012
- May 2012
- April 2012
- March 2012
- February 2012
- January 2012
- December 2011
- November 2011
- October 2011
- September 2011
- August 2011
- July 2011
- June 2011
- May 2011
- April 2011
- March 2011
- February 2011
- January 2011
- December 2010
- November 2010
- October 2010
- September 2010
- August 2010
- July 2010
- June 2010
- May 2010
- April 2010
- March 2010
- February 2010
- January 2010
- December 2009
- November 2009
- October 2009
- September 2009
- August 2009
- July 2009
- June 2009
- May 2009
- April 2009
- March 2009
- February 2009
- January 2009
- December 2008
- November 2008
- October 2008
- September 2008
- August 2008
- July 2008
- June 2008
- May 2008
- April 2008
- March 2008
- February 2008
- January 2008
- December 2007
- November 2007
- October 2007
- September 2007
- August 2007
- July 2007
- June 2007
- May 2007
- April 2007
- March 2007
- February 2007
- January 2007
- December 2006
- November 2006
- October 2006
- September 2006
- August 2006
- July 2006
- June 2006
- May 2006
- April 2006
- March 2006
- February 2006
- January 2006
- December 2005
- November 2005
- October 2005
- September 2005
- August 2005
- July 2005
 Eddy Elfenbein is a Washington, DC-based speaker, portfolio manager and editor of the blog Crossing Wall Street. His