CWS Market Review – May 3, 2022
(This is the free version of CWS Market Review. If you like what you see, then please sign up for the premium newsletter for $20 per month or $200 for the whole year. If you sign up today, you can see our two reports, “Your Handy Guide to Stock Orders” and “How Not to Get Screwed on Your Mortgage.”)
The Worst Stock Market in 83 Years
On Friday, the S&P 500 dropped 3.63% to close at its lowest level since May 19, 2021. It was the market’s worst day in nearly two years, and it also marked the S&P 500’s worst four-month start to a year since 1939.
Yikes! But as bad as the S&P 500 has been, the Nasdaq has been even worse. The tech-laden index peaked on November 19 at just over 16,000. By Friday’s close, it had lost more than 23%.
It’s no secret what’s causing this. By raising interest rates, the Federal Reserve has altered the math behind investing.
Let me explain. When Covid broke out, the Fed lowered interest rates to the floor. They didn’t want to be caught flatfooted as they had been during the financial crisis. As a result, the Fed effectively took the risk out of the market, and the riskier sectors of the market boomed. Meme stocks took off. The thinking on Wall Street (and in social media) was, “Who cares about archaic things like P/E Ratios when interest rates are free? Just buy any growth name and enjoy the profits!”
That strategy worked beautifully. Now it’s not. With the Fed raising rates, all those formerly-hot, riskier stocks are falling apart. Meanwhile, more conservative areas of the market like value stocks and low-volatility stocks are holding up quite well. It turns out that P/E Ratios aren’t quite so archaic.
Check out this chart of the S&P 500 Value Index (in blue) compared with the S&P 500 Growth Index (in black):
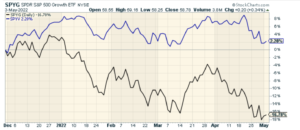
One part of the stock market is getting slammed while another part has barely been touched.
Here’s the thing: The Fed isn’t close to being done. The central bank began its latest meeting today and it will conclude tomorrow. The policy statement will come out tomorrow at 2 p.m. and we can almost certainly expect a 0.5% rate increase.
The futures market currently has the odds of a 0.5% hike at 98.7%. That seems about 1.29999% too low, but I’m not an FOMC member. Tomorrow’s rate increase will bring the target range for the Fed funds rate to 0.75 to 1%. This is the rate at which banks lend their excess reserves to each other.
For the next meeting, which takes place in mid-June, futures traders see the Fed hiking rates by 0.75%. That’s followed by 0.5% hikes in July and September. Add those up and it brings the target range for the Fed funds rate to 2.5% to 2.75%.
After that, it gets a little hazier. I’m also suspicious of forecasts going that far out. Anything can happen between now and then, although futures traders are leaning toward a few more hikes coming in late 2022 and early 2023. That’s certainly a possibility. Harvard economist Kenneth Rogoff said the Fed may have to go as high as 5% to fight off inflation.
The important thing for investors to understand is that all those rate increases will punish growth stocks and help the relative performance of conservative stocks. For example, on our Buy List, we’ve been doing very well over the last few months with Hershey (HSY). It’s hard to think of a name that’s as conservative as the chocolate folks. The shares are up more than 30% over the last few months. Last week, Hershey’s earnings report trounced Wall Street’s consensus and the company raised guidance.
When the market turns against a sector, it will show no mercy. Stocks like Netflix (NFLX) are down by two-thirds this year. Remember Moderna (MRNA)? That stock jumped 25-fold in 18 months. It’s now down 70% from its peak.
How Low Can We Go?
“I’ve been a doubter of this rally nearly since Day #1. It’s moved too fast, too soon, and it’s been too concentrated in higher-risk stocks.” So wrote your humble editor five weeks ago. As it turns out, that coincided with the market’s recent peak.
As much as I’d like to take credit for calling the top, that really isn’t the case. Truthfully, no one can “call” tops or bottoms. Bernard Baruch said, “Don’t try to buy at the bottom and sell at the top. It can’t be done, except by liars.”
When will this downturn end? Beats me. On Friday, I tweeted, “Going by history, there’s a good chance most of this correction is over.” That tweet got some pushback and I think readers thought I was predicting a bottom. That’s not the case. Instead, I was pointing out that we never know at the time when the bottom is being made. That only happens in retrospect.
Ryan Detrick points out that since World War II, there have been 24 stock market corrections, meaning falls of 10% or more. The average correction has been 14.3% and has lasted 133 days. We’re already at 117 days and the market is down 13.9%. In other words, what’s happening right now is, in fact, perfectly normal. Of the last 21 times the market fell more than 10% in a given year, it closed positive 12 of those times.
The plain fact of history is that lousy markets are good times to buy. The price of that is that you have to be a little patient.
The U.S. Economy Contracted in the First Quarter
On Monday, we got the latest report from ISM on its Manufacturing Index. This is often an interesting report for a few reasons. One is that it usually comes out on the first business day of the month. As such, it doesn’t suffer from the lag time of other economic reports.
The ISM Manufacturing Index for April fell to 55.4. That’s down 1.7 from the report for March. Any number above 50 means that the factory sector of the economy is expanding. This was the lowest number in the last 18 months.
These reports tend to line up well with economic expansions and recessions. The magic number is around 45. Whenever the ISM Manufacturing Index drops below 45, there’s a good chance that the economy is in recession. We’re not there yet.
The other report that came out last week was the Q1 GDP report. The report showed that the U.S. economy contracted by 1.4% during the first three months of the year. Wall Street had been expecting growth of 1%.
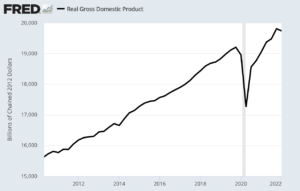
Some explanation is needed. Consumer spending isn’t that bad. For the quarter, it rose by 2.7%. One problem is that the trade deficit knocked 3.2% off economic growth. A drop in defense spending took off another 0.3%. Also, a decline in inventory weighed on results.
The impact of the Fed’s interest rate hikes hasn’t been felt just yet, but that will soon change. We’ve already seen the dramatic increase in mortgage rates. The average 30-year fixed rate is up to 5.55%. This is the fastest increase in decades. Housing affordability is nearly the worst on record. In the last year, home prices are up 20%.
We’ll learn more about the economy this Friday when the government releases the April jobs report. The last jobs report showed unemployment at 3.6%. That was lower than the unemployment rate for every single month from 1970 to 2018.
On Tuesday, the Labor Department released its monthly report on job openings and labor turnover survey (the JOLTS report). The report showed that there’s an all-time record of 11.5 million job openings across the country. Businesses are desperate for workers. For the first time in many years, workers have the upper hand. During March, 4.5 million Americans quit their jobs. There are now 5.6 million more job openings than there are unemployed people.
Strong Earnings Season for our Buy List
This earnings season is going very well for our Buy List. We’ve had 16 earnings reports so far and 15 have topped Wall Street’s earnings forecasts. I mentioned Hershey (HSY) before. I was particularly pleased with Sherwin-Williams (SHW). The stock jumped 15% in four days.
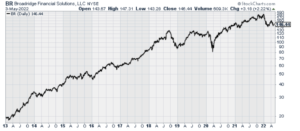
We got another earnings beat this morning. Broadridge Financial Solutions (BR) said it made $1.93 per share for its fiscal Q3. That beat estimates of $1.78 per share. Revenues rose 10% to $1.53 billion and recurring fee revenue increased by 16%.
If you’re not familiar with Broadridge, the company is the dominant vendor for sending shareholder reports, prospectuses and proxy material to shareholders. Broadridge controls about 80% of the market. It’s a great business to be in, and all that recurring revenue underscores the stability of the business. Check out this long-term chart:
Broadridge now expects full-year recurring fee revenue growth to come in at the high end of its forecast of 12% to 15%. The company also increased the low end of its range for full-year earnings growth. The previous range was 11% to 15% and the new range is 13% to 15%.
Let’s do some math. Last year, Broadridge made $5.66 per share, so 13% to 15% growth on top of that works out to $6.40 to $6.51 per share. Wall Street had been expecting $6.38 per share.
Since Broadridge has already made $3.81 per share its first three quarters, that implies a Q4 range of $2.59 to $2.70 per share. The stock gained 2.2% in today’s trading. Broadridge remains a buy up to $160 per share.
If you want to know more about Hershey, Broadridge and other high-quality names on our Buy List, then please sign up for our premium newsletter.
That’s all for now. I’ll have more for you in the next issue of CWS Market Review.
– Eddy
Posted by Eddy Elfenbein on May 3rd, 2022 at 6:34 pm
The information in this blog post represents my own opinions and does not contain a recommendation for any particular security or investment. I or my affiliates may hold positions or other interests in securities mentioned in the Blog, please see my Disclaimer page for my full disclaimer.
-
Archives
- March 2026
- February 2026
- January 2026
- December 2025
- November 2025
- October 2025
- September 2025
- August 2025
- July 2025
- June 2025
- May 2025
- April 2025
- March 2025
- February 2025
- January 2025
- December 2024
- November 2024
- October 2024
- September 2024
- August 2024
- July 2024
- June 2024
- May 2024
- April 2024
- March 2024
- February 2024
- January 2024
- December 2023
- November 2023
- October 2023
- September 2023
- August 2023
- July 2023
- June 2023
- May 2023
- April 2023
- March 2023
- February 2023
- January 2023
- December 2022
- November 2022
- October 2022
- September 2022
- August 2022
- July 2022
- June 2022
- May 2022
- April 2022
- March 2022
- February 2022
- January 2022
- December 2021
- November 2021
- October 2021
- September 2021
- August 2021
- July 2021
- June 2021
- May 2021
- April 2021
- March 2021
- February 2021
- January 2021
- December 2020
- November 2020
- October 2020
- September 2020
- August 2020
- July 2020
- June 2020
- May 2020
- April 2020
- March 2020
- February 2020
- January 2020
- December 2019
- November 2019
- October 2019
- September 2019
- August 2019
- July 2019
- June 2019
- May 2019
- April 2019
- March 2019
- February 2019
- January 2019
- December 2018
- November 2018
- October 2018
- September 2018
- August 2018
- July 2018
- June 2018
- May 2018
- April 2018
- March 2018
- February 2018
- January 2018
- December 2017
- November 2017
- October 2017
- September 2017
- August 2017
- July 2017
- June 2017
- May 2017
- April 2017
- March 2017
- February 2017
- January 2017
- December 2016
- November 2016
- October 2016
- September 2016
- August 2016
- July 2016
- June 2016
- May 2016
- April 2016
- March 2016
- February 2016
- January 2016
- December 2015
- November 2015
- October 2015
- September 2015
- August 2015
- July 2015
- June 2015
- May 2015
- April 2015
- March 2015
- February 2015
- January 2015
- December 2014
- November 2014
- October 2014
- September 2014
- August 2014
- July 2014
- June 2014
- May 2014
- April 2014
- March 2014
- February 2014
- January 2014
- December 2013
- November 2013
- October 2013
- September 2013
- August 2013
- July 2013
- June 2013
- May 2013
- April 2013
- March 2013
- February 2013
- January 2013
- December 2012
- November 2012
- October 2012
- September 2012
- August 2012
- July 2012
- June 2012
- May 2012
- April 2012
- March 2012
- February 2012
- January 2012
- December 2011
- November 2011
- October 2011
- September 2011
- August 2011
- July 2011
- June 2011
- May 2011
- April 2011
- March 2011
- February 2011
- January 2011
- December 2010
- November 2010
- October 2010
- September 2010
- August 2010
- July 2010
- June 2010
- May 2010
- April 2010
- March 2010
- February 2010
- January 2010
- December 2009
- November 2009
- October 2009
- September 2009
- August 2009
- July 2009
- June 2009
- May 2009
- April 2009
- March 2009
- February 2009
- January 2009
- December 2008
- November 2008
- October 2008
- September 2008
- August 2008
- July 2008
- June 2008
- May 2008
- April 2008
- March 2008
- February 2008
- January 2008
- December 2007
- November 2007
- October 2007
- September 2007
- August 2007
- July 2007
- June 2007
- May 2007
- April 2007
- March 2007
- February 2007
- January 2007
- December 2006
- November 2006
- October 2006
- September 2006
- August 2006
- July 2006
- June 2006
- May 2006
- April 2006
- March 2006
- February 2006
- January 2006
- December 2005
- November 2005
- October 2005
- September 2005
- August 2005
- July 2005
 Eddy Elfenbein is a Washington, DC-based speaker, portfolio manager and editor of the blog Crossing Wall Street. His