CWS Market Review – December 2, 2025
(This is the free version of CWS Market Review. If you like what you see, then please sign up for the premium newsletter for $20 per month or $200 for the whole year. If you sign up today, you can see our two reports, “Your Handy Guide to Stock Orders” and “How Not to Get Screwed on Your Mortgage.”)
Yesterday, the stock market broke its five-day winning streak but today, the market resumed its winning ways. The S&P 500 closed higher by 0.25%. The index isn’t far from a new all-time high. The Nasdaq Composite was up today by 0.59%. High Beta was up over 1%.
It’s an odd market when Apple, Walmart and Applied Materials all made new 52-week highs while Procter & Gamble and General Mills made new lows.
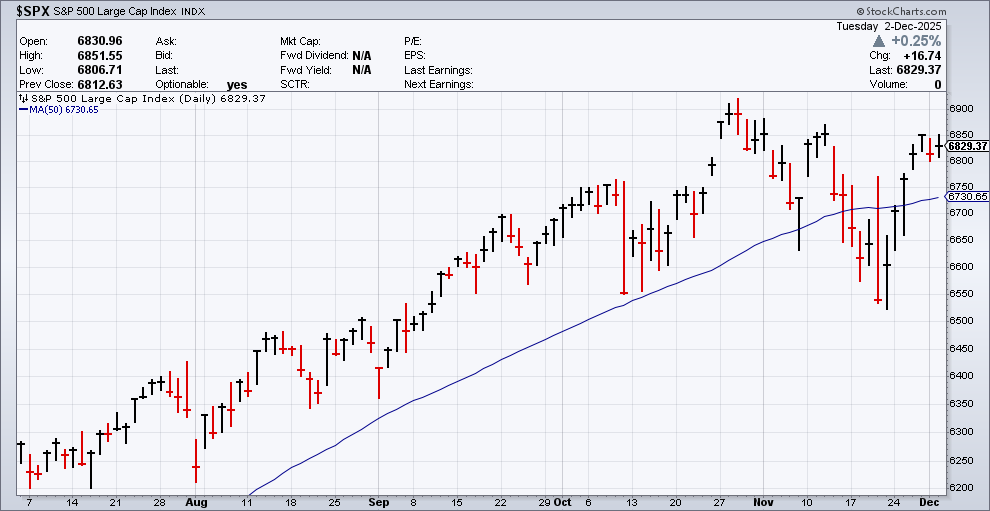
The top-performing Dow stock YTD is…Caterpillar! If you had given me 29 guesses, I still wouldn’t have gotten it.
Shares of Boeing were especially strong today. The company expects deliveries of their 737 and 787 jets to be up next year. The stock was up over 10% today. Interestingly, Boeing is a Dow component. If the Dow was weighted by market cap, then Boeing would have almost no impact.
The four largest Dow stocks (Amazon, Apple, Microsoft and Nvidia) have a combined market value of $15 trillion. That’s nearly 100 times larger than Boeing. Even a giant multinational appears as but a speck when compared with the tech giants.
Trump Appears to Favor Hassett for Fed Chair
This week, President Trump said that he already knows who he will appoint as the next Chairman of the Federal Reserve. He said he may unveil his pick before Christmas even though Jerome Powell’s term doesn’t end until May. Wall Street broadly assumes that choice to be Kevin Hassett who is currently director of the National Economic Council. For his part, Hassett has said that he’d be happy to serve.
Several years ago, I had a brief email exchange with Hassett. I noted some major flaws in his Dow 36,000 theory. I recall the exchange being cordial despite covering our disagreements.
This theory was from a book he and James Glassman wrote in 1999 claiming that stocks were wildly underpriced and that stocks should, in fact, be four times more expensive than they currently were. As is often the case, the book hit the bookshelves just weeks before the stock market’s top. I wonder if that altered his view.
The Dow eventually made it to 36,000, although it took its time.

In 1999, I was told that my critique was going to run in a major financial publication. Alas, that never came to pass, but I’ve held onto it. Here’s a sample of what I wrote all those years ago. (Warning: it gets mathy.)
First, Glassman and Hassett err in their selection of an appropriate measure of risk for their purpose. The free market prices risk, just like it prices everything else. That price is included in the price of stocks. In order to measure risk, Glassman and Hassett should use a measurement that isolates risk from the price of stocks. They don’t do this. Instead, they compare the standard deviation of stock returns to the standard deviation of risk-free-bond returns. That’s a different animal. Sure enough, with progressively longer holding periods, stock returns’ standard deviations gradually get smaller. Upon realizing that at long term, the standard deviation of stock returns is the same as bond returns’, actually slightly less, Glassman and Hassett conclude that stocks are “no more risky” than Treasury bonds.
That’s a faulty conclusion. Even if the standard deviations are the same size, it doesn’t say anything about the risk that they’re looking for. The point is that risk has still never been isolated: It’s inside those returns no matter how long-term you go. The variability of risk’s part of all these returns may be diminishing as well. That can happen even if risk stays exactly the same size. With Glassman and Hassett’s method, we have no idea how big the risk inherent in stock ownership is.
You can read the whole thing here. I’ll be curious to see if any Dow 36,000 Theory questions will make it into Hassett’s confirmation hearings. Since the book came out, Hassett’s career has gone further, but I still think I had the better argument. As for the Dow, it didn’t break 36,000 for another 22 years.
Ninth Contraction in a Row for ISM
We won’t get the key economic reports until later this month. Yesterday, we got the ISM Manufacturing Report for November. This report usually comes out on the first business day of each month. The report showed that for the ninth month in a row, the U.S. factory sector contracted.
The ISM fell from 48.7 in October to 48.2 for November. Any number below 50 means that manufacturing is getting smaller. The red flag range is usually below 45. Manufacturing makes up about 10% of the U.S. economy.
I often hear people say that America doesn’t make anything anymore. That’s not true. In reality, America is a manufacturing powerhouse, but the difference is that a lot fewer people do it.
The problem lately is that the manufacturing sector has also had to deal with trade issues. Earlier this year, President Trump instituted a 25% tariff on vehicles and auto parts, but he’s added several side deals so some countries can get around the tariffs. Another 25% tariff came into effect last month on heavy-duty trucks and parts.
From Reuters: “Only four industries in the ISM survey, including computer and electronic products, and machinery reported growth. Among the industries that contracted were wood products, transportation equipment and textile mills.”
The U.S. economy is still in a precarious spot. The Federal Reserve meets again next week, and it’s almost certain that the Fed will cut rates again by 0.25%. I think that’s the smart move. After that, however, the outlook is unclear. Several Fed members have gone on record as being skittish about more rate cuts.
After next week’s meeting, the Fed won’t meet again until late January, and I’m doubtful the Fed will follow up with another rate cut. There will probably be one or two rate cuts next year, but we’ll need to see more economic data first.
As a very general rule, the Fed tends to closely follow the year on the two-year Treasury. This chart below shows that the two rates are nearly waltzing partners. Notice how the red line moves a tad earlier than the blue line.
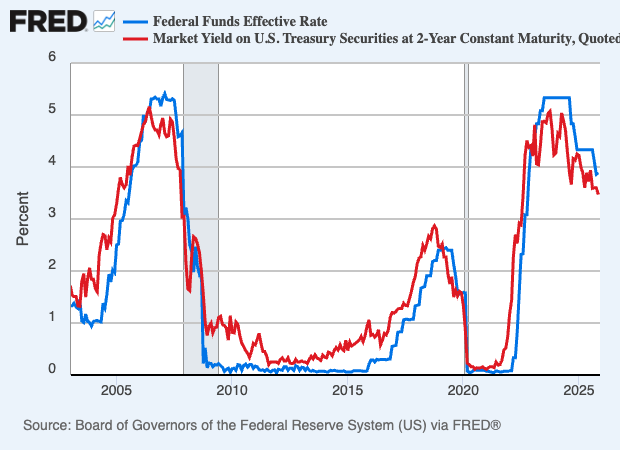
In this case, the red line, meaning the market’s line, is a bit below the Fed’s rate. That suggests that the market expects lower rates in the near future.
Bitcoin has been plunging lately. At one point, the crypto currency dropped below $85,000. For some context, two months ago, it was over $125,000. This could be related to fears of an AI bubble.
I’ll caution you that Bitcoin is very volatile, and it’s seen several drops like this before. In fact, it’s seen even larger drops than this. Still, this could mean that investors are growing tired of risky assets and they’re looking for comfort in more conservative areas. Bitcoin rallied nicely today.
That’s all for now. The Federal Reserve is meeting again next week. The policy statement will be out on Wednesday at 2 pm ET. I’ll have more for you in the next issue of CWS Market Review.
– Eddy
Posted by Eddy Elfenbein on December 2nd, 2025 at 8:17 pm
The information in this blog post represents my own opinions and does not contain a recommendation for any particular security or investment. I or my affiliates may hold positions or other interests in securities mentioned in the Blog, please see my Disclaimer page for my full disclaimer.
-
Archives
- July 2026
- June 2026
- May 2026
- April 2026
- March 2026
- February 2026
- January 2026
- December 2025
- November 2025
- October 2025
- September 2025
- August 2025
- July 2025
- June 2025
- May 2025
- April 2025
- March 2025
- February 2025
- January 2025
- December 2024
- November 2024
- October 2024
- September 2024
- August 2024
- July 2024
- June 2024
- May 2024
- April 2024
- March 2024
- February 2024
- January 2024
- December 2023
- November 2023
- October 2023
- September 2023
- August 2023
- July 2023
- June 2023
- May 2023
- April 2023
- March 2023
- February 2023
- January 2023
- December 2022
- November 2022
- October 2022
- September 2022
- August 2022
- July 2022
- June 2022
- May 2022
- April 2022
- March 2022
- February 2022
- January 2022
- December 2021
- November 2021
- October 2021
- September 2021
- August 2021
- July 2021
- June 2021
- May 2021
- April 2021
- March 2021
- February 2021
- January 2021
- December 2020
- November 2020
- October 2020
- September 2020
- August 2020
- July 2020
- June 2020
- May 2020
- April 2020
- March 2020
- February 2020
- January 2020
- December 2019
- November 2019
- October 2019
- September 2019
- August 2019
- July 2019
- June 2019
- May 2019
- April 2019
- March 2019
- February 2019
- January 2019
- December 2018
- November 2018
- October 2018
- September 2018
- August 2018
- July 2018
- June 2018
- May 2018
- April 2018
- March 2018
- February 2018
- January 2018
- December 2017
- November 2017
- October 2017
- September 2017
- August 2017
- July 2017
- June 2017
- May 2017
- April 2017
- March 2017
- February 2017
- January 2017
- December 2016
- November 2016
- October 2016
- September 2016
- August 2016
- July 2016
- June 2016
- May 2016
- April 2016
- March 2016
- February 2016
- January 2016
- December 2015
- November 2015
- October 2015
- September 2015
- August 2015
- July 2015
- June 2015
- May 2015
- April 2015
- March 2015
- February 2015
- January 2015
- December 2014
- November 2014
- October 2014
- September 2014
- August 2014
- July 2014
- June 2014
- May 2014
- April 2014
- March 2014
- February 2014
- January 2014
- December 2013
- November 2013
- October 2013
- September 2013
- August 2013
- July 2013
- June 2013
- May 2013
- April 2013
- March 2013
- February 2013
- January 2013
- December 2012
- November 2012
- October 2012
- September 2012
- August 2012
- July 2012
- June 2012
- May 2012
- April 2012
- March 2012
- February 2012
- January 2012
- December 2011
- November 2011
- October 2011
- September 2011
- August 2011
- July 2011
- June 2011
- May 2011
- April 2011
- March 2011
- February 2011
- January 2011
- December 2010
- November 2010
- October 2010
- September 2010
- August 2010
- July 2010
- June 2010
- May 2010
- April 2010
- March 2010
- February 2010
- January 2010
- December 2009
- November 2009
- October 2009
- September 2009
- August 2009
- July 2009
- June 2009
- May 2009
- April 2009
- March 2009
- February 2009
- January 2009
- December 2008
- November 2008
- October 2008
- September 2008
- August 2008
- July 2008
- June 2008
- May 2008
- April 2008
- March 2008
- February 2008
- January 2008
- December 2007
- November 2007
- October 2007
- September 2007
- August 2007
- July 2007
- June 2007
- May 2007
- April 2007
- March 2007
- February 2007
- January 2007
- December 2006
- November 2006
- October 2006
- September 2006
- August 2006
- July 2006
- June 2006
- May 2006
- April 2006
- March 2006
- February 2006
- January 2006
- December 2005
- November 2005
- October 2005
- September 2005
- August 2005
- July 2005
 Eddy Elfenbein is a Washington, DC-based speaker, portfolio manager and editor of the blog Crossing Wall Street. His