CWS Market Review – September 1, 2026
(This is the free version of CWS Market Review. If you like what you see, then please sign up for the premium newsletter for $20 per month or $200 for the whole year. If you sign up today, you can see our two reports, “Your Handy Guide to Stock Orders” and “How Not to Get Screwed on Your Mortgage.”)
Welcome to the Late 2020s!
Yesterday, the month of August came to a close, and it was a decent one for Wall Street. The S&P 500 gained 2.6% for the month, which isn’t so bad for a monthly return.
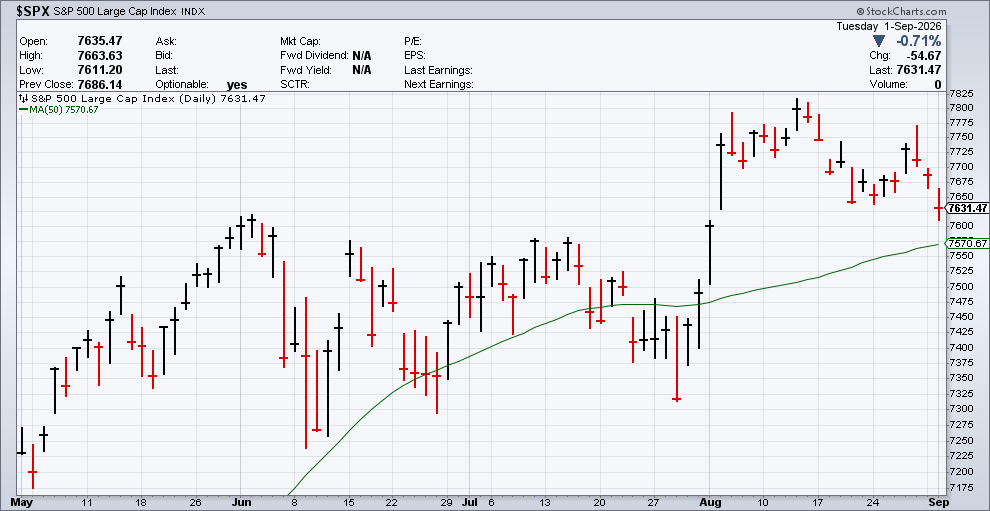
The problem for us now is that we’re in September. Although September is one of my favorite months (football, sweaters!), it’s been a terrible month for investors. Over the last century, September has been, on average, the worst month for stocks. In fact, it’s the worst for stocks by far.
Since 1928, the S&P 500 has averaged a loss of 1.17% during September. Not only that, but October is pretty bad as well. It’s been the fourth-worst month for stocks. September and October have historically combined to give investors an unwelcomed one-two punch.
Not only did the month of August come to an end yesterday, but we’re just over two-thirds of the way through the 2020s. In fact, you could say that we’re now into the late 2020s. So far, the S&P 500 is up 137.9% this decade. With dividends, the S&P 500 is 162.8% for the decade so far.
Historically, later in the decade has been much better for investors. In fact, the market has averaged a small loss over the first quarter of each decade. After the first 80 months of a decade, where we are now, the S&P 500 has gained 87.6%. But over the final third of a decade, the S&P 500 has posted an average gain of 62.1%. That’s not bad considering the final third is only half as much time as the first two-thirds of a decade.
This has also been a traditionally tough time for stocks during the presidential election cycle. Historically, the mid-term year has been lousy for stocks, but the market turns toward the bulls during the final quarter of the mid-term year. After that, it’s been a sharp 30% bull run until the middle of the pre-election year.
Stocks and Bonds Part Ways
To be clear, I don’t put a lot of faith in these calendar effects, although I do find them interesting. For example, the stock market’s entire gain has come over the last few and first few days of each month. The middle of the month is pretty much flat.
I do have a concern lately in that the stock and bond markets seem to have parted ways. As a very general rule of thumb, the bond market tends to lead the stock market by several months. Several bear markets have been preceded by sharp downturns in bond prices. It makes sense if you view it as investors dumping safer assets and chasing riskier assets.
Here’s a chart of the S&P 500 ETF (SPY) and the Long-Term Treasury Bonds ETF (TLT):
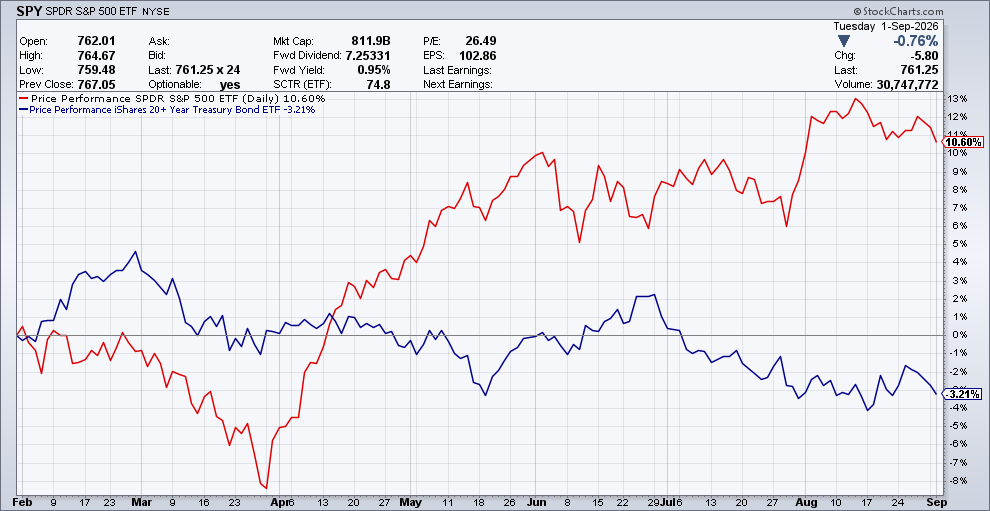
Notice how bond prices have turned down over the last six months even as stock prices have soared. It’s the big divergence that grabs my attention. The stock market last closed at a new high on August 13. Since then, it hasn’t done much. Today, the S&P 500 fell for the third day in a row. Lately, value stocks have resumed leading the market. I suspect that’s going to last.
Higher bonds can easily harm economic growth. In fact, mortgage rates are at a 14-month high. The average rate on the 30-year fixed mortgage is now 6.87%. Those higher borrowing costs radiate out across the entire housing industry.
It’s not just here; bond prices around the world have fallen lower. In Japan and Britain, yields surged to multi-decade highs. The 30-year British Treasury is close to a 28-year high.
Tech stocks have been acting a little better lately, though they’re still well below the relative strength high we saw in early June. There’s still a lot of uncertainty as the U.S. has launched more strikes against Iran and oil prices have climbed higher. Now we’ve learned that interest rates may soon be rising again.
What Happened at the Fed’s Jackson Hole Meeting
The Federal Reserve held its annual get-together at Jackson Hole, WY over the weekend. Fed Chairman Kevin Warsh spoke on Friday, and he sounded a hawkish note.
Warsh said the Fed has more work to do to bring inflation in line with the Fed’s target. He also cautioned that there are some signs that the markets see possible risks in the near future. Investors are clearly worried about excess valuations and slower growth.
There are a few items that Warsh mentioned that I want to highlight for you. First is that Warsh tried to avoid saying anything that could be construed as guidance. That’s good to hear and it gets rid of a silly guessing game on Wall Street.
Specifically, Warsh said, “We should not indulge a regime in which market participants are looking primarily to the Fed for their next trade.” That’s very good to hear. Warsh said:
Forward guidance as a regular practice was adopted by my colleagues and me during the Global Financial Crisis. It was essential at the time, and we introduced it with much fanfare. But, as with other legacies of crises past, I believe that the practice has overstayed its welcome.
Instead, Warsh said he wanted to give his broad overview of where the U.S. economy is right now. Warsh acknowledged that the inflation picture has gotten better, but — and this is the key — he still isn’t convinced that the underlying trends have improved.
Warsh pointed out that over the last six months, 49% of the goods and services in the PCE showed annual price increases of more than 3% which is, in Warsh’s words, “still quite elevated.”
Warsh essentially declared war on inflation, and the jobs market will take the backseat.
In the trading pits, futures traders pushed up the odds of a rate hike later this month. A week ago, traders said the odds were just 43% that the Fed would hike in September.
After Jackson Hole, the odds shot up to 68%. The next Fed meeting is on September 16. Traders also see a rate hike coming at the December meeting. I’m not convinced about that just yet, but I was surprised by the defiant attitude from the Fed chairman. He makes it clear what his agenda is.
In June, I told you about the very good earnings report from Science Applications International (SAIC). This is a wonderful company. I’ve described it as the IT helpdesk for the Pentagon.
I’ll cover the stock in more detail in our premium issue, but I wanted to share some impressive numbers with you.
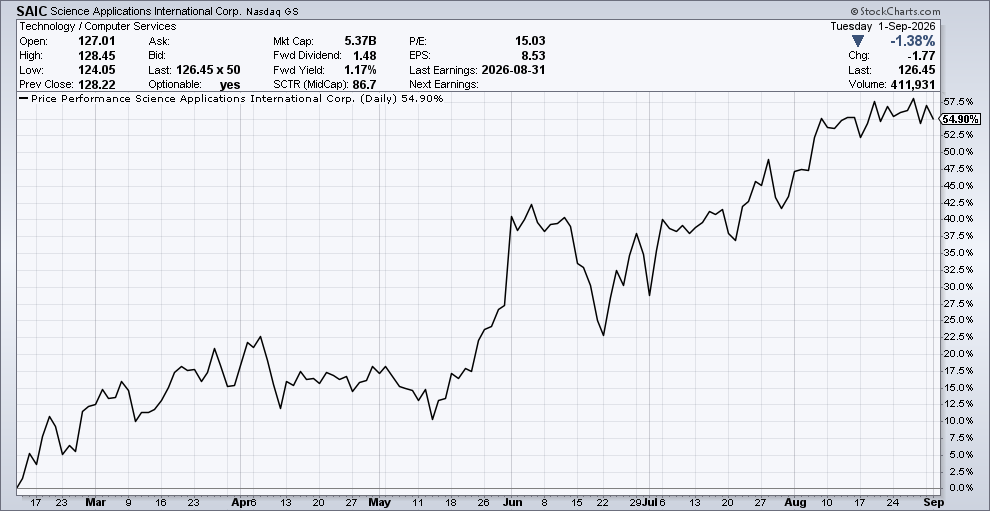
For its fiscal Q1 (ending May 1), SAIC made $3.23 per share. That was 41% above Wall Street’s forecast of $2.28 per share. SAIC also raised its full-year earnings range from $9.50 to $9.70 per share, to $9.90 to $10.10 per share.
Last week, SAIC reported earnings again, and again, it flattened Wall Street’s estimates. For its fiscal Q2, SAIC made $3.01 per share. The consensus on Wall Street had been for $2.31 per share.
The company raised its full-year guidance again. SAIC now sees full year earnings ranging between $10.65 and $10.75 per share. Over the last seven months, SAIC has gained more than 55% for us.
If you want to see our complete coverage on our Buy List stocks, please sign up for our premium issues here ($20/month or $200/year).
That’s all for now. The stock market will be closed next Monday for Labor Day. I’ll have more for you in the next issue of CWS Market Review.
– Eddy
Posted by Eddy Elfenbein on September 1st, 2026 at 6:02 pm
The information in this blog post represents my own opinions and does not contain a recommendation for any particular security or investment. I or my affiliates may hold positions or other interests in securities mentioned in the Blog, please see my Disclaimer page for my full disclaimer.
-
Archives
- October 2026
- September 2026
- August 2026
- July 2026
- June 2026
- May 2026
- April 2026
- March 2026
- February 2026
- January 2026
- December 2025
- November 2025
- October 2025
- September 2025
- August 2025
- July 2025
- June 2025
- May 2025
- April 2025
- March 2025
- February 2025
- January 2025
- December 2024
- November 2024
- October 2024
- September 2024
- August 2024
- July 2024
- June 2024
- May 2024
- April 2024
- March 2024
- February 2024
- January 2024
- December 2023
- November 2023
- October 2023
- September 2023
- August 2023
- July 2023
- June 2023
- May 2023
- April 2023
- March 2023
- February 2023
- January 2023
- December 2022
- November 2022
- October 2022
- September 2022
- August 2022
- July 2022
- June 2022
- May 2022
- April 2022
- March 2022
- February 2022
- January 2022
- December 2021
- November 2021
- October 2021
- September 2021
- August 2021
- July 2021
- June 2021
- May 2021
- April 2021
- March 2021
- February 2021
- January 2021
- December 2020
- November 2020
- October 2020
- September 2020
- August 2020
- July 2020
- June 2020
- May 2020
- April 2020
- March 2020
- February 2020
- January 2020
- December 2019
- November 2019
- October 2019
- September 2019
- August 2019
- July 2019
- June 2019
- May 2019
- April 2019
- March 2019
- February 2019
- January 2019
- December 2018
- November 2018
- October 2018
- September 2018
- August 2018
- July 2018
- June 2018
- May 2018
- April 2018
- March 2018
- February 2018
- January 2018
- December 2017
- November 2017
- October 2017
- September 2017
- August 2017
- July 2017
- June 2017
- May 2017
- April 2017
- March 2017
- February 2017
- January 2017
- December 2016
- November 2016
- October 2016
- September 2016
- August 2016
- July 2016
- June 2016
- May 2016
- April 2016
- March 2016
- February 2016
- January 2016
- December 2015
- November 2015
- October 2015
- September 2015
- August 2015
- July 2015
- June 2015
- May 2015
- April 2015
- March 2015
- February 2015
- January 2015
- December 2014
- November 2014
- October 2014
- September 2014
- August 2014
- July 2014
- June 2014
- May 2014
- April 2014
- March 2014
- February 2014
- January 2014
- December 2013
- November 2013
- October 2013
- September 2013
- August 2013
- July 2013
- June 2013
- May 2013
- April 2013
- March 2013
- February 2013
- January 2013
- December 2012
- November 2012
- October 2012
- September 2012
- August 2012
- July 2012
- June 2012
- May 2012
- April 2012
- March 2012
- February 2012
- January 2012
- December 2011
- November 2011
- October 2011
- September 2011
- August 2011
- July 2011
- June 2011
- May 2011
- April 2011
- March 2011
- February 2011
- January 2011
- December 2010
- November 2010
- October 2010
- September 2010
- August 2010
- July 2010
- June 2010
- May 2010
- April 2010
- March 2010
- February 2010
- January 2010
- December 2009
- November 2009
- October 2009
- September 2009
- August 2009
- July 2009
- June 2009
- May 2009
- April 2009
- March 2009
- February 2009
- January 2009
- December 2008
- November 2008
- October 2008
- September 2008
- August 2008
- July 2008
- June 2008
- May 2008
- April 2008
- March 2008
- February 2008
- January 2008
- December 2007
- November 2007
- October 2007
- September 2007
- August 2007
- July 2007
- June 2007
- May 2007
- April 2007
- March 2007
- February 2007
- January 2007
- December 2006
- November 2006
- October 2006
- September 2006
- August 2006
- July 2006
- June 2006
- May 2006
- April 2006
- March 2006
- February 2006
- January 2006
- December 2005
- November 2005
- October 2005
- September 2005
- August 2005
- July 2005
 Eddy Elfenbein is a Washington, DC-based speaker, portfolio manager and editor of the blog Crossing Wall Street. His