Archive for September, 2007
-
The Implied Electability Contract
Eddy Elfenbein, September 25th, 2007 at 10:59 amOne of the things I find fascinating about finance is how you can use markets for two items to create an “implied market” for a third. I’ve written about this before here, here and here. This idea is at the root of all the complex financial instruments that caused problems for so many hedge funds recently.
I’ll give you a good example I recently discovered. At InTrade.com, the site where you can trade futures on real world events, you can buy contracts on which candidate will win his or her party’s nomination next year. There’s a separate contract for which candidate will win the presidency.
So, if you divide the former by the latter, you get an “electability” contract. For example, according to recent prices, Rudy Giuliani has a 34.65% chance (I’m using the mid-point of the bid/ask spread) of getting the GOP nomination and a 15.95% of winning the presidency. So the market believes that if he gets the nomination, he has a 46.03% chance of winning (15.95% divided by 34.65%).
(The only minor flaw is that could include a candidate winning but not getting the nomination, however, I’m content with dismissing that possibility as beyond remote.)
What’s interesting is electability in the general election can have little impact on how well a candidate does in the primaries. Some people, myself included, think that Ronald Reagan would have had a better chance of beating Jimmy Carter in 1976 instead of Gerald Ford, even though Ford beat Reagan for the nomination.
I should add that I don’t place a great deal of faith in these real world futures markets. I simply see them as fun games to enjoy, but not to take too seriously. Also, the markets aren’t very liquid. In the following table I took the mid-point of each contract’s bid/ask spread. A minor change could have a big impact on the smaller-priced contracts.
Having said that, here’s a look at some candidate and the market’s take on their electability.
Candidate………To Get Nomination……To Win………….Electability
Giuliani……………………34.65……………….15.95………………46.03
Romney…………………..22.95……………….8.85………………..38.56
Thompson……………….24.85………………..9.60………………..38.63
Paul…………………………5.50………………..1.95………………..35.45
McCain…………………….4.65……………….. 2.35………………..50.54
Hillary……………………..67.05……………….45.25………………67.49
Obama……………………16.35………………..8.25……………….50.46
Edwards…………………..6.95………………..3.75………………..53.96
Gore………………………..8.05………………..5.25………………..65.21 -
Shiller’s Real Track Record
Eddy Elfenbein, September 25th, 2007 at 10:09 amAt Deal Breaker, Bess Levin highlights Alan Greenspan’s predictive abilities. In the linked NY Post article, I was left speechless by Terry Keenan’s touting of Robert Shiller’s track record.
No wonder the average homeowner is confused. That’s why when I want to really know about the real state of the real estate market, I want to hear from someone who has been predicting this whole debacle for years now – a spot-on observer like Robert Shiller of Yale University.
Shiller is in no need of reputation repair. Not only did he warn of the housing mess, he also called the Internet bubble with remarkable precision in his book “Irrational Exuberance.”Sorry Terry, but Shiller hasn’t been spot on—he’s been way off the mark. Shiller is a perma-bear and investors who followed his advice lost out in a big way. In the last five years, the S&P 500 has doubled. Shiller missed that and every other rally. He was a bear long before the market nose-dived and he’s continued to be a bear ever since.
For some reason, there seems to be a strong bias to celebrate people who warn of market crashes. Perhaps it’s more dramatic. If you’re always warnings of a market crash, guess what? Sooner or later you’re going to be right! You’re suddenly a wise market observer. No matter what you say after, your reputation can live off that forever. The people who make the undramatic prediction “no, don’t worry, everything’s ok” rarely get credit for being right. -
FactSet Follow-Up
Eddy Elfenbein, September 25th, 2007 at 9:40 amAbout a month ago, I highlighted FactSet Research Systems (FDS) as a stock worth watching. The stock is up 13% since then.
I wanted to follow up as several readers asked if recent hedge fund explosions were curtailing FactSet’s business. Good question. Earnings are out today and the short answer is no. For the quarter, FactSet had EPS growth of 30% and revenue growth of 23%. The CEO said: “Demand for FactSet’s services continued unabated. Users rose to 35,000, up from 33,300 at the beginning of the quarter. Client count was 1,953 as of August 31, a net increase of 39 clients during the quarter.” -
Earnings Preview: Bed Bath & Beyond
Eddy Elfenbein, September 24th, 2007 at 4:30 pmFrom the AP:
Home accessories retailer Bed Bath & Beyond Inc. reports earnings for the fiscal second quarter on Wednesday. The following is a summary of key developments and analyst opinion related to the period.
OVERVIEW: Home furnishings and accessories retailers are being pressured as the housing market sags, and consumers curb discretionary spending due to widening credit problems and high energy costs.
Bed Bath & Beyond Inc. is no exception. In June, the Union, N.J., company said its full-year profit would miss analyst expectations due to uncertain economic trends.
BY THE NUMBERS: Analysts polled by Thomson Financial expect a profit for the fiscal second quarter of 52 cents per share on revenue of $1.77 billion.
ANALYST TAKE: Bear Stearns analyst Christopher Horvers said in a note to investors on Monday that he remains cautious on the sector.
“Home furnishings remains one of the most challenging spaces in retail given the difficulties in housing, the fragmentation of the market, the discretionary nature of the products and the inventory build that has occurred across the retail landscape,” he wrote.
He said he believes Bed Bath & Beyond will continue to “encounter near-term headwinds” and said he expects a few more quarters of difficult trends.
For the quarter, he expects its gross margin to fall less than 1 percent to 41.4 percent of sales, driven by an increase in inventory acquisitions costs, a shift in merchandise mix and a heightened promotional environment.
WHATS AHEAD: In a note to investors on Monday, Deutsche Bank North America analyst Mike Baker said he is “concerned” about analyst estimates for fiscal 2008 in the home furnishings sector overall, including Bed Bath & Beyond. Analysts polled by Thomson Financial expect, on average, a profit of $2.47 per share.
“The company will not give its 2008 guidance until December, but at that time, we would not be surprised if BBBY guides to a number below the current consensus,” Baker wrote.
A profit of $2.47 per share in fiscal 2008 implies a same-store sales improvement of 3 percent and a slight increase in operating margins, Baker said.
“But, with our concerns regarding high inventories industry wide, demand environment would need to improve considerably over the next year to drive that kind of recovery,” Baker wrote. “The recent Fed easing could help us get there, but that’s not without risk, in our view.”
The Federal Reserve approved a half-point reduction in interest rates on Thursday, in an effort to ease concern about the economy.
STOCK PERFORMANCE: Shares fell nearly 15 percent during the quarter. -
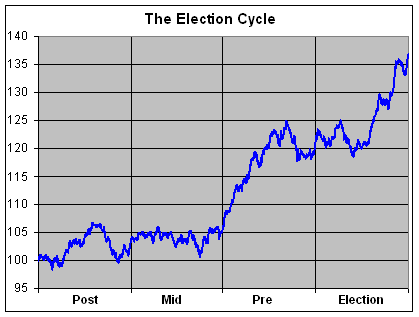
The Presidential Election Cycle
Eddy Elfenbein, September 24th, 2007 at 2:35 pmOut of boredom, this weekend I looked at all the Dow daily closings for the last 111 years (about 28,000 points of data) for a closer examination of the Presidential Election Cycle’s impact on stock prices. (What the hell was I thinking?) I did this before, but that only for the data from 1930 to mid-2006. This time, I looked at the every day from 1896 to last Friday.
I don’t put much faith in these types of trading rules, but there are some interesting results. Historically, the Dow has gained an average of 24.1% from September 30 of the mid-term election year to September 6 of the pre-election year, which we recently passed.
This means that nearly two-thirds of the Dow’s four-year gain (24.1% of 36.7%) comes in less than one-quarter of the time. That’s a pretty stunning stat.
After September 6 of the pre-election year, the Dow has historically pulled back 5.2% to May 29 of the election year. After that, it puts on a nice 23.2% climb to August 3 of the post election year. Then trouble starts. After August 3, the Dow then pulls back 5.6% and we’re back at our starting point, September 30 of the mid-term election year.
Also, Leap Day is a positive day for the Dow, up an average of 0.1256%. -
Looking at Long-Term Credit Spreads
Eddy Elfenbein, September 24th, 2007 at 10:06 am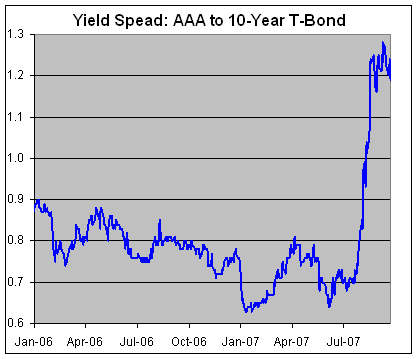
If you’re confused by the credit crunch that happened last summer, here’s a good graph showing you some of the details. This chart shows the spread between Moody’s AAA Corporate yield index and the 10-year Treasury yield.
Since lending to the government is pretty low risk, they own the printing press after all, the lower the spread signifies greater confidence the free market has in corporations paying back their loans. When the difference widens, that signifies that investors have become much more afraid of loaning to corporations. In other words, they’ve become more afraid of taking risks.
In mid-July, the spread was around 70 basis points, which was close to some of the lowest levels in the past 15 years. Then, very suddenly, the spread exploded to over 120 basis points in less than one month.
While the spread is still wide compared with last summer, it’s still moderate compared with the long-term. Consider that after 9/11, it ballooned to over 260 basis points. Looking at last ten years, the current spread is within the lowest 37th percentile. -
Playmate of the Year Talks Investing
Eddy Elfenbein, September 24th, 2007 at 8:45 am -
A Lesson on Data Mining
Eddy Elfenbein, September 24th, 2007 at 8:42 amHere’s a cute stat I saw over at Motley Fool. Cal Tech professor David Leinweber crunched the numbers and found that the singe-best predictor of stock prices is butter production in Bangladesh. “When butter production was up 1%, the S&P 500 was up 2% the next year. Conversely, if butter production was down 10%, you could predict the S&P 500 would be down 20%.”
Coincidence? Well, yes. But this isn’t too far from the kind of research that’s been driving many hedge funds. -
Beware the Emerging Hegemonic Canadian Superpower
Eddy Elfenbein, September 21st, 2007 at 3:14 pmFor the first time in three decades, the loonie reaches parity.
-
Civics Quiz
Eddy Elfenbein, September 21st, 2007 at 2:29 pmI pride myself on being a civics geek. I got 58 out of 60 on this quiz. (I missed #36 and #58.)
How did you do?
-
Archives
- July 2026
- June 2026
- May 2026
- April 2026
- March 2026
- February 2026
- January 2026
- December 2025
- November 2025
- October 2025
- September 2025
- August 2025
- July 2025
- June 2025
- May 2025
- April 2025
- March 2025
- February 2025
- January 2025
- December 2024
- November 2024
- October 2024
- September 2024
- August 2024
- July 2024
- June 2024
- May 2024
- April 2024
- March 2024
- February 2024
- January 2024
- December 2023
- November 2023
- October 2023
- September 2023
- August 2023
- July 2023
- June 2023
- May 2023
- April 2023
- March 2023
- February 2023
- January 2023
- December 2022
- November 2022
- October 2022
- September 2022
- August 2022
- July 2022
- June 2022
- May 2022
- April 2022
- March 2022
- February 2022
- January 2022
- December 2021
- November 2021
- October 2021
- September 2021
- August 2021
- July 2021
- June 2021
- May 2021
- April 2021
- March 2021
- February 2021
- January 2021
- December 2020
- November 2020
- October 2020
- September 2020
- August 2020
- July 2020
- June 2020
- May 2020
- April 2020
- March 2020
- February 2020
- January 2020
- December 2019
- November 2019
- October 2019
- September 2019
- August 2019
- July 2019
- June 2019
- May 2019
- April 2019
- March 2019
- February 2019
- January 2019
- December 2018
- November 2018
- October 2018
- September 2018
- August 2018
- July 2018
- June 2018
- May 2018
- April 2018
- March 2018
- February 2018
- January 2018
- December 2017
- November 2017
- October 2017
- September 2017
- August 2017
- July 2017
- June 2017
- May 2017
- April 2017
- March 2017
- February 2017
- January 2017
- December 2016
- November 2016
- October 2016
- September 2016
- August 2016
- July 2016
- June 2016
- May 2016
- April 2016
- March 2016
- February 2016
- January 2016
- December 2015
- November 2015
- October 2015
- September 2015
- August 2015
- July 2015
- June 2015
- May 2015
- April 2015
- March 2015
- February 2015
- January 2015
- December 2014
- November 2014
- October 2014
- September 2014
- August 2014
- July 2014
- June 2014
- May 2014
- April 2014
- March 2014
- February 2014
- January 2014
- December 2013
- November 2013
- October 2013
- September 2013
- August 2013
- July 2013
- June 2013
- May 2013
- April 2013
- March 2013
- February 2013
- January 2013
- December 2012
- November 2012
- October 2012
- September 2012
- August 2012
- July 2012
- June 2012
- May 2012
- April 2012
- March 2012
- February 2012
- January 2012
- December 2011
- November 2011
- October 2011
- September 2011
- August 2011
- July 2011
- June 2011
- May 2011
- April 2011
- March 2011
- February 2011
- January 2011
- December 2010
- November 2010
- October 2010
- September 2010
- August 2010
- July 2010
- June 2010
- May 2010
- April 2010
- March 2010
- February 2010
- January 2010
- December 2009
- November 2009
- October 2009
- September 2009
- August 2009
- July 2009
- June 2009
- May 2009
- April 2009
- March 2009
- February 2009
- January 2009
- December 2008
- November 2008
- October 2008
- September 2008
- August 2008
- July 2008
- June 2008
- May 2008
- April 2008
- March 2008
- February 2008
- January 2008
- December 2007
- November 2007
- October 2007
- September 2007
- August 2007
- July 2007
- June 2007
- May 2007
- April 2007
- March 2007
- February 2007
- January 2007
- December 2006
- November 2006
- October 2006
- September 2006
- August 2006
- July 2006
- June 2006
- May 2006
- April 2006
- March 2006
- February 2006
- January 2006
- December 2005
- November 2005
- October 2005
- September 2005
- August 2005
- July 2005
 Eddy Elfenbein is a Washington, DC-based speaker, portfolio manager and editor of the blog Crossing Wall Street. His