Archive for 2007
-
NASDAQ 2500!
Eddy Elfenbein, January 16th, 2007 at 11:59 amI nearly forgot to mention this. On Friday, the NASDAQ Composite (^IXIC) broke 2500. Since I’ve blocked out much of late-1990s, I think this is a new all-time high. It may have gone higher, I don’t remember. Anyway, here’s a long-term chart:
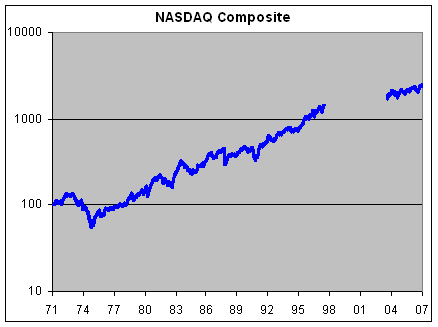
Yep, that’s an all-time high baby! -
Bed Bath & Beyond Makes New 52-Week High
Eddy Elfenbein, January 16th, 2007 at 10:25 amShares of Bed Bath & Beyond (BBBY) hit a new 52-week high this morning. Lower gas prices basically act like a tax cut for consumers. FactSet (FDS) and SEI Investments (SEIC) are also at new highs.
-
The Buy List So Far
Eddy Elfenbein, January 11th, 2007 at 10:58 amI’m happy to report that our Buy List is off to a good start for 2007. As of mid-day today, we’re up about 1.36% compared with 0.39% for the S&P 500. Of course, this is only the seventh day of trading, so a lot can change, but it’s nice to get a fresh start out of the gate.
Our biggest winner so far is Joe Bank (JOSB), which is one of our new stocks for this year. It’s up 8.9%. Our second-best stock is Bed Bath & Beyond (BBBY) which is up 7.2%. SEI Investments (SEIC) was our biggest winner from last year, and it made a new 52-week high this morning. -
Long-Term Performance By Market Cap
Eddy Elfenbein, January 10th, 2007 at 12:30 pmOver the last eighty years, small-cap stocks have been the best-performing size category of stocks. I got this data from Professor Ken French’s Web site.
He divided the market into ten “size deciles.” What’s interesting is that it’s almost perfectly rank-ordered–the largest stocks did the worst, the smallest did the best.
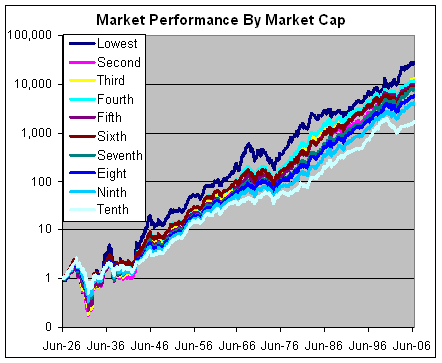
The data covers from mid-1926 through November 2006. Here’s the annualized return by decile:
Lowest…………………13.588%
Third……………………12.504%
Fourth………………….12.371%
Fifth…………………….12.128%
Second………………..12.120%
Sixth……………………12.015%
Seventh………………..11.861%
Eight……………………11.414%
Ninth……………………10.950%
Biggest…………………9.703%
Here’s the same chart, but I divided all deciles by the largest decile (which is the flat line).
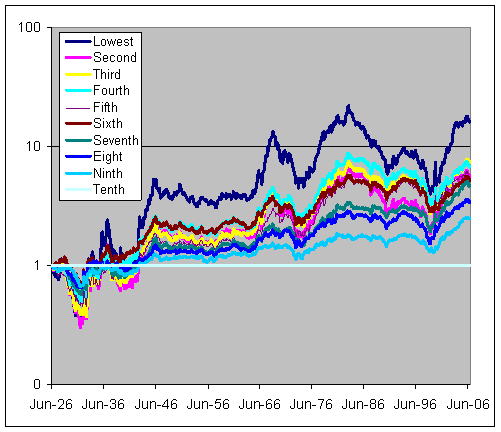
You can see that small-cap outperformance is very cyclical with the last “up” cycle starting seven years ago. -
Hollywood & Hedge Funds
Eddy Elfenbein, January 10th, 2007 at 10:31 amMany hedge funds have taken a beating this year, but Stark Investments got whacked due to its bomb at the box office:
When news broke that Benjamin Waisbren had been fired as Hollywood frontman for Stark Investments, moviedom shuddered.
Hedge fund managers such as St. Francis, Wisconsin-based Stark have become piggy banks for the U.S. film industry. Since 2005, these funds and private equity investors have committed $4.5 billion to movies, betting the box office can beat the markets.
Movie industry bible Variety called Waisbren’s abrupt exit in May a “bellwether” for the future of fast money in Hollywood. A former bankruptcy lawyer who led equity creditor committees for America West Airlines Inc. and WorldCom Inc., Waisbren, 49, had convinced his bosses at Stark that Hollywood could be structured like any other investment, albeit with more glitz.
Stark, which manages $9.4 billion, ended up getting soaked by “Poseidon,” the 2006 remake of “The Poseidon Adventure,” which sank at the box office. Stark executives declined to comment for this story. -
Computer is So ’06
Eddy Elfenbein, January 9th, 2007 at 4:44 pmFirst Dell drops “Computer” from its name. Now Apple Computer is just Apple. Nobody wants to be seen as “just” a computer stock anymore.
-
Earnings Season
Eddy Elfenbein, January 9th, 2007 at 12:51 pmOver the next few weeks, several of our Buy List stocks will report earnings. Fourteen of our 20 stocks have quarters that ended on December 31. Here they are with their earnings dates and EPS estimates:
Ticker……………….Date…………….EPS Estimate
HOG………………..18-Jan……………….$0.96
UNH………………..18-Jan……………….$0.85
VAR…………………24-Jan……………….$0.39
DHR………………..25-Jan……………….$0.93
FISV……………….31-Jan……………….$0.65
AFL……………………TBA……………….$0.67
APH…………………..TBA……………….$0.81
FIC……………………TBA……………….$0.58
GGG………………….TBA………………..$0.52
NICK…………………TBA……………….$0.27
RESP…………………TBA……………….$0.39
SEIC…………………TBA……………….$0.59
SYY…………………..TBA…………………$0.38
BER…………………..TBA………………..$0.88 -
Skies May Darken for Insurers
Eddy Elfenbein, January 9th, 2007 at 12:28 pmThe Wall Street Journal sees problems ahead for insurance stocks:
Last year’s sky-high profits were mainly driven by the soaring cost of coastal natural-catastrophe coverage after Hurricane Katrina in 2005 and the dearth of major storms in 2006. While premiums charged for that coverage are still high, competition is steadily lowering rates in other important lines of coverage, like corporate directors’ and officers’ liability policies or workers’ compensation.
Some insurers, flush with cash and hungry for growth, might charge too little for coverage to win customers. If future-year claims come in higher than expected and exceed the premiums collected, shareholders of property-casualty insurers could pay dearly. When companies report fourth-quarter results over the next two months, premium rates are worth watching.
Typically, “when the pricing cycle is starting to soften, that is a sell signal,” says William Hawkins, an insurance-stock analyst with Keefe, Bruyette & Woods Ltd. in London.
Also, the combination of high profits, low predicted sales growth and the lure of achieving global scale could be a recipe for insurers to strike deals, adding risk.
Premiums tend to rise and fall in cycles often determined as much — or more — by the supply of capital as by the actual risks insurers take on.
The last down cycle illustrates how price wars can sap earnings. Industry profits peaked in 1997 and dropped a total of 44% over the next three years, according to Insurance Services Office Inc., which provides data and services that help classify and evaluate risk. Prices fell and claims rose significantly during that period.
Partly in response to those circumstances and partly because of losses associated with the Sept. 11, 2001, terrorist attacks in the U.S. and other factors, prices climbed earlier this decade. Amid this upswing, insurers preached a new focus on disciplined underwriting to avoid the boom-to-bust cycles of the past.
“When you’ve gone through a bad period, you do behave in a more conservative fashion,” says William Berkley, chief executive of W.R. Berkley Corp., a Greenwich, Conn., insurer.
-
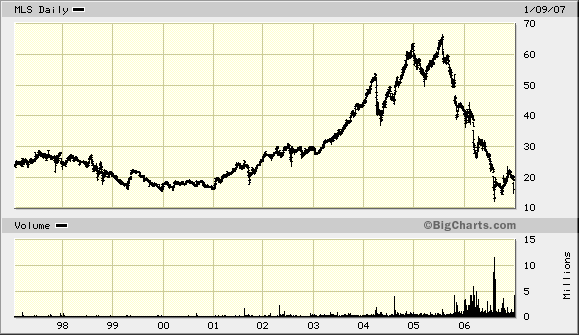
Mills Corp.
Eddy Elfenbein, January 9th, 2007 at 10:59 amI’ve followed Mills Corp. (MLS) for many years. The company is a real estate investment trust that owns several gigantic mall complexes.
To show you what a dramatic impact the tech bubble had, investment money was being drawn away from conservative investments. In December 1999, Mills Corp.’s stock got down to $15.31 a share, even though it was paying $0.503 a share in dividends. That comes to 13.8%.
But as the tech market fizzled, the real estate market took off. By mid-2005, Mills Corp. broke $60 a share. Today, the company is facing bankruptcy. An internal investigation has revealed accounting errors and executive misconduct.Accounting mistakes included a failure to record a foreign currency gain, miscalculations of executive bonuses and a mix-up between Mills revenue and revenue generated by joint ventures, the company said.
Mills also failed to properly account for its Empire Tract property in the Meadowlands, which the company sold to the state as part of winning the bidding to develop Xanadu project, the filing said.
Those errors “reflect a lack of competence and in some instances a failure of communication and inadequate internal controls,” Mills said.The stock is down about 15% today.
-
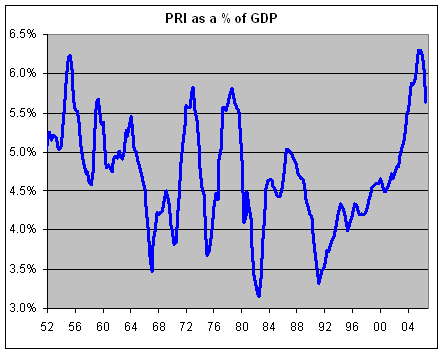
A Look at Real Estate
Eddy Elfenbein, January 9th, 2007 at 10:26 amHere’s a graph showing private residential investment as a percentage of GDP. It’s a good gauge of how well the real estate market is doing.
The number averages about 4.7%, with a standard deviation of about 0.7%. Last year, it got up to 6.3% which was the highest level in over 50 years.
Since then, it’s started to plunge. And as you can see, historically, the downtrends are pretty severe.
-
Archives
- June 2026
- May 2026
- April 2026
- March 2026
- February 2026
- January 2026
- December 2025
- November 2025
- October 2025
- September 2025
- August 2025
- July 2025
- June 2025
- May 2025
- April 2025
- March 2025
- February 2025
- January 2025
- December 2024
- November 2024
- October 2024
- September 2024
- August 2024
- July 2024
- June 2024
- May 2024
- April 2024
- March 2024
- February 2024
- January 2024
- December 2023
- November 2023
- October 2023
- September 2023
- August 2023
- July 2023
- June 2023
- May 2023
- April 2023
- March 2023
- February 2023
- January 2023
- December 2022
- November 2022
- October 2022
- September 2022
- August 2022
- July 2022
- June 2022
- May 2022
- April 2022
- March 2022
- February 2022
- January 2022
- December 2021
- November 2021
- October 2021
- September 2021
- August 2021
- July 2021
- June 2021
- May 2021
- April 2021
- March 2021
- February 2021
- January 2021
- December 2020
- November 2020
- October 2020
- September 2020
- August 2020
- July 2020
- June 2020
- May 2020
- April 2020
- March 2020
- February 2020
- January 2020
- December 2019
- November 2019
- October 2019
- September 2019
- August 2019
- July 2019
- June 2019
- May 2019
- April 2019
- March 2019
- February 2019
- January 2019
- December 2018
- November 2018
- October 2018
- September 2018
- August 2018
- July 2018
- June 2018
- May 2018
- April 2018
- March 2018
- February 2018
- January 2018
- December 2017
- November 2017
- October 2017
- September 2017
- August 2017
- July 2017
- June 2017
- May 2017
- April 2017
- March 2017
- February 2017
- January 2017
- December 2016
- November 2016
- October 2016
- September 2016
- August 2016
- July 2016
- June 2016
- May 2016
- April 2016
- March 2016
- February 2016
- January 2016
- December 2015
- November 2015
- October 2015
- September 2015
- August 2015
- July 2015
- June 2015
- May 2015
- April 2015
- March 2015
- February 2015
- January 2015
- December 2014
- November 2014
- October 2014
- September 2014
- August 2014
- July 2014
- June 2014
- May 2014
- April 2014
- March 2014
- February 2014
- January 2014
- December 2013
- November 2013
- October 2013
- September 2013
- August 2013
- July 2013
- June 2013
- May 2013
- April 2013
- March 2013
- February 2013
- January 2013
- December 2012
- November 2012
- October 2012
- September 2012
- August 2012
- July 2012
- June 2012
- May 2012
- April 2012
- March 2012
- February 2012
- January 2012
- December 2011
- November 2011
- October 2011
- September 2011
- August 2011
- July 2011
- June 2011
- May 2011
- April 2011
- March 2011
- February 2011
- January 2011
- December 2010
- November 2010
- October 2010
- September 2010
- August 2010
- July 2010
- June 2010
- May 2010
- April 2010
- March 2010
- February 2010
- January 2010
- December 2009
- November 2009
- October 2009
- September 2009
- August 2009
- July 2009
- June 2009
- May 2009
- April 2009
- March 2009
- February 2009
- January 2009
- December 2008
- November 2008
- October 2008
- September 2008
- August 2008
- July 2008
- June 2008
- May 2008
- April 2008
- March 2008
- February 2008
- January 2008
- December 2007
- November 2007
- October 2007
- September 2007
- August 2007
- July 2007
- June 2007
- May 2007
- April 2007
- March 2007
- February 2007
- January 2007
- December 2006
- November 2006
- October 2006
- September 2006
- August 2006
- July 2006
- June 2006
- May 2006
- April 2006
- March 2006
- February 2006
- January 2006
- December 2005
- November 2005
- October 2005
- September 2005
- August 2005
- July 2005
 Eddy Elfenbein is a Washington, DC-based speaker, portfolio manager and editor of the blog Crossing Wall Street. His