Archive for 2008
-
Wall Strip on Hasbro
Eddy Elfenbein, May 27th, 2008 at 7:35 amJulie looks at Hasbro (HAS). After nine long years, the stock finally made a new all-time high recently. In 1974, you could have picked up shares of Hasbro for about 2.4 cents each. That’s adjusting for many, many splits. Not including dividends, the stock is up about 140,000% since. In other words, there’s a lot of money to be made in toys…just ask any adult male.
(Note to Julie: There’s no capital of Istanbul. It’s the capital city of Constantinople.) -
In Memoriam
Eddy Elfenbein, May 26th, 2008 at 4:36 pm
It is, in a way, an odd thing to honor those who died in defense of our country, in defense of us, in wars far away. The imagination plays a trick. We see these soldiers in our mind as old and wise. We see them as something like the Founding Fathers, grave and gray haired. But most of them were boys when they died, and they gave up two lives — the one they were living and the one they would have lived. When they died, they gave up their chance to be husbands and fathers and grandfathers. They gave up their chance to be revered old men. They gave up everything for our country, for us. And all we can do is remember.
—Ronald Reagan -
Momentum Has Lost Some Momentum
Eddy Elfenbein, May 23rd, 2008 at 11:04 pmKirzner Fervor has a great post on building a trading strategy off the stocks market’s momentum. The bottom line is that historically, it’s worked very well, but the in recent years, the advantages have dissipated. Such is the story of much data-mining.
After my initial post on the market’s ability to carry a one-day rally or sell-off into the next day, I had an emailer point out that the effect has worn off in recent years. I had meant to follow up on it, but I got distracted. Such is the story of much blogging.
I’m still amazed at the historical effect of the stock market’s momentum. To quote myself:This means that the market’s entire gain (capital gains since 1950) has come on days following a 0.64% up move. The rest of the time (over 80%), the market is net flat. Half the market’s gain came on day’s following 3.2% up moves. On average, that happens slightly less than once a year.
-
Maxine Waters Threatens to Nationalize Oil Companies
Eddy Elfenbein, May 23rd, 2008 at 1:34 pmNo, really. From the NYT:
In one of the more pointed exchanges, Representative Maxine Waters, Democrat of California, seized on the record $40.6 billion profit of Exxon Mobil in 2007. She pounded on the company’s senior vice president, J. Stephen Simon, demanding to know if gas prices would be lower if the company earned a few billion dollars less.
At another point, Ms. Waters brazenly suggested that perhaps the American oil industry should be nationalized, acknowledging that it was an “extreme step” but one that might be necessary if outsize profits and exorbitant gasoline prices continued.I have one small correction. Last year, ExxonMobil didn’t earn $40 billion, it earned $70 billion. Guess where that missing $30 billion went? I’ll give you a hint: Rep. Waters’ salary.
Here’s the video:
-
The Buy List Since 2006
Eddy Elfenbein, May 23rd, 2008 at 12:18 amI don’t think I’ve done this yet, but here’s how the Buy List has performed since I started it in 2006. I had a small Buy List in 2005, but I didn’t formalize the system until the beginning of the 2006.
The red line is the Buy List and the black line is the S&P 500. The graph is done as if it was a portfolio starting with $1 million on December 31, 2005 (dividends aren’t included). All told, we’re trailing the S&P 500, 11.70% to 9.27%. The Buy List is 1.25% more volatile than the S&P 500.
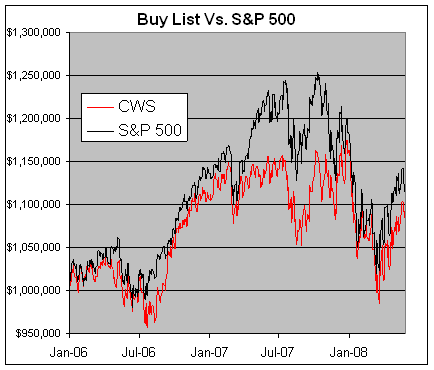
We completely missed the last leg of the rally in 2007. Fortunately, we did a lot better during the sell-off. At one point in February, we pulled even with the S&P 500.
The Buy List is a very conservative portfolio. The correlation of the daily changes with the S&P 500 is 0.83, which is pretty high. -
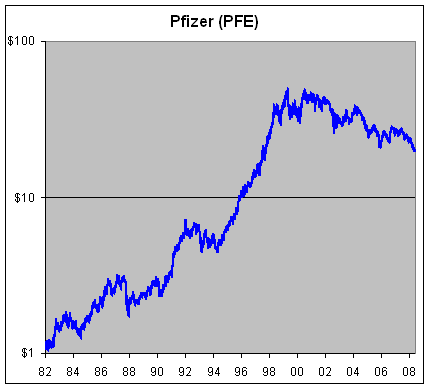
Pfizer Hits 10-Year Low
Eddy Elfenbein, May 22nd, 2008 at 4:24 pmShares of Pfizer (PFE) closed today at their lowest level since September 1997. The dividends would have given you about a 26% return. For years this was a stock that could do no wrong.
-
Do 1.3 Million People Really Make Their Living Off Ebay?
Eddy Elfenbein, May 22nd, 2008 at 9:48 amHere’s a good article from Daniel Gross. You know how eBay always says that 1.3 million people make their living off eBay. Well, it’s not exactly true.
-
How Economists Invest
Eddy Elfenbein, May 22nd, 2008 at 9:40 amCheck out how the American Economic Association structures its investment portfolio. They’re doing pretty well.
(Via: Mankiw.) -
More Than You Ever Cared to Know About P/E Ratios
Eddy Elfenbein, May 21st, 2008 at 12:40 pmI want to expound on what I said the other day about the use of Price/Earnings Ratios. It works like this, picking stocks (good), timing the market (bad).
I also criticized the idea of using P/E ratios based on ten years’ worth of earnings. Now I want to show you why.
First off, I got this historical data off Robert Shiller’s website which has monthly numbers going back 140 years.
Now I have to explain my analysis carefully, and I have to apologize because it’s not easy to do. Plus, whenever I attempt this, I get dozens of emails asking what the hell I’m talking about. (Note, dear reader, I’m criticizing my articulational abilities, not your comprehensional skillz.)
Deep breath. I take all of the monthly data of stock market returns and P/E ratios. I then resort the data, not by time, but this time by P/E ratio, highest to lowest. Then, I calculate all those individual monthly returns. Basically, it’s a stock market graph, not by time, but by declining P/E ratio.
If the P/E ratio has an impact on the market, I would expect the line to droop down early on, then rally frenetically with lower ratios. If the P/E ratio has no impact, then I expect that the line would rise in a smooth diagonal line. Here’s a look at how the 10-year and 1-year P/E Ratios stack up:
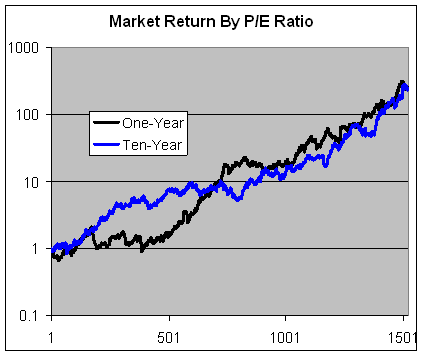
As you can see, the 1-year P/E ratio has some impact on market returns, but not much. The market shows a net loss up to the 390th data point which corresponds to a P/E ratio of about 17.8. That means that all over the market’s net gains have come when the P/E Ratio is less than 17.8. According to Shiller’s data, that’s almost the entire time since 1996.
Still, I’m not impressed by the one-year’s performance. Compare that to this dramatic graph showing the market’s performance ranked by the previous day’s gain.
The 10-year P/E has, in my opinion, almost no impact on equity prices. The blue line barely wiggles on its way down the P/E Ratio scale. Knowing what the 10-year ratio was gave you zero input on what stock prices were about to do. -
Hauser’s Law
Eddy Elfenbein, May 21st, 2008 at 10:22 amIn yesterday’s WSJ, David Ranson has a bizarre article expounding on, what he calls, Hauser’s Law, which is named in honor of economist Kurt Hauser. The law states: “No matter what the tax rates have been, in postwar America tax revenues have remained at about 19.5% of GDP.”
And the article includes this nifty chart:
Zubin Jelveh goes off on the chart because it implies that the variation in marginal rates have zero impact on the bottom line. It’s true that other taxes besides income taxes have played an increasingly significant role in U.S. tax policy. But what I understood Hauser’s Law to mean is that none of that matters. The tax code will always produce the same amount.
I’m fairly sympathetic to rules like Hauser’s Law. Especially with social sciences, I tend to believe that there situations where no matter what the rules are, they’ll produce the same results. (Some of you may recall Elfenbein’s 17th Law which states that U.S. GDP growth has been remarkably stable over the last 40 years and about 3.1%.)
The problem I have with Hauser’s Law is that it doesn’t seem to include state and local taxes, which should raise the bar by quite a lot. Also, why should we look to the nation as a whole? To find out if there’s an upper limit, I think we should look at what state has the highest rate. For that matter, perhaps we should look at foreign countries.
While tax revenues may been fairly stable over the past 50 years, that doesn’t mean we couldn’t generate more if we wanted to.
-
Archives
- June 2026
- May 2026
- April 2026
- March 2026
- February 2026
- January 2026
- December 2025
- November 2025
- October 2025
- September 2025
- August 2025
- July 2025
- June 2025
- May 2025
- April 2025
- March 2025
- February 2025
- January 2025
- December 2024
- November 2024
- October 2024
- September 2024
- August 2024
- July 2024
- June 2024
- May 2024
- April 2024
- March 2024
- February 2024
- January 2024
- December 2023
- November 2023
- October 2023
- September 2023
- August 2023
- July 2023
- June 2023
- May 2023
- April 2023
- March 2023
- February 2023
- January 2023
- December 2022
- November 2022
- October 2022
- September 2022
- August 2022
- July 2022
- June 2022
- May 2022
- April 2022
- March 2022
- February 2022
- January 2022
- December 2021
- November 2021
- October 2021
- September 2021
- August 2021
- July 2021
- June 2021
- May 2021
- April 2021
- March 2021
- February 2021
- January 2021
- December 2020
- November 2020
- October 2020
- September 2020
- August 2020
- July 2020
- June 2020
- May 2020
- April 2020
- March 2020
- February 2020
- January 2020
- December 2019
- November 2019
- October 2019
- September 2019
- August 2019
- July 2019
- June 2019
- May 2019
- April 2019
- March 2019
- February 2019
- January 2019
- December 2018
- November 2018
- October 2018
- September 2018
- August 2018
- July 2018
- June 2018
- May 2018
- April 2018
- March 2018
- February 2018
- January 2018
- December 2017
- November 2017
- October 2017
- September 2017
- August 2017
- July 2017
- June 2017
- May 2017
- April 2017
- March 2017
- February 2017
- January 2017
- December 2016
- November 2016
- October 2016
- September 2016
- August 2016
- July 2016
- June 2016
- May 2016
- April 2016
- March 2016
- February 2016
- January 2016
- December 2015
- November 2015
- October 2015
- September 2015
- August 2015
- July 2015
- June 2015
- May 2015
- April 2015
- March 2015
- February 2015
- January 2015
- December 2014
- November 2014
- October 2014
- September 2014
- August 2014
- July 2014
- June 2014
- May 2014
- April 2014
- March 2014
- February 2014
- January 2014
- December 2013
- November 2013
- October 2013
- September 2013
- August 2013
- July 2013
- June 2013
- May 2013
- April 2013
- March 2013
- February 2013
- January 2013
- December 2012
- November 2012
- October 2012
- September 2012
- August 2012
- July 2012
- June 2012
- May 2012
- April 2012
- March 2012
- February 2012
- January 2012
- December 2011
- November 2011
- October 2011
- September 2011
- August 2011
- July 2011
- June 2011
- May 2011
- April 2011
- March 2011
- February 2011
- January 2011
- December 2010
- November 2010
- October 2010
- September 2010
- August 2010
- July 2010
- June 2010
- May 2010
- April 2010
- March 2010
- February 2010
- January 2010
- December 2009
- November 2009
- October 2009
- September 2009
- August 2009
- July 2009
- June 2009
- May 2009
- April 2009
- March 2009
- February 2009
- January 2009
- December 2008
- November 2008
- October 2008
- September 2008
- August 2008
- July 2008
- June 2008
- May 2008
- April 2008
- March 2008
- February 2008
- January 2008
- December 2007
- November 2007
- October 2007
- September 2007
- August 2007
- July 2007
- June 2007
- May 2007
- April 2007
- March 2007
- February 2007
- January 2007
- December 2006
- November 2006
- October 2006
- September 2006
- August 2006
- July 2006
- June 2006
- May 2006
- April 2006
- March 2006
- February 2006
- January 2006
- December 2005
- November 2005
- October 2005
- September 2005
- August 2005
- July 2005
 Eddy Elfenbein is a Washington, DC-based speaker, portfolio manager and editor of the blog Crossing Wall Street. His