Archive for 2008
-
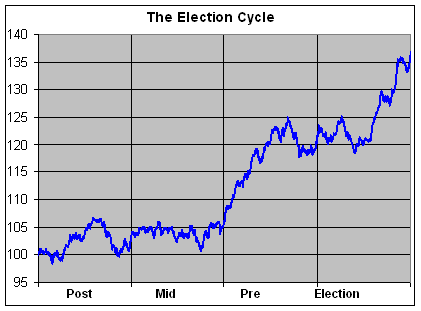
Turning Point in the Presidential Election Cycle
Eddy Elfenbein, May 19th, 2008 at 10:13 amI don’t place a great deal of faith in these indicators, but we’re nearing a traditional low point in the Presidential Election Cycle.
On average, the Dow is fairly weak from the September 6 of a pre-election year to May 28 of the election. Over that time, the Dow averages a loss of -5.2%. That may not sound like a lot but it’s an average of the entire Dow from 1896 to 2007.
After May 28, the Dow gains an average of 15.2% by the end of the year.
-
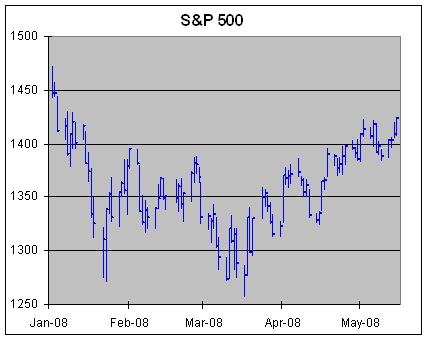
S&P 500 at 19-Week High
Eddy Elfenbein, May 16th, 2008 at 10:29 amYesterday, the S&P 500 closed at 1423.57. That’s the highest close since January 3. It’s also 11.8% above the lowest close of the year, which came on March 10.
Also, has anyone noticed that Nicholas Financial (NICK) is above $7 a share?
With yesterday’s close, the S&P 500’s P/E ratio is at 18.3. That’s the highest level in four years. One small caveat. The P/E ratio often bumps up when the market is a good buy because the earnings are backwards-looking and prices are forward-looking. Trailing earnings are still heading down, but stock prices are up sharply, hence a higher earnings multiple.

-
The Buy List Year to Date
Eddy Elfenbein, May 15th, 2008 at 1:46 pm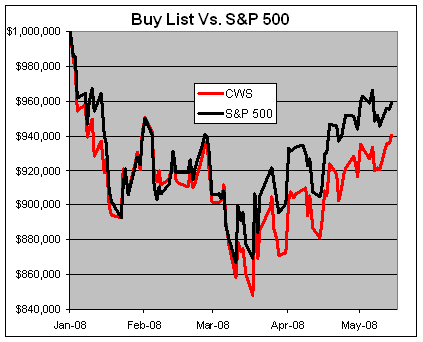
Through yesterday, the Crossing Wall Street Buy List is down -5.96% YTD. The S&P 500 is down -4.07%. That doesn’t include dividends. The volatility of the Buy List is about 4% greater than the S&P 500. -
Tim Brown — Stock Analyst
Eddy Elfenbein, May 15th, 2008 at 12:35 pm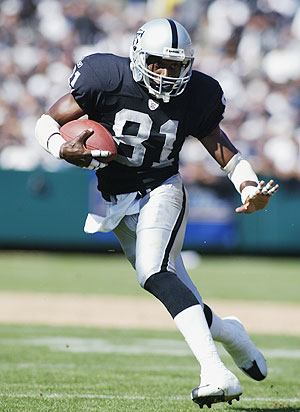
Former Heisman Trophy winner, Tim Brown, is now (like me), a columnist at TheStreet.com. (Editors note, for clarification, I’ve never won the Heisman.) Here’s a sample from Tim’s debut column:I am starting with the best of the best: Microsoft. Not only is this a world-class company, it is a steal at this price. It closed at $29.39 on Friday and is much closer to its 52-week low ($26.87) than it is to its high ($37.50).
The idea behind my picks is just like my approach on the field: find a weakness and exploit it. On the football field, I would look for any advantage I could get on the opposing cornerback. In this case, the weakness is not with the company, but rather with Wall Street’s valuation of the company. The Street has unfairly picked on Microsoft, and we will pounce on this opportunity. Not long ago, Microsoft was trading at approximately $35.00. -
Oil and the Price at the Pump
Eddy Elfenbein, May 15th, 2008 at 12:05 pmThis chart is courtesy of GasBuddy.com:

It’s hard to believe that gas was around $2.15 only 16 months ago. -
Bernanke was Right
Eddy Elfenbein, May 15th, 2008 at 11:30 amBefore selling off in the afternoon yesterday, the stock market came close to finishing at its highest point since the very beginning of the year. Since March 17, the S&P 500 has gained over 10%. Not bad for two months’ work.
I think this is a good opportunity to ask if Ben Bernanke’s policies were right, and his actions helped alleviate the worst of the recent credit crunch.
Let me add that I don’t necessarily believe this, and it’s way too early to judge, but now is a good time to take a step back and look at the evidence. Let’s make the argument in his favor and see how well it stacks up. If Bernanke was correct, then his handling of this mess would be far superior to anything handle by the overrated maestro, Alan Greenspan.
Most of the superficial evidence suggests that the financial outlook is much better than it was two months ago. Stock prices are up. Gold is down. Volatility is way down. The microscopic yields on short-term Treasuries have somewhat faded. Inflation is still moderate. Or I should say, the government’s inflation reports are still quite moderate. Best of all, the initial estimate for first-quarter GDP wasn’t nearly as bad as the worst that bears were expecting.
None of these points, by itself, confirms Bernanke’s actions, but taken together, they do give the Fed a nice case to rest on. Let me again say that this isn’t an argument for an economic resurgence, but it’s looking at the worst that we had during the credit crunch. As for me, I don’t care too much for the arcana of monetary policy. If it works, I’m for it.
The weekend of March 15-16 was when we learned that Bear Stearns had gone under and was sold to JPMorgan Chase for $2 a share. This was later bumped up to $10 a share. On Monday, March 17, the S&P 500 dropped to 1276.60, which was just above its closing low from the week before. Then on Tuesday, the Federal Reserve cut interest rates by 75 basis points, which brought the Fed Funds target down to 2.25%. That Dow soared over 420 on Tuesday.
To understand Ben Bernanke is to realize that he’s a student of the Great Depression. For economists, the Depression has long been a puzzle. Why did everything go so badly all at once? According to theory, it wasn’t supposed to happen. That’s the difficulty is that to understand the Depression, you need to discard your textbooks.
On the occasion of Milton Friedman’s 90th birthday, Bernanke said:Let me end my talk by abusing slightly my status as an official representative of the Federal Reserve. I would like to say to Milton and Anna: Regarding the Great Depression. You’re right, we did it. We’re very sorry. But thanks to you, we won’t do it again.
The reason why Bernanke was saluting Friedman and Anna Schwartz, was that they were the ones who pinpointed the role that the Fed played during the Great Depression. According to Friedman, the Depression started off as a garden variety recession, but the Fed allowed the money supply to contract by one-third. This turned the recession into a Great Depression. When their theory first appeared in the 1960s, it was quite controversial. The inflation of the 1970s gave monetarism much more credibility, and by 1976, Friedman had won the Nobel Prize.
According to Milton Friedman, one of the key moments of the Depression came in late 1930. There was run on the Bank of United States. By the way, I didn’t leave out an article, that’s the correct name of the bank, the Bank of United States. It was named that way to fool immigrants into believing that the bank was backed by the government.
The bank was allowed to fail, and bank runs then multiplied. As the banks failed, the money supply shrank. It’s as if the Fed raised rates, which is the opposite of what they should have done. According to Friedman, the Bank of United States was in bad shape, but it wasn’t that bad. Depositors eventually received 94 cents on the dollar. Bad, but not awful.
Let’s jump ahead 78 years. You can see why Bernanke was so concerned about Bears’ failure. The idea of a bank run is perfectly analogous to the issue facing a collapse of bear, but there is the issue of counter-party risk. We should also discuss the issue of whether Bear was bailed out. We often hear about the socializing or risk and the privatization of profit. Let’s recall that in the United States, a great deal of profits, up to 35%, is already socialized. Also, selling a bank of $2 a share can hardly be called a bailout. Though I do have an issue with the Fed backing JPMorgan’s purchase of Bears’ more questionable assets. The environment between now and then speaks for itself.
In March, gold reached an all-time high of $1,033 an ounce. Since then, the yellow metal has backed off to less than $890. At one point on March 20, the yield on the three-month Treasury bill got down to 0.2%. That’s not a misprint. That means that the government could borrow $200,000 for roughly $1 a day. So even though there were complaints of cutting rates too much, market forces were happy to go even lower.
The Fed has for the time being, stopped at 2%. T-bill rates have now risen to roughly 1.8%.
The VIX, which measures implied volatility, has recently dropped below 20. On March 17, it got to 35.6.
I’m not ready to give Bernanke a passing grade just yet, but I happily concede that the worst of the storm has passed. -
Whole Foods Bombs Again
Eddy Elfenbein, May 15th, 2008 at 10:15 am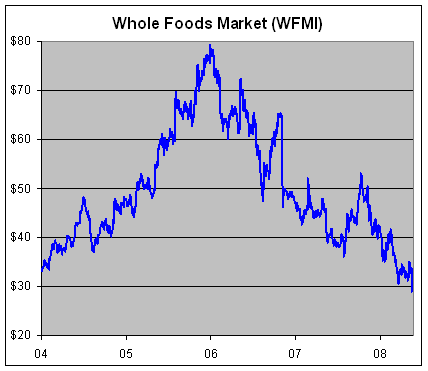
Whole Foods (WFMI) dropped 14% yesterday on lousy same-store sales results. The stock hit a four-year low.For the quarter ended April 13, Whole Foods reported comparable-store sales — or sales at stores open at least one year — increased 6.7% from a year-earlier.
In a research note, Citigroup analyst Gregory Badishkanian said investors probably expected Whole Foods to report comparable-store sales growth of between 8% and 9%.
In recent years, Whole Foods had grown its comparable-store sales at rates in the high single digits to low double digits. But analysts said it looks like that growth is easing as the company rebrands Wild Oats stores acquired last August and opens new stores.This latest bombshell comes less than a year after it was revealed that John Mackey was posting on the Yahoo message boards.
In late 2005, I first called out Whole Foods’ outlandish valuation:I’m a big fan of Whole Food Market (WFMI), but this stock is way, WAY over-priced. Last quarter, the company missed earnings by a penny a share. In the past few weeks, Wall Street has lowered this fiscal year’s consensus earnings estimate to $2.86 a share, and the stock is still trading at 53 times that. That’s almost as much as Google (GOOG)!
Look, I like organic kumquats as much as the next guy, but let’s be reasonable. Whole Foods’ earnings will probably grow by about 17%-20%. Not bad at all. The stock, however, is already up over 60% this year.
A stock can’t go up faster than its earnings indefinitely. At some point, something’s gotta give. That’s not finance, it’s physics. Right now, the stock is going up because it’s going up. The price and fundamentals have politely parted company. On Friday, shares of Whole Foods closed at another all-time high. -
How Many Times Do I Have to Say it?
Eddy Elfenbein, May 13th, 2008 at 2:02 pmThe WSJ does it again. Every time someone comments on political markets, they have to say that these markets “fail” because the a contract going for over $0.50 didn’t pan out.
John McCain’s presidential campaign is doomed — at least, if you still believe what political futures markets indicate.
At the Irish electronic exchange Intrade, on which people bet on election outcomes and other events, the futures market suggests Mr. McCain has a 38% chance of becoming the 44th president. In the Iowa Electronic Markets, set up at the University of Iowa, Mr. McCain’s Republican Party gets a 41% chance of winning the popular vote for the White House.No. No. No.
They’re NOT predictions markets, they’re odds-setting markets. That’s something quite different. A 38% chance of winning is not a doomed campaign. I think a baseball player who’s batting .380 would be doing pretty well.
Google IPO’d at $85, today it’s at $585. That’s a $500 miss. Did the market fail? No, they adapted to new information.
As I’ve said several times before, these market are really just for fun and should be seen as nothing more than that.
Still, I don’t understand how people can so often miss this basic fact about the political markets. The markets move with new information. It doesn’t mean that a favored outcome is correct or incorrect. That’s not what the markets are trying to do. They’re trying to analyze new information as quickly as possible. They usually, but not always, do a pretty good job. -
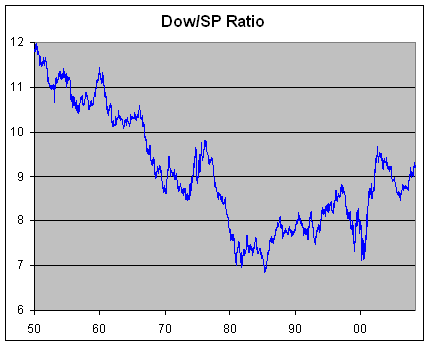
The Dow/S&P 500 Ratio
Eddy Elfenbein, May 13th, 2008 at 1:03 pmImagine if the Dow was 3,000 points higher than it is today. That’s where it would be if it had merely kept pace with the S&P 500 over the last few decades.
The Dow used to be about 10 or 11 times the S&P 500 (I’m referring to the index number, not market cap), but the ratio slowly sank for a long time.
The Dow/S&P 500 hit its low point in 1985 when the Dow was less than seven times the S&P. Since then, the Dow has had a bit of a comeback. In 2002, the ratio broke 9.5 for the first time in over 25 years.
After falling back some from 2002 to 2004, the Dow has outpaced the S&P 500 over the last two years.
-
Is Open Source Good for a Companies Stock?
Eddy Elfenbein, May 13th, 2008 at 11:02 amOliver Alexy looks at the impact of open source on a company’s shares:
But does giving ideas away help — or hurt — the company’s stock price? Will investors reward openness by driving up the company’s shares — or punish it by knocking the stock down?
Looking for News
To find out, I analyzed companies’ stock performance before and after they announced that they were making proprietary software open-source.
First, I searched through news releases from January 1999, shortly after the start of the open-source movement, to April 2007, looking for announcements that fit the bill. I then weeded out a number of companies, mostly because their announcements contained other news that might affect the stock price. That left 38 announcements from 30 companies.
Next, I analyzed the companies’ stock performance for 125 days prior to the announcement — to get a baseline for performance — and then watched the stock activity the day before the announcement and the day of the announcement. (I looked at the day before in case the markets had anticipated the news.)
Make It Clear
The results? Companies saw their stock price rise if they met one crucial condition: explaining how they expected their open strategy to bring in short-term revenue. Companies that clearly communicated a short-term revenue model saw an average stock-price increase of 1.6%. Companies that didn’t saw an average decline of 1.6%.That’s interesting though I’m a little uneasy about the robustness of that survey. It would be interesting to see if there could be more research done on a broader scale.
-
Archives
- June 2026
- May 2026
- April 2026
- March 2026
- February 2026
- January 2026
- December 2025
- November 2025
- October 2025
- September 2025
- August 2025
- July 2025
- June 2025
- May 2025
- April 2025
- March 2025
- February 2025
- January 2025
- December 2024
- November 2024
- October 2024
- September 2024
- August 2024
- July 2024
- June 2024
- May 2024
- April 2024
- March 2024
- February 2024
- January 2024
- December 2023
- November 2023
- October 2023
- September 2023
- August 2023
- July 2023
- June 2023
- May 2023
- April 2023
- March 2023
- February 2023
- January 2023
- December 2022
- November 2022
- October 2022
- September 2022
- August 2022
- July 2022
- June 2022
- May 2022
- April 2022
- March 2022
- February 2022
- January 2022
- December 2021
- November 2021
- October 2021
- September 2021
- August 2021
- July 2021
- June 2021
- May 2021
- April 2021
- March 2021
- February 2021
- January 2021
- December 2020
- November 2020
- October 2020
- September 2020
- August 2020
- July 2020
- June 2020
- May 2020
- April 2020
- March 2020
- February 2020
- January 2020
- December 2019
- November 2019
- October 2019
- September 2019
- August 2019
- July 2019
- June 2019
- May 2019
- April 2019
- March 2019
- February 2019
- January 2019
- December 2018
- November 2018
- October 2018
- September 2018
- August 2018
- July 2018
- June 2018
- May 2018
- April 2018
- March 2018
- February 2018
- January 2018
- December 2017
- November 2017
- October 2017
- September 2017
- August 2017
- July 2017
- June 2017
- May 2017
- April 2017
- March 2017
- February 2017
- January 2017
- December 2016
- November 2016
- October 2016
- September 2016
- August 2016
- July 2016
- June 2016
- May 2016
- April 2016
- March 2016
- February 2016
- January 2016
- December 2015
- November 2015
- October 2015
- September 2015
- August 2015
- July 2015
- June 2015
- May 2015
- April 2015
- March 2015
- February 2015
- January 2015
- December 2014
- November 2014
- October 2014
- September 2014
- August 2014
- July 2014
- June 2014
- May 2014
- April 2014
- March 2014
- February 2014
- January 2014
- December 2013
- November 2013
- October 2013
- September 2013
- August 2013
- July 2013
- June 2013
- May 2013
- April 2013
- March 2013
- February 2013
- January 2013
- December 2012
- November 2012
- October 2012
- September 2012
- August 2012
- July 2012
- June 2012
- May 2012
- April 2012
- March 2012
- February 2012
- January 2012
- December 2011
- November 2011
- October 2011
- September 2011
- August 2011
- July 2011
- June 2011
- May 2011
- April 2011
- March 2011
- February 2011
- January 2011
- December 2010
- November 2010
- October 2010
- September 2010
- August 2010
- July 2010
- June 2010
- May 2010
- April 2010
- March 2010
- February 2010
- January 2010
- December 2009
- November 2009
- October 2009
- September 2009
- August 2009
- July 2009
- June 2009
- May 2009
- April 2009
- March 2009
- February 2009
- January 2009
- December 2008
- November 2008
- October 2008
- September 2008
- August 2008
- July 2008
- June 2008
- May 2008
- April 2008
- March 2008
- February 2008
- January 2008
- December 2007
- November 2007
- October 2007
- September 2007
- August 2007
- July 2007
- June 2007
- May 2007
- April 2007
- March 2007
- February 2007
- January 2007
- December 2006
- November 2006
- October 2006
- September 2006
- August 2006
- July 2006
- June 2006
- May 2006
- April 2006
- March 2006
- February 2006
- January 2006
- December 2005
- November 2005
- October 2005
- September 2005
- August 2005
- July 2005
 Eddy Elfenbein is a Washington, DC-based speaker, portfolio manager and editor of the blog Crossing Wall Street. His