Archive for 2013
-
ADP Reports Jobs Gain of 166,000
Eddy Elfenbein, October 2nd, 2013 at 12:15 pmADP, the private payroll firm, reported that the economy created 166,000 new jobs last month. This comes ahead of Friday’s big jobs report from the government. The ADP report has a mixed record of predicting the government’s numbers. Economists were expecting ADP to report 180,000 new jobs, so the miss is probably weighing on today’s market. ADP also revised its August jobs number down by 17,000.
While the stock market rose yesterday, as it has on many first days of the month this year, it’s giving back about half that gain today. Energy is the only sector that’s great while staples and industrials are down the most.
There are a few items to pass on about our Buy List stocks:
Some Microsoft (MSFT) investors are trying to get Bill Gates out as chairman of Microsoft. Given how many shares he owns, Bill can largely do whatever he wants. But if Gates is more interested in philanthropy, then he may want to leave as chairman so he can focus on giving away his fortune full time. It’s not a bad idea, and the investors are probably right. My view is that the stock would most likely rise on such an announcement, so that’s why I’d support it.
There’s also been talking of Alan Mulally leaving Ford (F) to become CEO of Microsoft. I doubt that would happen. Mulally seems happy where he is and the Ford turnaround is still unfolding. Also, Mulally is 68. MSFT needs to find an energetic, young CEO.
-
Volatility Falls to Seven-Year Low
Eddy Elfenbein, October 2nd, 2013 at 9:03 amFor all the problems on Wall Street, in Washington and around the world, the stock market has been quite calm recently. This last quarter was the least volatile in seven years.
The average daily change for the Standard & Poor’s 500 Index narrowed to 0.45 percent in the third quarter, the smallest since the end of 2006, data compiled by Bloomberg show. The Chicago Board Options Exchange Volatility Index slid 8.3 percent since June 28, a retreat that coincided with a 5.3 percent advance in the S&P 500 and a 39 percent windfall for investors who used an exchange-traded note that bets against equity swings.
U.S. stock fluctuations are narrowing as investors become more confident that the four-year bull market is sustainable, corporate profits top all-time highs and growth in China and Europe show signs of strengthening. The Fed this month refrained from slowing its monthly bond buying, saying it needs more evidence of an improvement in the American labor market.
“Toward the end of August everyone was geared up for the first tapering from the Fed and a market sell-off, but it didn’t happen,” Justin Golden, a partner at Lake Hill Capital Management LLC, said via phone on Sept. 27. The New York-based hedge fund trades options on equity indexes and commodities. “People think the markets are pretty smooth sailing for the next few months.”
Here’s a look at the daily changes in the S&P 500 going back a few years. You can see just how erratic things were during the financial crisis, and again during the great freakout of 2011.
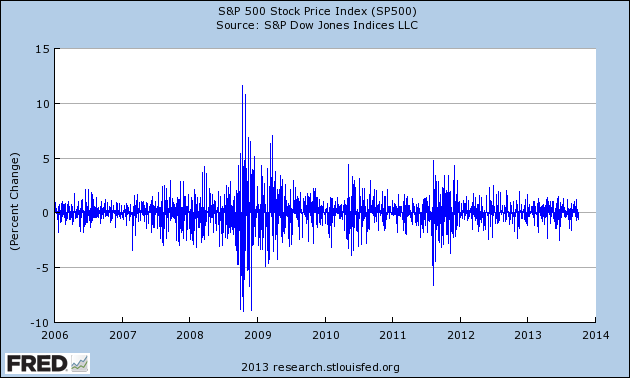
From 2008 through 2010, the S&P 500 rose 1.5% or more 103 times. It’s happened just once this year, on the first trading day of the year.
-
Morning News: October 2, 2013
Eddy Elfenbein, October 2nd, 2013 at 6:55 amChina Faces Steep Climb to Exploit Its Shale Riches
How Oil Reforms Could Trigger Mexico’s Biggest Economic Boom In A Century
Sweden Faces its Own Shutdown: Cause? Jellyfish
Crude Oil Trades Near Two-Month Lows Ahead of Inventory Data
Treasury Taking Final Steps to Avoid Default
Dollar Seen as Shutdown Loser as Growth Hit Spurs QE
Businesses Are Feeling Effect of Partial Government Shutdown
SAP Ventures Raises $650 Million Fund as IPOs Increase
Icahn Pushes Apple CEO for $150 Billion Share Buyback
New York to Sue Wells Fargo Over Mortgage Settlement
The Popular ‘Risk Parity’ Asset Allocation Strategy Has 2 Fundamental Flaws
The Reformed Broker: The Forward Earnings Outlook With Brian Gilmartin
Pragmatic Capitalism: Government Shuts Down – Markets Rally?
Be sure to follow me on Twitter.
-
Dividends Rose 14.64% in Q3
Eddy Elfenbein, October 1st, 2013 at 3:56 pmDividends had another good quarter for Q3. The S&P 500 paid out 14.64% more in dividends than in last year’s Q3.
So far, dividends are running 14.14% ahead of last year’s pace. Q4, however, will be a tough comp because of the rush to payout dividends last year ahead of higher taxes. Still, the payout for Q3 of this year nearly topped last year’s Q4.
Before we’re done, the dividends paid out in 2013 will probably be more than 50% higher than what was paid out in 2010. That’s remarkable.
The dividend payout ratio for the last four quarters is now just over 33%. Except for the depths of the financial crisis, that’s the highest ratio in more than 10 years. (During the financial crisis, the ratio climbed not due to higher dividends but to plunging earnings.)
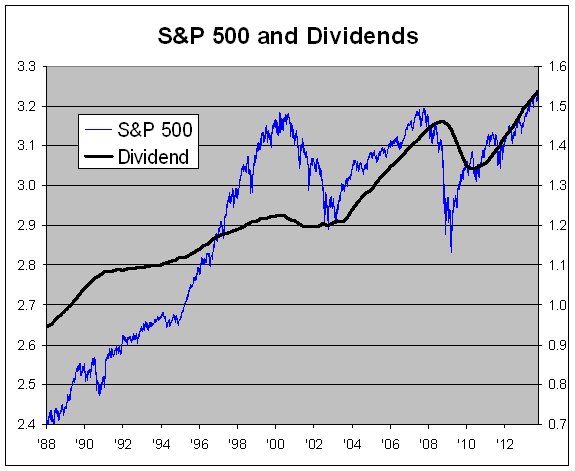
I’ve mentioned this before, but I’m amazed at how steady the market’s dividend yield has been over the last decade. It’s largely hovered between 1.7% and 2.3%. The yield spiked over 4% during the financial crisis, but settled back near 2%.
Despite the fancy metrics people used, all you needed to do was take the amount of dividends paid out in the last year and multiply by 50. That would have gotten you a very good estimate of where the S&P 500 would be.
Here’s a log chart of the S&P 500 (blue line, left scale) along with its dividends (black line, right scale). I scaled the two lines by a log difference of 1.7 which is just over 50. In other words, whenever the lines cross, the dividend yield is 2%.
-
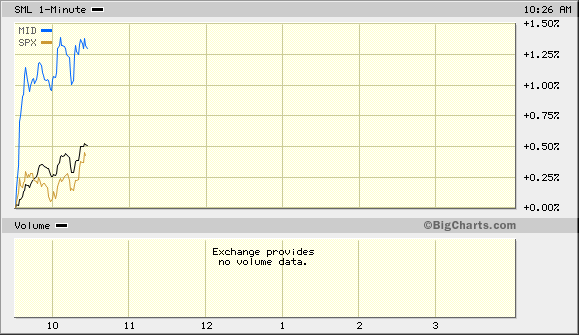
Strong Mid-Cap Outperformance
Eddy Elfenbein, October 1st, 2013 at 10:29 amHere’s something unusual. Mid-cap stocks are strongly outperforming small- and large-caps today. Mid-caps usually fall in the middle of the two, as you would expect.
I can’t remember another time when the middies were so far from the pack. Perhaps the index is unduly influenced by a few sectors that are up today.
-
September ISM = 56.2
Eddy Elfenbein, October 1st, 2013 at 10:07 amGood morning and welcome to anarchy! Well, not complete anarchy, but we do have a partial government shutdown. I’m not sure how long this will last but it’s unpleasant to watch our dysfunctional political process.
On to today’s market. We had a good read for today’s ISM. The number came in at 56.2. Any number above 50 indicates an expansion. Below 50 is a contraction. This is the third month in a row that the ISM has topped 55.
Two academics have a method for calculating the odds of a recession. The latest update was this morning, but that’s off of July’s data. In any event, they peg the odds of a recession at 1.34%.
Shares of AFLAC ($AFL) are having a good day. The stock was upgraded by FBR Capital. They also raised their price target to $70 per share. AFL has been as high as $63.30 today. The 52-week high is $63.63.
Ford ($F) just reported another strong month for sales. Last month was their best month in seven years.
The biggest sales driver was the continuing boom in pickup truck sales, with the F-Series trucks posting a fifth consecutive month of more than 60,000 sales.
The redone Fusion mid-size sedan also continued its strong year with sales up 62% to 19,972, while the Fiesta subcompact was up 29% to 5,043 — and Ford said these cars were building sales in markets where Ford has been week in the past.
“We’re particularly encouraged by the strength of the Fusion and Fiesta, especially in coastal markets,” said Ken Czubay, U.S. sales head, in a statement.
Ford said Fusion retail sales were up 59% in the West and 26% in the Southeast, while Fiesta is up 41% in the West.
Continuing to show signs of life for the nearly moribund Lincoln brand, the new MKZ sedan sold 2,874, up 12%, adding a fifth monthly best, Ford said.
The stock is back above $17 this morning. Look for another good earnings report later this month.
-
Morning News: October 1, 2013
Eddy Elfenbein, October 1st, 2013 at 6:50 amEuro Zone Factory Growth Eases But Strong Demand Enables Price Hikes
Abe Orders Japan’s First Sales-Tax Increase Since ’97
Vatican Bank Discloses Annual Earnings Report for First Time
The Federal Government Shuts Down For The First Time In 17 Years
U.S. Stock-Index Futures Advance as Government Shutdown Begins
The One Word Missing From All Those Obamacare Ads
Google Moves Nearer to Search Deal with EU
Twitter’s ‘Stealth IPO’ Shines Spotlight on JOBS Act’s Effects
Ikea to Sell $9,200 Solar-Panel Kits in All U.K. Stores
Buffett’s Berkshire Set To Get Nearly $2.15 Billion Of Goldman Stock
JPMorgan Insider Helps Justice Department in Probe
Sugar Industry Highlights Conflicts Over Trade Pacts and Land
Do NFL Underdogs Consistently Beat the Spread?
Joshua Brown: 10 Terms Investment Pros Use to Raise Money
Credit Writedowns: QE: Exit-path Implications for Collateral Chains
Be sure to follow me on Twitter.
-
Final Q3 Numbers
Eddy Elfenbein, September 30th, 2013 at 4:37 pmThe third quarter is on the books. For the year, the S&P 500 is up 17.91% while our Buy List is up 24.12%. Including dividends, the S&P 500 is up 19.79% and our Buy List is up 25.57%.
If we hold on for three more months, it will be our seventh-straight market-beating year.
Our #1 performer is Moog (up 42.99%). Second is Bed Bath & Beyond (38.37%). Six of our stocks are up more than 30%, and 13 are up more than 20%. The worst stock, and our only loser, is Oracle (-0.45%).
The “beta” of our Buy List is 1.0035, and the daily correlation with the S&P 500 is 93.2%. At an annualized rate, the return from dividends of the S&P 500 is a bit more than our Buy List: 2.13% to 1.55%.
The combined 7-3/4 years of our Buy List is up 103.8% to the S&P 500’s 58.90%. (That would be rebalanced every year.)
-
The Close Race Between Stocks and Bonds
Eddy Elfenbein, September 30th, 2013 at 1:26 pmHere’s a graph that tells a lot and every investor should remember this lesson. The following chart shows the total return of stocks (blue) along with the total return of long-term corporate bonds (red). The data begins in October 1986.
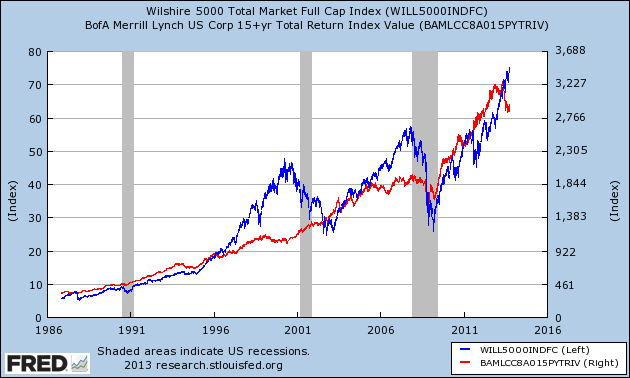
What you can see is that the two lines follow each other pretty closely. Over the last 27 years, stocks and long-term bonds have performed about the same. Despite stocks running ahead of bonds in 1987, the late 1990s and again last decade, the two lines have always come back together.
-
Q3 Earnings Preview
Eddy Elfenbein, September 30th, 2013 at 11:16 amThere are only a few hours left in Q3. Wall Street’s consensus for the S&P 500’s earnings is down to $26.85. That’s down from $29.10 one year ago, and $30.27 eighteen months ago.
Despite the reduced estimate, if Wall Street hits it, that would be growth of 11.88% which would be the strongest in two years.
For Q2, the S&P 500 earned $26.36 which was up only 3.66% from the year before. That was the second-straight quarter of growth for the index. Both quarters in the latter half of 2012 saw earnings declines. There was a lot of talk of an earnings recession but it was more accurately a very modest decline.
Analysts currently peg full-year earnings for the S&P 500 at $107.87. For next year, they see earnings of $121.90.
-
Archives
- July 2026
- June 2026
- May 2026
- April 2026
- March 2026
- February 2026
- January 2026
- December 2025
- November 2025
- October 2025
- September 2025
- August 2025
- July 2025
- June 2025
- May 2025
- April 2025
- March 2025
- February 2025
- January 2025
- December 2024
- November 2024
- October 2024
- September 2024
- August 2024
- July 2024
- June 2024
- May 2024
- April 2024
- March 2024
- February 2024
- January 2024
- December 2023
- November 2023
- October 2023
- September 2023
- August 2023
- July 2023
- June 2023
- May 2023
- April 2023
- March 2023
- February 2023
- January 2023
- December 2022
- November 2022
- October 2022
- September 2022
- August 2022
- July 2022
- June 2022
- May 2022
- April 2022
- March 2022
- February 2022
- January 2022
- December 2021
- November 2021
- October 2021
- September 2021
- August 2021
- July 2021
- June 2021
- May 2021
- April 2021
- March 2021
- February 2021
- January 2021
- December 2020
- November 2020
- October 2020
- September 2020
- August 2020
- July 2020
- June 2020
- May 2020
- April 2020
- March 2020
- February 2020
- January 2020
- December 2019
- November 2019
- October 2019
- September 2019
- August 2019
- July 2019
- June 2019
- May 2019
- April 2019
- March 2019
- February 2019
- January 2019
- December 2018
- November 2018
- October 2018
- September 2018
- August 2018
- July 2018
- June 2018
- May 2018
- April 2018
- March 2018
- February 2018
- January 2018
- December 2017
- November 2017
- October 2017
- September 2017
- August 2017
- July 2017
- June 2017
- May 2017
- April 2017
- March 2017
- February 2017
- January 2017
- December 2016
- November 2016
- October 2016
- September 2016
- August 2016
- July 2016
- June 2016
- May 2016
- April 2016
- March 2016
- February 2016
- January 2016
- December 2015
- November 2015
- October 2015
- September 2015
- August 2015
- July 2015
- June 2015
- May 2015
- April 2015
- March 2015
- February 2015
- January 2015
- December 2014
- November 2014
- October 2014
- September 2014
- August 2014
- July 2014
- June 2014
- May 2014
- April 2014
- March 2014
- February 2014
- January 2014
- December 2013
- November 2013
- October 2013
- September 2013
- August 2013
- July 2013
- June 2013
- May 2013
- April 2013
- March 2013
- February 2013
- January 2013
- December 2012
- November 2012
- October 2012
- September 2012
- August 2012
- July 2012
- June 2012
- May 2012
- April 2012
- March 2012
- February 2012
- January 2012
- December 2011
- November 2011
- October 2011
- September 2011
- August 2011
- July 2011
- June 2011
- May 2011
- April 2011
- March 2011
- February 2011
- January 2011
- December 2010
- November 2010
- October 2010
- September 2010
- August 2010
- July 2010
- June 2010
- May 2010
- April 2010
- March 2010
- February 2010
- January 2010
- December 2009
- November 2009
- October 2009
- September 2009
- August 2009
- July 2009
- June 2009
- May 2009
- April 2009
- March 2009
- February 2009
- January 2009
- December 2008
- November 2008
- October 2008
- September 2008
- August 2008
- July 2008
- June 2008
- May 2008
- April 2008
- March 2008
- February 2008
- January 2008
- December 2007
- November 2007
- October 2007
- September 2007
- August 2007
- July 2007
- June 2007
- May 2007
- April 2007
- March 2007
- February 2007
- January 2007
- December 2006
- November 2006
- October 2006
- September 2006
- August 2006
- July 2006
- June 2006
- May 2006
- April 2006
- March 2006
- February 2006
- January 2006
- December 2005
- November 2005
- October 2005
- September 2005
- August 2005
- July 2005
 Eddy Elfenbein is a Washington, DC-based speaker, portfolio manager and editor of the blog Crossing Wall Street. His