Archive for 2013
-
Morning News: April 11, 2013
Eddy Elfenbein, April 11th, 2013 at 7:24 amChina’s March Passenger Vehicle Sales Gain 13% on Discounts
U.S. Efforts to Regulate Consultants Face Big Obstacles
Obama Meets With Blankfein, Dimon and Moynihan Today
Plosser Calls for Reducing QE Pace Citing Gains in Labor Market
FHA May Need $943-Million Bailout
Goldman Sachs, Citigroup, Received Fed Minutes Early
Seeking Relief, Banks Shift Risk to Murkier Corners
Housing Juggernaut Seen Spurring 500,000 New U.S. Workers
Toyota Joins Honda, Nissan in Car Recall on Airbag Fault
Roche First-Quarter Revenue Rises on U.S. Tamiflu Sales
Foxconn’s Sales Slump Could Foreshadow Apple (AAPL) Earnings
ConocoPhillips Halts 2014 Alaskan Arctic Drilling Plans
Phil Pearlman: Best of StockTwits Charts: Bitcoin Crashes Edition
Credit Writedowns: Japan: Taking QE to a Whole New Level
Be sure to follow me on Twitter.
-
BBBY’s Planning Assumptions for 2013
Eddy Elfenbein, April 10th, 2013 at 10:02 pmFrom Bed Bath & Beyond‘s ($BBBY) earnings call, here are their planning assumptions for 2013.
One, including the 3 stores opened to date, we currently anticipate opening approximately 45 stores across all our concepts, with the possibility of some of those pushing into the first quarter of fiscal 2014. As always, we remain flexible to take advantage of real estate opportunities that may arise.
Two, we expect to continue our program of relocating, remodeling, renovating and expanding a number of our stores during fiscal 2013.
Three, capital expenditures for fiscal 2013 are planned to be in the range of approximately $350 million, which of course remains subject to the timing and composition of projects. Projected capital expenditures, which include World Market and Linen Holdings for the full year, are primarily for new stores, existing store refurbishments and information technology enhancements such as launching our new websites by the end of the fiscal second quarter, upgrading our mobile sites and apps, enhancing network communications in our stores, implemented point-of-sale improvements and building, equipping and staffing our new IT Data Center to support our ongoing technology initiatives.
Four, we are modeling an increase of 2% to 4% in comparable store sales for the first quarter and for the full year.
Five, taking into account that the prior year was a 53-week year, and including our newly acquired companies, we are modeling consolidated net sales to increase by 17% to 19% for the first quarter and approximately 5% to 7% for the full year.
Six, depreciation for fiscal 2013 is expected to be approximately $220 million.
Seven, assuming these sales levels, modeling a continuation of the shift in the mix of merchandise sold to lower margin categories, an increase in coupon redemptions, the incremental operating costs associated with our initiatives and the consolidation of World Market and Linen Holdings, we are modeling operating profit as a percentage of net sales to deleverage for the first quarter. We also anticipate operating profit margin as a percentage of net sales to deleverage for the full year.
Eight, our annual interest line will include approximately $8.7 million in World Market interest expense, substantially resulting from the inclusion of sale-leaseback obligations related to its distribution centers.
Nine, we expect to generate positive operating cash flow and to continue to fund operations entirely from internally generated sources.
Ten, we plan to continue to repurchase shares under our $2.5 billion repurchase program, which we estimate to be completed by the end of fiscal 2015. However, this repurchase program may be influenced by several factors, including business and market conditions.
Based on these and other planning assumptions, including a tax rate that is approximately 400 to 500 basis points higher than in the fiscal first quarter of fiscal 2012, we are modeling net earnings per diluted share to be approximately $0.88 to $0.94 for the fiscal first quarter of 2013.
For the 52 weeks of fiscal 2013, including the incrementally higher tax rate assumption, we are modeling net earnings per diluted share to increase by a mid-single digit to a low-double-digit percentage range over the 53 weeks of fiscal 2012.
-
Bed Bath & Beyond Earns $1.68 Per Share
Eddy Elfenbein, April 10th, 2013 at 4:21 pmFor Q4, Bed Bath & Beyond ($BBBY) earned $1.68 per share. Three months ago, the company gave guidance of $1.60 to $1.67 per share. The Street had been expecting $1.75 per share. This is basically what people expected. Quarterly sales rose 24.5%.
For Q1, BBBY sees earnings ranging between 88 and 94 cents per share. Wall Street had been expecting 95 cents per share. For the full year, the company expects earnings-per-share to rise from “mid single to a low double digit percentage range.” For 2012, the company earned $4.56 per share, so a 4% to 11% increase translates to a range of $4.74 to $5.06 per share for 2013.
Here are the sales and earnings figures for the past few quarters:
Quarter Sales Gross Profit Operating Profit Net Profit EPS May-99 $356,633 $146,214 $28,015 $17,883 $0.06 Aug-99 $451,715 $185,570 $53,580 $33,247 $0.12 Nov-00 $480,145 $196,784 $50,607 $31,707 $0.11 Feb-00 $569,012 $238,233 $77,138 $48,392 $0.17 May-00 $459,163 $187,293 $36,339 $23,364 $0.08 Aug-00 $589,381 $241,284 $70,009 $43,578 $0.15 Nov-01 $602,004 $246,080 $64,592 $40,665 $0.14 Feb-01 $746,107 $311,802 $101,898 $64,315 $0.22 May-01 $575,833 $234,959 $45,602 $30,007 $0.10 Aug-01 $713,636 $291,342 $84,672 $53,954 $0.18 Nov-02 $759,438 $311,030 $83,749 $52,964 $0.18 Feb-02 $879,055 $370,235 $132,077 $82,674 $0.28 May-02 $776,798 $318,362 $72,701 $46,299 $0.15 Aug-02 $903,044 $370,335 $119,687 $75,459 $0.25 Nov-03 $936,030 $386,224 $119,228 $75,112 $0.25 Feb-03 $1,049,292 $443,626 $168,441 $105,309 $0.35 May-03 $893,868 $367,180 $90,450 $57,508 $0.19 Aug-03 $1,111,445 $459,145 $155,867 $97,208 $0.32 Nov-04 $1,174,740 $486,987 $161,459 $100,506 $0.33 Feb-04 $1,297,928 $563,352 $231,567 $144,248 $0.47 May-04 $1,100,917 $456,774 $128,707 $82,049 $0.27 Aug-04 $1,273,960 $530,829 $189,108 $120,008 $0.39 Nov-05 $1,305,155 $548,152 $190,978 $121,927 $0.40 Feb-05 $1,467,646 $650,546 $283,621 $180,980 $0.59 May-05 $1,244,421 $520,781 $150,884 $98,903 $0.33 Aug-05 $1,431,182 $601,784 $217,877 $141,402 $0.47 Nov-06 $1,448,680 $615,363 $205,493 $134,620 $0.45 Feb-06 $1,685,279 $747,820 $304,917 $197,922 $0.67 May-06 $1,395,963 $590,098 $148,750 $100,431 $0.35 Aug-06 $1,607,239 $678,249 $219,622 $145,535 $0.51 Nov-07 $1,619,240 $704,073 $211,134 $142,436 $0.50 Feb-07 $1,994,987 $862,982 $309,895 $205,842 $0.72 May-07 $1,553,293 $646,109 $154,391 $104,647 $0.38 Aug-07 $1,767,716 $732,158 $211,037 $147,008 $0.55 Nov-08 $1,794,747 $747,866 $203,152 $138,232 $0.52 Feb-08 $1,933,186 $799,098 $259,442 $172,921 $0.66 May-08 $1,648,491 $656,000 $118,819 $76,777 $0.30 Aug-08 $1,853,892 $739,321 $187,421 $119,268 $0.46 Nov-08 $1,782,683 $692,857 $136,374 $87,700 $0.34 Feb-09 $1,923,274 $785,058 $231,282 $141,378 $0.55 May-09 $1,694,340 $666,818 $142,304 $87,172 $0.34 Aug-09 $1,914,909 $773,393 $222,031 $135,531 $0.52 Nov-09 $1,975,465 $812,412 $245,611 $151,288 $0.58 Feb-10 $2,244,079 $955,496 $370,741 $226,042 $0.86 May-10 $1,923,051 $775,036 $225,394 $137,553 $0.52 Aug-10 $2,136,730 $874,918 $296,902 $181,755 $0.70 Nov-10 $2,193,755 $896,508 $305,110 $188,574 $0.74 Feb-11 $2,504,967 $1,076,467 $461,052 $283,451 $1.12 May-11 $2,109,951 $857,572 $288,948 $180,578 $0.72 Aug-11 $2,314,064 $950,999 $371,636 $229,372 $0.93 Nov-11 $2,343,561 $958,693 $357,020 $228,544 $0.95 Feb-12 $2,732,314 $1,163,669 $550,765 $351,043 $1.48 May-12 $2,218,292 $887,199 $313,398 $206,836 $0.89 Aug-12 $2,593,015 $1,032,669 $365,137 $224,330 $0.98 Nov-12 $2,701,801 $1,074,010 $361,649 $232,750 $1.03 Feb-13 $3,401,477 $1,394,877 $598,034 $373,872 $1.68 -
Jamie’s Shareholder Letter
Eddy Elfenbein, April 10th, 2013 at 2:01 pmHere’s Jamie Dimon’s letter to shareholders. It’s quite long and he goes into many different subjects including the London Whale fiasco.
-
S&P 500 = 1,588
Eddy Elfenbein, April 10th, 2013 at 1:52 pmThe stock market continues to roll higher. The S&P 500 has been as high as 1,588.94. The index broke the 158 level 30 years ago this week.
I think Wall Street is pleased by today’s Fed minutes. I’ve read through them and nothing really jumps out at me. It’s pretty much as I expected.
On our Buy List, boring little Moog ($MOG-A) is up more than 3.5% today. Stryker ($SYK) finally got to $67 today, another new 52-week high. SYK has been a great stock for us this year. It’s already up 22% on the year for us.
-
New All-Time Intra-Day High
Eddy Elfenbein, April 10th, 2013 at 9:43 amHere are a few items I wanted to highlight this morning.
Despite the resurgence of fear in the media recently, the stock market continues to do well. The S&P 500 has jumped up to another all-time high this morning. In fact, the index finally took out its intra-day high of 1,576.09 from October 11, 2007. Today’s high was (so far) 1,576.10.
The Federal Reserve accidentally emailed out its Fed minutes five hours early. The minutes are starting to get more coverage in the media since traders are looking for any clue that QE is coming to an end. For now, I think they’re misinterpreting rather pedestrian comments as firm policy positions. QE isn’t coming to an end but it’s very reasonable for the Fed officials to discuss when that ought to happen.
Bed Bath & Beyond ($BBBY) will release its fourth-quarter earnings today. In last week’s CWS Market Review, I said that it would be out on Monday. My apologies for the error. This report will cover the important holiday season for BBBY.
Microsoft ($MSFT) has come to life recently. The shares are close to breaking above $30 per share. The company is joining other tech outfits in complaining to the EU that Android is a below-cost competitor.
The Ford Focus was named the best-selling car in the world. Last year, Ford ($F) sold just over 1 million units, up 16% from 2011.
-
Morning News: April 10, 2013
Eddy Elfenbein, April 10th, 2013 at 7:36 amU.S. Seeks Less Austerity in Euro Zone
BoJ Bazooka Sends Japanese Debt Reeling
The Mystery of China’s Export Numbers
WTO Cuts 2013 Trade Forecast After Record Slow Growth In 2012
Obama Budget Targets Millionaires, Replaces Sequester Cuts
Obama Nominee Pledges Case-by-Case Review of Gas Exports
Lenders Used Aid to Repay TARP
Retiree Health Benefits: Facing Extinction?
Scant Relief in Foreclosure Payouts
First Solar Issues Optimistic Guidance; Shares Jump 48%
Blackstone Solicits Partners for Dell Bid
J.C. Penney: A National Disgrace
Jeff Carter: New Pitching Idea for Startups
Howard Lindzon: Momentum Wrap – Back Near All-Time Highs. Here Comes The Sun?
Be sure to follow me on Twitter.
-
So What if We Had a Flat Tax?
Eddy Elfenbein, April 9th, 2013 at 10:24 amLast year, the CBO released a report on historical effective tax rates. I ran through the data with an odd goal in mind. I wanted to see if I could replicate the existing tax burden with a simple flat tax.
I don’t mean to say that I’m a flat tax advocate. I simply wanted to look at what Americans actually pay and see if I could mimic the real thing with the simple rules of a flat tax.
The answer is, not really, at least not very accurately. The CBO report only gave me eight data points to work with.
Still, this type of analysis has value. In fact, there are emerging fields of study, like Chaos Theory, that look to find simple rules that lie beneath highly complex structures.
Here’s what I was able to come up with. The graph below is my Faux Flat Tax going back to 1979. The blue line follows the left scale and is the flat tax rate. The black line follows the right scale and is the standard household deduction. The deduction is in 2009 dollars.
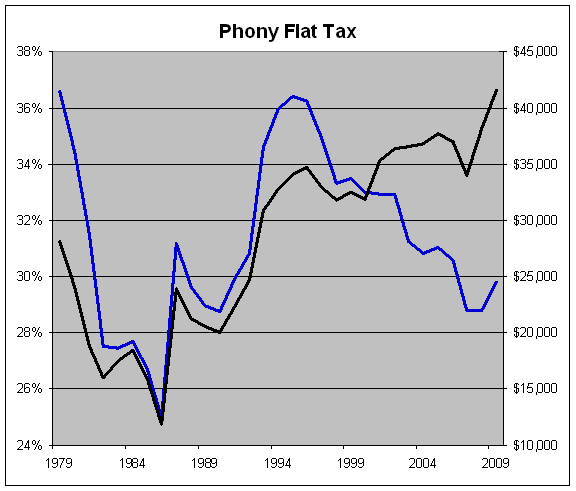
For 2009, I came up with a tax rate of 29.81% and a deduction of $41,541. So every penny a household makes under that is completely tax free. Every penny above it is taxed at 29.81%. That includes everything—income taxes, social security, Medicare, corporate taxes, the whole shebang. And most importantly, we can abolish the IRS (wait for applause).
I realize these aren’t quite the numbers that most flat taxers have in mind, but my goal is mimicry. I took the current tax code “as is” and tried to be revenue neutral. Obviously, if I had more data points I could be more accurate.
Looking at the table does reveal some interesting information. When the two lines rise, the tax code becomes more progressive (higher taxes on the rich and less on the poor). When both lines fall, the reverse happens.
What I find interesting is that despite using just eight data points, there seems to be some continuity through the years. So even if I had much more data, I think this is a reasonable approximation of what a clear-the-table flat tax would look like.
Notice, for example, how the two lines tended to track each other somewhat for most of the 1980s and early 90s. So there was some method to the madness. The relationship only broke down over the past few years as we’ve seen larger deductions and lower tax rates. The big spike in deductions near the end represents the effect of the payroll tax holiday.
One of the drawbacks of my flat tax is no matter how impressive my R-square is (.9994 in 2009), any small deviation can be rather unpleasant for certain taxpayers. That’s the messiness of using a simple model to replace a complex one. The flat tax doesn’t quite capture the right “bend” of the current tax burden. For example, under my flat tax, households making $93,800 would have a tax hike of more than $1,400. I don’t think they would be terribly impressed by my stab at being revenue neutral.
As a general rule, my flat tax is close to the current burden but it tends to be slightly more progressive. The major reason is due to social insurance taxes. Since so many lower-income workers are completely exempt from any taxation under my theoretical flat tax, it’s made up for with higher taxes at the upper end.
Let me explain how I got my numbers. I apologize but this is going to get mathy. In the data files of the CBO report, Tab 1 has the effective tax rates and Tab 3 has the pre-tax income for eight subsections; the lowest four income quintiles, plus four subsections for the top quintile (percentiles 81 to 90, 91 to 95, 96 to 99 and the Top 1%).
If you run a scatter plot with the X-axis being the eight income points and the Y-axis being the tax paid (income times effective tax rate), you get this:
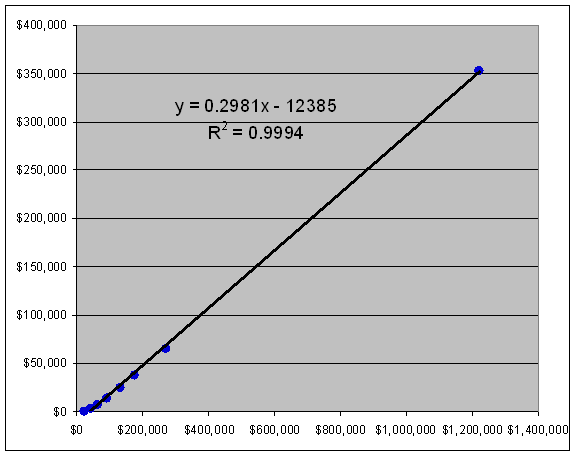
That’s for 2009. Using the trend line function, I added a linear trend line and the linear equation is also included. In the equation, y = mx + b, m is our flat tax rate and b/m is the deduction. As you can see, that’s how I got 29.81%.
Here’s the Flat Tax Data I used for the computations. Columns B through I have the household incomes for the eight groups (note that the definition for household income changed in 1986), columns J through Q have the taxes paid and columns R through Y have the effective tax rates.
On lines 35 to 66, I list the flat tax info. Column B has the tax rate by using the SLOPE function. On Column C, I get the deduction by using the INTERCEPT function.
-
Morning News: April 9, 2013
Eddy Elfenbein, April 9th, 2013 at 7:34 amChina’s Stocks Rise Most in 2 Weeks After Inflation Slows
In Berlin, Treasury Secretary Talks Up Policies To Spur Demand
European Leaders Keep Telling Themselves The Same Huge Lie — And It’s Ruining The Economy
Emerging Asian Economies on Track for Solid Growth, Development Bank Says
Christie’s to Be First Foreign Independent Auction House in China
Bernanke Says Fed to Press Banks to Curb Liquidity Risk
Fannie Mae Profit May Swell Treasury Coffers as Debt Limit Looms
Ford Focus Grabs Global Sales Crown as World Buys Small
GE Buys Lufkin for $3.3 Billion as Immelt Adds to Energy
Billabong in Talks Over $300 Million Takeover
5 Things Ron Johnson Did Right At JC Penney
Caribou Coffee Closings: Chain Reveals Massive Nationwide Shutterings, Chicago Area Hit Hard
Wary of China, Companies Head to Cambodia
Cullen Roche: Economic Surprise Indices Turning Lower
Joshua Brown: Merrill: How to Play the Bond Market
Be sure to follow me on Twitter.
-
The Yen Continues to Weigh on AFLAC
Eddy Elfenbein, April 8th, 2013 at 1:58 pmAFLAC ($AFL) is back below $50 and the culprit isn’t hard to spot — the weaker yen. Since October, the yen has gotten hammered by the U.S. dollar.
In March, the yen staged a quick relief rally, but that recently collapsed. It now takes 99 yen to buy one U.S. dollar. In October, it took just 78. I think we’re going to break 100 soon.
The reason for the big change is that Japan’s new government is aggressively trying to weaken its currency in order to help their economy. The Nikkei Index has responded by shooting up from 9,000 to as high as 13,200. That’s a huge move for such a short time period.
AFLAC said in their 10-K that if the yen averages 100 for this year, that will shave 87 cents off their operating earnings-per-share. At 100 yen to the dollar, AFLAC’s earnings range would be $5.99 to $6.19 per share for 2013.
 Eddy Elfenbein is a Washington, DC-based speaker, portfolio manager and editor of the blog Crossing Wall Street. His