Archive for 2014
-
Morning News: July 2, 2014
Eddy Elfenbein, July 2nd, 2014 at 7:04 amWorld’s ATM Moves to Frankfurt as Yellen’s Fed Slows Cash
Hong Kong Stocks Close at Year’s High on Factory Data
German, French Defense Companies Plan Alliance
Orange Fails to Reach Deal on French Wireless Consolidation
Puerto Rico Downgrade Raises Default Fears
Google in Deal for Songza, a Music Playlist Service
McDonald’s, Taco Bell, KFC Laggards in U.S. Fast-Food Survey
Nike Is Dominating The World Cup – Here’s Why
Seragon Pharmaceuticals Announces Acquisition Agreement With Genentech
How Can GM, Embroiled in a Recall Crisis, Continue to Post Strong Sales?
BNP Growth Plan at Risk as Penalties to Mar U.S. Expansion
Jamie Dimon Diagnosed With Throat Cancer: What He Can Expect
Coatue Bids Farewell to Noto Before He Starts
Roger Nusbaum: Alternative Investments: The Right Expectations
Jeff Carter: Now Is The Time to Invest in VC
Be sure to follow me on Twitter.
-
Breaking Down the Year So Far
Eddy Elfenbein, July 1st, 2014 at 12:03 pmHere’s a look at the relative strength graph so far this year. I took each of the Total Return Indexes for the S&P 500 sectors and divided them by the S&P 500’s Total Return Index. I then set each one to 100 to start the year.
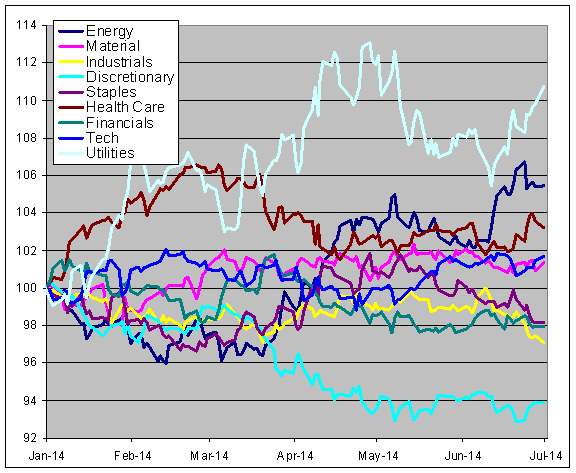
In plainer terms, a rising line means a sector is beating the market and a falling one means it’s losing. I apologize if this chart is hard to read but it’s a good way to see what’s been working this year and what hasn’t. (I didn’t include telecom since it’s only a few stocks and I didn’t want to crowd the graph.)
Healthcare and Utilities ran out for a quick lead at the start of the year, but healthcare has been rather weak since. Materials stocks were strong in February. Starting in March, Energy stocks started coming on strong. That probably explains some of the weakness in our Buy List since we don’t have any Energy stocks. The best performing sector YTD is Utilities (+18.655). The worst is Consumer Discretionaries at +0.6%.
Utility stocks started trailing the market in May, but have been leading the market over the past few weeks. In fact, a quiet theme this year has been the leadership tug-of-war between Utility stocks and Energy stocks. This probably reflects competing theses on the economy.
It’s also interesting to see how poorly Consumer Discretionaries have been doing. Bear in mind that this sector had been crushing the market for more than four years.
-
June ISM = 55.3
Eddy Elfenbein, July 1st, 2014 at 11:31 amWe had another good ISM Manufacturing number. For June, it was 55.3. This was 0.1 below last month’s number. If we had topped that, it would have been our fifth monthly increase in a row.
The ISM has now been 49.0 or better for 60 months in a row. As I’ve discussed before, this is one of the better recession indicators. We’re still in the safe zone.
-
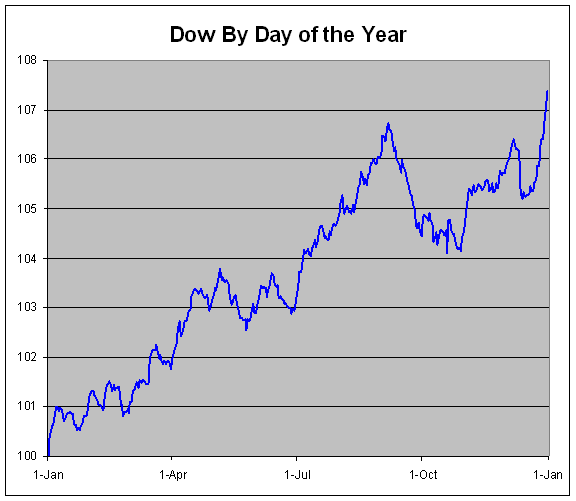
The Mid-Year Rally
Eddy Elfenbein, July 1st, 2014 at 11:21 amWe’ve all heard about the Santa Claus Rally, but there’s a smaller historical rally that takes place around the middle of the year.
I crunched the numbers for the entire Dow’s history going back to 1896 and found that the index gains an average of 1.18% from June 29 to July 9. That may not sound like a lot but consider what it means: 16% of the Dow’s entire capital gain for the year has come over a seven-day span. (The Santa Claus Rally is a more impressive gain of 2.94% from December 20 to January 7.)
Historically, this mid-year seven-day spurt kicks off the big Summer Rally. The Dow has gained, on average, 3.69% from June 29 to September 6. That’s almost exactly half the Dow’s average yearly gain coming in just over two months.
-
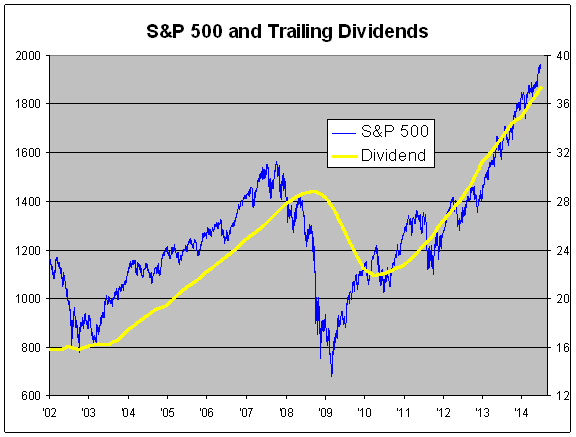
Another Big Quarter for Dividends
Eddy Elfenbein, July 1st, 2014 at 10:59 amThe numbers are in and it was another good quarter for dividends. The S&P 500 paid out $9.76 in dividends last quarter. That’s the index-adjusted number (each dollar in the index is about $8.9 billion). That’s an increase of 13.4% over a year ago.
Dividends have now grown at a double-digit rate for 13 of the last 14 quarters. It would have been an even 14 for 14, but there was a dividend surge in Q4 of 2012 to beat the tax increase. As a result, dividends rose by 6.6% in Q4 of 2013. But adjusting for that, the dividend trend is still quite strong. Dividends paid out this year will probably be about 75% higher than they were four years ago.
Here’s an interesting stat: First-half dividends are up 14.4% from last year’s first half, while the S&P 500 is up 6.05% YTD. Annualized, that’s about 12.5%. In other words, dividends are growing faster than stock prices.
Believe it or not, the market’s dividend yield is slightly higher now than it was at the beginning of the year. I’m not saying that’s a perfect measure of value because it’s welcome push-back against this silly bubble talk.
The big drag on dividends is still the financial sector. Major banks like Citigroup and Bank of America only pay a penny per share. The Financial Sector ETF ($XLF) will probably pay out around 38 cents per share this year. In 2007, it paid 86 cents per share.
Here’s a look at the S&P 500 and its trailing dividends since 2003. The S&P 500 is the blue line and it follows the left scale. Dividends are in yellow and follow the right. The two lines are scaled at 50-to-1, so whenever the lines cross, the dividend yield is exactly 2%. For such a crude measure, that 2% line has worked pretty well.
-
Morning News: July 1, 2014
Eddy Elfenbein, July 1st, 2014 at 6:35 amGerman Jobless Rises Unexpectedly in June
Japan Firms See Bigger Spending, Outlook Mixed: BOJ Tankan Survey
Aussie Dollar Parity Talk Resumes
U.S. Imposes Record $9 Billion Fine on BNP in Sanctions Warning to Banks
Eyes on Impact of BNP Paribas Fine For Euro After Flat Inflation
US Farmers Plant Record Soybean Crop, Less Corn
GM’s Record Recall Expands: Is the Brand at Risk?
Symantec Warns of Hacker Threat Against Energy Companies
Samsung’s China Labor Problems Persist
Peltz’s Trian Plants Its Flag in BNY Mellon
CytoSport® To Be Acquired By Hormel Foods Corporation
Ex-American Apparel CEO Dangerously Close to Majority Control
Whopping Fine Could Change the Way Fundraisers for Charity Operate
Cullen Roche: A Cheat Sheet for Understanding the Different Schools of Economics
Epicurean Dealmaker: Touring Test
Be sure to follow me on Twitter.
-
Buy List First-Half Summary
Eddy Elfenbein, June 30th, 2014 at 5:20 pmThe first half of the year is on the books. Our Buy List managed a small gain of 1.99% compared with the S&P 500’s gain of 6.05%. Including dividends, our Buy List is up 2.70% while the S&P 500 is up 7.14%.
The second quarter was rough for our Buy List. We beat the market in Q1, but during Q2, the Buy List had a small loss of 0.09% while the S&P 500 gained 4.69% (not including dividends). Our “beta” this year is 0.9958.
What’s interesting is that we can see an old lesson with our Buy List this year. The big duds are weighing us down much more than the winners are helping us.
Nine of our 20 stocks are beating the market, and a tenth is very close. Most of our stocks are doing just fine, but it’s the big losers that are causing the most harm. Bed Bath & Beyond is down 28.5% which is more than twice as much as our second biggest loser. All by itself, our BBBY position knocks off 1.6% to our YTD gain.
Here’s our stock-by-stock first-half performance (sans dividends):
Stock Symbol Gain/Loss DirecTV DTV 23.10% Wells Fargo WFC 15.77% Stryker SYK 12.22% Ford Motor F 11.73% Microsoft MSFT 11.47% Medtronic MDT 11.10% Moog MOG-A 7.29% CR Bard BCR 6.77% Qualcomm QCOM 6.67% Oracle ORCL 5.93% McDonald’s MCD 3.82% Fiserv FISV 2.15% Express Scripts ESRX -1.30% Cognizant Tech. CTSH -3.13% IBM IBM -3.36% AFLAC AFL -6.81% eBay EBAY -8.77% Ross Stores ROST -11.74% CA Technologies CA -14.59% Bed Bath & Beyond BBBY -28.54% Wall Street Expects 5.2% Earnings Growth for Q2
Eddy Elfenbein, June 30th, 2014 at 4:06 pmTwo quick notes to pass along. Bloomberg notes that Wall Street currently expects Q2 earnings growth for the S&P 500 of 5.2% and sales growth of 3.2%. That’s down from early April when expectations were for earnings growth of 7.3% and sales growth of 3.7%. As odd as it may sound, that lowering of expectations is much less dramatic than it had been for previous quarters.
In the Wall Street Journal, E.S. Browning notes that companies have been buying back their own stock at a torrid clip: “Companies purchasing their own shares represent the single biggest category of stock buyers today, according to a study this month by Jeffrey Kleintop, chief market strategist at brokerage firm LPL Financial.” Last year, companies spent nearly $600 billion buying back their own stock.
I’m not a terribly big fan of share buybacks. I’d rather see that money distributed to shareholders as dividends. Ideally, our tax laws shouldn’t favor one method over another. I also don’t like how share buybacks are used to mask executive compensation. Many companies that buy back shares don’t decrease their share count whatsoever, though there are some exceptions. Also, companies shouldn’t be in the business of deciding if their stock is at a good price or not. Lots of companies spend tons of money buying back over-priced shares. I’d rather see companies focus on business and let me as an owner decide what to do with my share of the profits.
The Tobacco Rally
Eddy Elfenbein, June 30th, 2014 at 11:53 amI’ve talked about this before, but here’s an updated look at the amazing rally in tobacco stocks over the last several years.
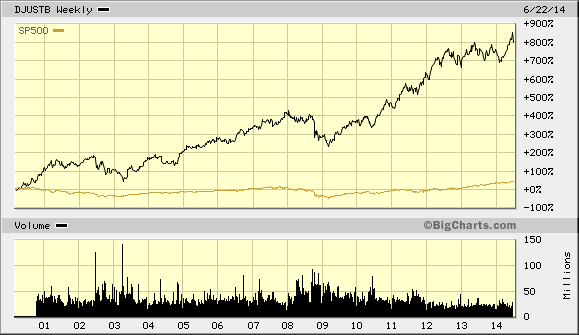
The rally is even more impressive considering that most tobacco stocks pay above-market dividends.
The Economic Recovery Turns Five
Eddy Elfenbein, June 30th, 2014 at 10:23 amToday is the final trading day of the second quarter, and by extension, the first half of the year. The U.S. economic recovery officially turns five years old today. On this day in 2009, the S&P 500 closed at 919.32.
Today is mostly a quiet day on Wall Street. I suspect that a lot of the bigwigs have already taken off on vacation. But with the turn of the month, there will be several important economic reports this week. Tomorrow is ISM and the real biggie will be this Thursday’s jobs report.
I suspect that the monthly jobs report has lost a bit of its importance lately because the Fed’s game plan seems so clear. I can’t be positive but it feels like the Fed minutes have risen in importance while jobs day and Fed meetings have fallen.
-
Archives
- June 2026
- May 2026
- April 2026
- March 2026
- February 2026
- January 2026
- December 2025
- November 2025
- October 2025
- September 2025
- August 2025
- July 2025
- June 2025
- May 2025
- April 2025
- March 2025
- February 2025
- January 2025
- December 2024
- November 2024
- October 2024
- September 2024
- August 2024
- July 2024
- June 2024
- May 2024
- April 2024
- March 2024
- February 2024
- January 2024
- December 2023
- November 2023
- October 2023
- September 2023
- August 2023
- July 2023
- June 2023
- May 2023
- April 2023
- March 2023
- February 2023
- January 2023
- December 2022
- November 2022
- October 2022
- September 2022
- August 2022
- July 2022
- June 2022
- May 2022
- April 2022
- March 2022
- February 2022
- January 2022
- December 2021
- November 2021
- October 2021
- September 2021
- August 2021
- July 2021
- June 2021
- May 2021
- April 2021
- March 2021
- February 2021
- January 2021
- December 2020
- November 2020
- October 2020
- September 2020
- August 2020
- July 2020
- June 2020
- May 2020
- April 2020
- March 2020
- February 2020
- January 2020
- December 2019
- November 2019
- October 2019
- September 2019
- August 2019
- July 2019
- June 2019
- May 2019
- April 2019
- March 2019
- February 2019
- January 2019
- December 2018
- November 2018
- October 2018
- September 2018
- August 2018
- July 2018
- June 2018
- May 2018
- April 2018
- March 2018
- February 2018
- January 2018
- December 2017
- November 2017
- October 2017
- September 2017
- August 2017
- July 2017
- June 2017
- May 2017
- April 2017
- March 2017
- February 2017
- January 2017
- December 2016
- November 2016
- October 2016
- September 2016
- August 2016
- July 2016
- June 2016
- May 2016
- April 2016
- March 2016
- February 2016
- January 2016
- December 2015
- November 2015
- October 2015
- September 2015
- August 2015
- July 2015
- June 2015
- May 2015
- April 2015
- March 2015
- February 2015
- January 2015
- December 2014
- November 2014
- October 2014
- September 2014
- August 2014
- July 2014
- June 2014
- May 2014
- April 2014
- March 2014
- February 2014
- January 2014
- December 2013
- November 2013
- October 2013
- September 2013
- August 2013
- July 2013
- June 2013
- May 2013
- April 2013
- March 2013
- February 2013
- January 2013
- December 2012
- November 2012
- October 2012
- September 2012
- August 2012
- July 2012
- June 2012
- May 2012
- April 2012
- March 2012
- February 2012
- January 2012
- December 2011
- November 2011
- October 2011
- September 2011
- August 2011
- July 2011
- June 2011
- May 2011
- April 2011
- March 2011
- February 2011
- January 2011
- December 2010
- November 2010
- October 2010
- September 2010
- August 2010
- July 2010
- June 2010
- May 2010
- April 2010
- March 2010
- February 2010
- January 2010
- December 2009
- November 2009
- October 2009
- September 2009
- August 2009
- July 2009
- June 2009
- May 2009
- April 2009
- March 2009
- February 2009
- January 2009
- December 2008
- November 2008
- October 2008
- September 2008
- August 2008
- July 2008
- June 2008
- May 2008
- April 2008
- March 2008
- February 2008
- January 2008
- December 2007
- November 2007
- October 2007
- September 2007
- August 2007
- July 2007
- June 2007
- May 2007
- April 2007
- March 2007
- February 2007
- January 2007
- December 2006
- November 2006
- October 2006
- September 2006
- August 2006
- July 2006
- June 2006
- May 2006
- April 2006
- March 2006
- February 2006
- January 2006
- December 2005
- November 2005
- October 2005
- September 2005
- August 2005
- July 2005
 Eddy Elfenbein is a Washington, DC-based speaker, portfolio manager and editor of the blog Crossing Wall Street. His