Archive for 2014
-
Nasdaq Drops 4.6% in Three Days
Eddy Elfenbein, April 8th, 2014 at 10:01 amThe stock market is flattish so far this morning. Friday and Monday were pretty ugly days, especially for momentum stocks. In the last three days, the Nasdaq has dropped 4.6%. That’s its worst three-day loss since 2011.
The key aspect of the recent market action is that it’s a valuation-based rotation. By that, I mean that stocks with high valuations have been clobbered, and that pretty much includes the entire biotech sector.
But here’s the interesting part—the rotation is not a cyclical one. Many of the economically sensitive stocks have barely budged. The Morgan Stanley Cyclical Index ($CYC) continues to move up to relative strength highs.
I’ll give you a perfect example. While the Nasdaq has moved down, IBM ($IBM) has been just fine. The rotation isn’t affecting tech, it’s affecting highly valued tech. Check this out from Bloomberg:
The Nasdaq Composite Index trades at 32 times reported earnings of the companies in the index, compared with 17 times for the S&P 500. The 100 biggest companies in the Nasdaq gauge trade 64 percent above the S&P 500 relative to sales and 149 percent higher relative to estimated revenue, data compiled by Bloomberg show.
I should point out that many traders are clearly nervous. On Friday, the Nasdaq 100 fell the most in two years. The volume of puts on the Nasdaq 100 ETF ($QQQ) topped 1 million. That’s the most since the Flash Crash four years ago.
-
Morning News: April 7, 2014
Eddy Elfenbein, April 7th, 2014 at 6:31 amDraghi’s $1.4 Trillion Question Lingers as ECB Mulls QE
New French Finance Minister Promises ‘Tough, Brave’ Decisions on Deficit
Jobs Rich Irish Mystery Confounds Shrinking Economy
Japan, Australia Clinch Trade Deal as U.S.-Tokyo Talks Heat Up
World Bank Trims China, East Asia 2014 Growth Forecasts
Libya Oil Sales to Rise as Rebels Surrender Two Ports
Oil, Gas Play Second Fiddle to Nigeria’s Services Sector
SEC Forms Squad to Examine Private Funds
Gravity Hits Highflying Tech Stocks
Holcim to Merge With Lafarge to Create Biggest Cement Maker
Roche to Pay $450 Million for IQuum
Ranbaxy Shareholders Cheer $3.2-Billion Deal With Sun Pharma; Stock Can Rally Another 20%
Credit Suisse Is Said to Be Facing Double-Barreled Inquiries
Credit Writedowns: Ten Lessons From Charles Keating on Corporatism and Control Fraud
Jeff Miller: Weighing the Week Ahead: Fluff or Fundamentals?
Be sure to follow me on Twitter.
-
The Growth/Value Divide Continues
Eddy Elfenbein, April 4th, 2014 at 1:20 pmCheck out the divergence between Value (black) and Growth (gold).
-
Dividends Grew By 15.5% in Q1
Eddy Elfenbein, April 4th, 2014 at 10:12 amOne of the under-appreciated aspects of this rally has been the strong growth of dividends. For the first quarter of 2014, the S&P 500 paid out $9.19 in dividends (that’s index-adjusted). That’s an increase of 15.5% over last year’s Q1.
Dividends for the trailing four quarters were $36.23 which is a 54.6% increase over the same period from three years ago. That’s an annualized rate of 15.6%, so we’re still growing within the trend.
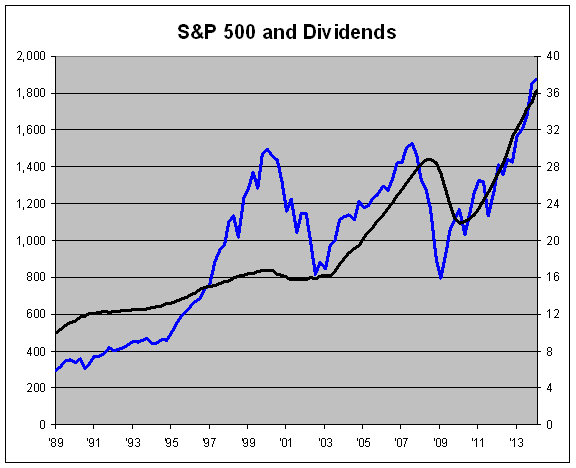
Interestingly, the dividend rate for the S&P 500 has hovered pretty close to 2% for the last few years, despite claims that we’re in a bubble. While I would never rely solely on dividends for valuations, divies have some advantages. Reported earnings can always be toyed with by accounts, but you can be fairly certain that paid cash dividends are the real thing.
Here’s a look at the S&P 500 (blue line, left scale) along with its trailing dividends (black line, right scale). The two lines are scaled at a ratio of 50-to-1 so whenever the lines cross, the dividend yield is exactly 2%.
Here’s the same chart but with the black line divided by the blue for the last ten years.
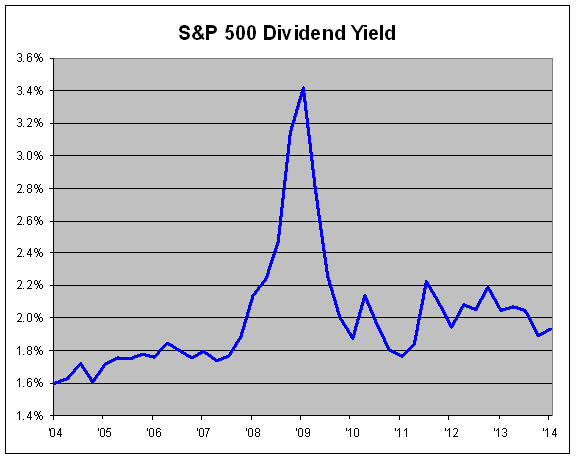
Yields soared during the bear market when stock prices fell much more steeply than dividends. Since then, the yield on the S&P 500 has stayed pretty close to 2%.
-
March NFP +192K, Unemployment = 6.7%
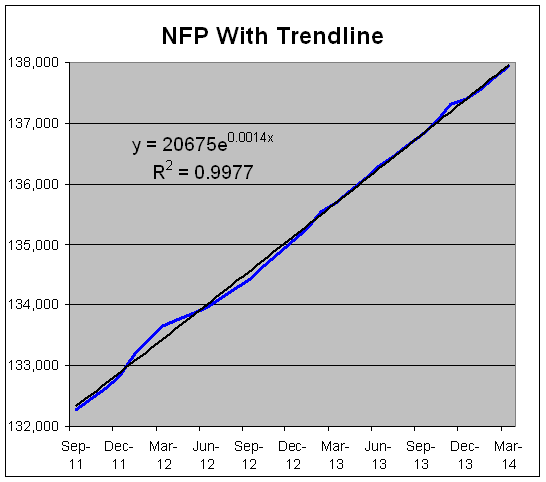
Eddy Elfenbein, April 4th, 2014 at 8:48 amMarch nonfarm payrolls came in at 192,000 which was below Wall Street’s consensus for 206,000. The number for January was revised higher by 15,000, and February was revised higher by 22,000. The unemployment rate stayed the same at 6.7%. If we split out the decimals, the unemployment rate fell from 6.716% to 6.712%.
Over the last six years, the economy has lost 271,000 jobs. For the first time since August 2009, the jobs-to-population ratio crossed 58.9%. It had been stuck in a narrow range for more than four years.
-
CWS Market Review – April 4, 2014
Eddy Elfenbein, April 4th, 2014 at 6:58 am“There will be growth in the spring.” – Chauncey Gardiner
T.S. Eliot famously called April “the cruelest month,” but it’s not so bad for the stock market (Eliot himself was a Lloyd’s Bank employee). Since 1950, the S&P 500 has rallied 44 times in April while losing ground 20 times, and recent Aprils have been especially good. In the last eight years, the S&P 500 has averaged over 3% in April.
This April has gotten off to a good start as well. On Thursday, the S&P 500 got as high as 1,893.80, which is yet another all-time intra-day high. I’m not much of a fan of the Dow Jones, but I should note that until this week, the Dow 30 had failed to break its high from December 31. Some bears claimed that this lack of “confirmation” was a bad omen. Well, that mark fell as well. On Thursday, the Dow broke 16,600 for the first time ever.
What’s the cause for the recent rally? That’s hard to say exactly, but I suspect that the cooling-off of tensions in Eastern Europe has helped a lot. Investors were also buoyed by some remarks made by Fed Chair Janet Yellen. We also got some decent economic news this week, and there seems to be some optimism for Friday’s jobs report (as usual, I’m writing this before the report comes out.)
But the next big event for investors is the Q1 earnings season, which starts next week. We already know that crummy weather held back consumers this winter, but it will be interesting to hear what kind of guidance companies have for the spring. In this week’s CWS Market Review, I’ll preview this earnings season. I’ll also focus on two Buy List earnings reports for next week: Bed Bath & Beyond and Wells Fargo. I also have several new Buy Below prices for you. But first, I want to take a look at a question that keeps popping up on Wall Street.
Are We in Another Bubble?
There’s been a lot of loose talk lately about how today is similar to the Great Millennium Bubble. A few days ago, the New York Times ran a story titled “In Some Ways, It’s Looking Like 1999 in the Stock Market.”
Oh, please. This is nonsense. Sure, stock prices have rallied, and yes, valuations are higher, but c’mon, we’re nowhere close to the kind of crazy numbers we saw in the late 90s. Back then, all you needed was a dot-com address, a sock puppet and some clever ads, and presto, investors would throw billions of dollars your way.
Actually, your company didn’t even need to be that fancy. I’ll give you a good example. General Electric ($GE) is about the bluest blue chip you can find. The stock is currently going for $26.23 per share. That’s half of where it was 14 years ago, yet the company is expected to earn $1.70 per share this year. Compare that to 2000, when GE’s bottom line was $1.27 per share. So profits are up 34% in 14 years (not so good), while the stock price is down by 50%. GE’s Price/Earnings Ratio has dropped from 42 to 15. My point is that people have forgotten what a real bubble looks like.
To be sure, there are areas of the market looking bubbly. Actually, to be more specific, it’s areas outside the market that look troublesome. Tech companies are paying some hefty prices for start-ups with little or no revenue.
Last year, Yahoo shelled out $1.1 billion to buy Tumblr. The company has so little revenue that Yahoo isn’t even required to list it in its financial statements. In business jargon, that’s what we like to call “not good.” A few weeks ago, Facebook paid a massive amount, $19 billion, for WhatsApp, a company with 55 employees. I freely admit that I can’t judge the value of enterprise like that, but there seems to be a fear in Silicon Valley of being left behind in this week’s app of the century, so these prices are getting carried away.
But that’s not the kind of investing we’ve been doing, and our stocks haven’t done many mega-deals lately (though Oracle did a few years ago). My advice is to ignore all the silly bubble talk, and let’s focus on what the numbers say.
Breaking down Q1 Earnings Season
Now let’s take at a look at some current numbers and the outlook for Q1 earnings. Last year, the S&P 500 earned $107.30 (that’s the index-adjusted number; to convert to actual dollar amounts, multiple by 8.9 billion). Currently, Wall Street expects the index make $120.04 for this year and $137.20 for 2015. In my opinion, both numbers are too high, but I’ll get to that in a bit.
For Q1, Wall Street currently expects earnings of $27.60. Those estimates have drifted lower over the past several months. One year ago, the Street had been expecting over $29 for Q1. As a general rule, earnings estimates start high and gradually fall as earnings season gets closer, so don’t be alarmed about the reduced estimates. By the time earnings season arrives, estimates are often too low. This is part of a game the Street likes to play. There’s nothing Wall Street likes better than beating expectations, so companies know how to play the expectations game. The current Q1 estimate of $27.60 works out to an increase of 7.1% over last year’s Q1. That sounds about right. I think we’ll probably be at about $28 by the time all the reports have come in.
I also want to touch on an important and often-overlooked point, which is dividends. Payouts have been growing impressively for the last few quarters. Dividends for the S&P 500 grew by 15.1% for Q1. Technically, I should say “dividends-per-share,” because the stock market has been helped by a reduced share count, thanks to stock buybacks.
Over the last three years, dividends are up by 55%. The S&P 500 paid out $34.99 in dividends last year, and I think it will pay out $40 for this year. Going by Thursday’s close, that gives the index a yield of 2.12%. That’s not bad at all, especially in an environment where interest rates are near 0%, and we know they’ll be stuck on the ground for another year.
Instead of the $120 that Wall Street expects in earnings from the S&P 500, I think $115 is a more reasonable estimate. (I don’t know if it will be more accurate, but I think it’s a safer assumption.) That gives the S&P 500 a forward P/E Ratio of 16.4, which is quite reasonable. Historically, more bull markets are upended by deteriorating fundamentals than by excessive valuations. How far the markets fall, however, is usually determined by valuations. As long as profits continue to grow, the stock market is a good place to be.
Is the U.S. Stock Market Rigged?
This week, Wall Street has been buzzing about Sunday’s 60 Minutes segment with Michael Lewis. He was on to discuss his new book, “Flash Boys,” which covers High Frequency Trading. In the interview, Lewis said that the U.S. stock market is “rigged.” I was disappointed to hear him say that. Lewis is a gifted writer, but I’m afraid he drew an overly simplistic narrative for a complicated issue.
Let me put your fears to rest. The U.S. stock market is not rigged. Individual investors have no reason to fear that a bunch of super computers are ripping them off. There are serious concerns about HFT, but saying that the market is rigged deflects the debate in a pointless direction.
I wanted cover this topic because it’s made so much news on Wall Street this week, including an acrimonious debate on CNBC, and I’m afraid Lewis’s interview rattled investors. The issue with HFT is an issue we often see: technology is changing the way we do business. Some of the changes are good, and some are bad. Instead of having floor traders, guys who make funny hand signals at each other, the modern market is governed by very fast computers. The HFT guys provide liquidity, and they get paid for it. On balance, that’s much better than the system we used to have.
I have concerns about HFT causing more numerous and more severe Flash Crashes, and I like to see that addressed. Fortunately, our strategy isn’t based on trading. I change the Buy List just once a year. I guess you could call us Low Frequency Traders. But I want to assure investors that the U.S. market is not rigged.
Don’t Count out Bed Bath & Beyond
This Wednesday, April 9, Bed Bath & Beyond ($BBBY) will release its fiscal Q4 earnings report. Let me fill you in on the back story. In early January, BBBY cut their Q4 (Dec/Jan/Feb) earnings estimate. They had been expecting earnings to range between $1.70 and $1.77 per share. Now they said it would be between $1.60 and $1.67 per share.
The stock market wrecked the shares. In one day, BBBY plunged from $80 to $70. It continued to fall for the rest of January, and it got as low as $62 per share in early February. If that wasn’t enough, one month ago, the company lowered their Q4 estimates again. This time it was due to the lousy weather. Now they expect earnings between $1.57 and $1.61 per share.
So where do we stand now? I still like Bed Bath & Beyond, and this is why we have a locked-and-sealed Buy List. We didn’t jump ship in a panic, and the shares have started to rebound. Yesterday, BBBY came within a penny of hitting $70 for the first time in three months. I think the market has basically written off the Q4 earnings report and is now focused on their guidance for Q1.
For last year’s Q1, BBBY earned 93 cents per share. The Street currently expects $1.03 per share. I’m going to hold off making a forecast, but I’m still optimistic for BBBY. The company has a rock-solid balance, they’re well run and the recovery in housing is good for them. For now, I’m going to keep our Buy Below for BBBY at $71 per share. Don’t count these guys out.
Wells Fargo Is a Buy up to $54 Per Share
Next Friday, Wells Fargo ($WFC) will be our first Buy List stock to report for this earnings cycle. As I mentioned last week, Wells passed the Federal Reserve’s stress test with flying colors. The Fed also had no objection to WFC’s capital plan, which included a 16.7% increase to their dividend. Wells now pays 35 cents per share each quarter.
In my opinion, Wells is the best-run big bank in America, and it’s better than a lot of small banks. The shares came very close to breaking $50 this week. Wall Street currently expects earnings of 96 cents per share. My numbers say that’s about right, so don’t expect any major earnings beat. The new dividend gives Wells a yield of 2.81%. I’m keeping our Buy Below at $54 per share.
Six New Buy Below Prices
The recent rally has been very good to us. Through Thursday, our Buy List is up 3.29% for the year, which is ahead of the S&P 500’s gain of 2.19%. Three of our stocks, DirecTV ($DTV), Stryker ($SYK) and CR Bard ($BCR), are already up more than 10% this year. Plus, Microsoft ($MSFT) and Wells Fargo ($WFC) aren’t far behind. This week, I’m raising the Buy Belows on six of our stocks.
Two weeks ago, I said that I expected Oracle ($ORCL) to soon break through $40 per share, and that’s exactly what happened. In fact, the stock hit $42 per share on Tuesday. Oracle hasn’t been this high in 14 years. (Remember how the stock dropped after the last earnings report? It’s funny how quickly people forget those short-term reactions.) This week, I’m bumping up my Buy Below on Oracle to $44 per share. I really like this stock.
Ford Motor ($F) has been especially strong lately. Two months ago, the shares pulled back below $14.50, and it recently closed at $16.39. Ford just reported very good sales for March. I’ll repeat what I’ve said before: I think Ford is worth $22 per share. I’m raising my Buy Below on Ford to $18 per share.
Three of our healthcare stocks, CR Bard ($BCR), Medtronic ($MDT) and Stryker ($SYK), broke out to new highs this week. I’m expecting more good earnings news from all of them. I’m raising my Buy Below on Bard to $152 per share. Medtronic is going up to $65, and Stryker’s is rising to $90 per share.
I’ve raised my Buy Below on Qualcomm ($QCOM) for the past two weeks, so I might as well make it three in a row. This stock continues to rally higher for us. On Thursday, QCOM topped $81 per share for another 14-year high. I’m raising Qualcomm’s Buy Below to $87 per share. This could be a break-out star for us.
That’s all for now. First-quarter earnings season kicks off next week. Bed Bath & Beyond reports on Wednesday. Then the big banks start to chime in Friday when Wells Fargo reports. Investors will also be paying attention to the latest Fed minutes, which come out on Wednesday. If you recall, the market was rather confused by Janet Yellen’s press conference. The minutes may clear things up. Be sure to keep checking the blog for daily updates. I’ll have more market analysis for you in the next issue of CWS Market Review!
– Eddy
-
Morning News: April 4, 2014
Eddy Elfenbein, April 4th, 2014 at 6:50 amDraghi Deflation Fight Seen on Different QE Path to Fed
Russia Raises Gas Prices for Ukraine by 80%
Portugal Ramps Up Fight Against Tax Evasion With Fancy Cars Draw
China Regulator to Require Bank Stress Tests
Fisher Says QE Would End in October Based on Current Taper Pace
In U.S. This Year, I.P.O.s Leave the Gate at Full Speed
The Government Is Rebooting The Loan Program That Helped Now-Bankrupt Fisker Automotive
Liberty Media Will Sell Most of Its Investment In Barnes & Noble
McDonald’s Closes Crimea Branches Due to ‘Reasons Beyond Our Control’
Mercedes Has Best Monthly Sales Ever With 13% March Gain
Bouygues Boosts SFR Bid to Take Cash Portion to $21 Billion
J.P. Morgan Commodity Chief Blythe Masters Leaving Bank
Cullen Roche: Bill Gross: The End of QE Could Cause Higher Interest Rates
Jeff Carter: Innovation Should Make It Better
Be sure to follow me on Twitter.
-
The Dow Hits New High
Eddy Elfenbein, April 3rd, 2014 at 10:04 amThe S&P 500 is up again this morning. The index has been as high as 1,893.68. The Dow pierced 16,600, breaking its all-time high from December 31. On our Buy List, Qualcomm ($QCOM) and Medtronic ($MDT) hit new 52-week highs.
This morning, the Department of Labor said that initial claims rose to 326,000. Last week’s number was revised to 310,000. This number bounces around a lot, but it’s still quite low. The big labor news will be tomorrow’s jobs report. There’s a chance it could be the best NFP in months. Also, the Department of Commerce said that the trade deficit increased in February to $42.3 billion. The consensus was for $39.1 billion.
Google’s new C Class shares are trading. GOOGL opened 0.63% higher than GOOG. The spread has narrowed to about 0.3%.
Bespoke Investment Group notes that 83% of stocks in the S&P 500 are above their 50-day moving average. That’s a high for this year.
-
Morning News: April 3, 2014
Eddy Elfenbein, April 3rd, 2014 at 6:44 amChina Outlines Measures to Support Growth as Goal Recedes
A Muddy Tract Now, But By 2020, China’s Answer to Wall St.
Gazprom’s $910 Billion Gaffe Shows Economy Waning
Ukraine ‘Spillover’ Could Wreck World Economy – Lagarde
JP Morgan to Process Payment for Russian Embassy, Easing Tension
World Food Prices Jump Again in March: U.N.’s FAO
Credit Suisse Increases Provision for U.S. Tax Deal
GM Hearings Revive Debate on Corporate-Fraud Penalties
Criminal Inquiry Said to Be Opened on Citigroup
Amazon, Twitter Fail on Clean Energy Front: Greenpeace
H&M Expands Into Smaller Chinese Cities Amid Competition
Joshua Brown: The Capex Comeback – Still Just Talk
Jeff Miller: How To Handle A Big Gain
Be sure to follow me on Twitter.
-
How Many Stocks Are in the S&P 500?
Eddy Elfenbein, April 2nd, 2014 at 2:53 pmHere’s a question for you: How many stocks are in the S&P 500?
Starting tomorrow, the answer will be 501. That’s 501 stocks from 500 different companies. Tomorrow marks the debut of Google’s Class C shares.
It gets a little confusing. The Class C are nonvoting and will trade under the GOOG ticker. Up till now, GOOG has been for the A shares. Those A shares will now trade under GOOGL.
The B Shares are still held by the founders, Sergey and Larry. This post-modern stock split is supposed to be just like any other — and the C Shares are expected to trade at the same price as the Class A shares. If the A and C shares trade far enough apart, averaging more than 1% for a year, then Google will have to cough up the difference.
Why this weird split? It’s so Sergey and Larry will retain control with their special B Shares. It will be interesting to see how the market values the non-voting C Shares compared with the voting A Shares.
-
Archives
- June 2026
- May 2026
- April 2026
- March 2026
- February 2026
- January 2026
- December 2025
- November 2025
- October 2025
- September 2025
- August 2025
- July 2025
- June 2025
- May 2025
- April 2025
- March 2025
- February 2025
- January 2025
- December 2024
- November 2024
- October 2024
- September 2024
- August 2024
- July 2024
- June 2024
- May 2024
- April 2024
- March 2024
- February 2024
- January 2024
- December 2023
- November 2023
- October 2023
- September 2023
- August 2023
- July 2023
- June 2023
- May 2023
- April 2023
- March 2023
- February 2023
- January 2023
- December 2022
- November 2022
- October 2022
- September 2022
- August 2022
- July 2022
- June 2022
- May 2022
- April 2022
- March 2022
- February 2022
- January 2022
- December 2021
- November 2021
- October 2021
- September 2021
- August 2021
- July 2021
- June 2021
- May 2021
- April 2021
- March 2021
- February 2021
- January 2021
- December 2020
- November 2020
- October 2020
- September 2020
- August 2020
- July 2020
- June 2020
- May 2020
- April 2020
- March 2020
- February 2020
- January 2020
- December 2019
- November 2019
- October 2019
- September 2019
- August 2019
- July 2019
- June 2019
- May 2019
- April 2019
- March 2019
- February 2019
- January 2019
- December 2018
- November 2018
- October 2018
- September 2018
- August 2018
- July 2018
- June 2018
- May 2018
- April 2018
- March 2018
- February 2018
- January 2018
- December 2017
- November 2017
- October 2017
- September 2017
- August 2017
- July 2017
- June 2017
- May 2017
- April 2017
- March 2017
- February 2017
- January 2017
- December 2016
- November 2016
- October 2016
- September 2016
- August 2016
- July 2016
- June 2016
- May 2016
- April 2016
- March 2016
- February 2016
- January 2016
- December 2015
- November 2015
- October 2015
- September 2015
- August 2015
- July 2015
- June 2015
- May 2015
- April 2015
- March 2015
- February 2015
- January 2015
- December 2014
- November 2014
- October 2014
- September 2014
- August 2014
- July 2014
- June 2014
- May 2014
- April 2014
- March 2014
- February 2014
- January 2014
- December 2013
- November 2013
- October 2013
- September 2013
- August 2013
- July 2013
- June 2013
- May 2013
- April 2013
- March 2013
- February 2013
- January 2013
- December 2012
- November 2012
- October 2012
- September 2012
- August 2012
- July 2012
- June 2012
- May 2012
- April 2012
- March 2012
- February 2012
- January 2012
- December 2011
- November 2011
- October 2011
- September 2011
- August 2011
- July 2011
- June 2011
- May 2011
- April 2011
- March 2011
- February 2011
- January 2011
- December 2010
- November 2010
- October 2010
- September 2010
- August 2010
- July 2010
- June 2010
- May 2010
- April 2010
- March 2010
- February 2010
- January 2010
- December 2009
- November 2009
- October 2009
- September 2009
- August 2009
- July 2009
- June 2009
- May 2009
- April 2009
- March 2009
- February 2009
- January 2009
- December 2008
- November 2008
- October 2008
- September 2008
- August 2008
- July 2008
- June 2008
- May 2008
- April 2008
- March 2008
- February 2008
- January 2008
- December 2007
- November 2007
- October 2007
- September 2007
- August 2007
- July 2007
- June 2007
- May 2007
- April 2007
- March 2007
- February 2007
- January 2007
- December 2006
- November 2006
- October 2006
- September 2006
- August 2006
- July 2006
- June 2006
- May 2006
- April 2006
- March 2006
- February 2006
- January 2006
- December 2005
- November 2005
- October 2005
- September 2005
- August 2005
- July 2005
 Eddy Elfenbein is a Washington, DC-based speaker, portfolio manager and editor of the blog Crossing Wall Street. His