Archive for October, 2016
-
How a Blogger Built a Fund
Eddy Elfenbein, October 18th, 2016 at 11:38 amI was on Canada’s BNN earlier today. (Monsieur Édouard appreance et Québec’s BNN plus tôt aujourd’hui.)
-
CPI +0.3% in September
Eddy Elfenbein, October 18th, 2016 at 8:49 amThis morning, the government said that inflation rose 0.3% last month. A lot of that was due to a rise in energy prices. If we look at the “core rate,” which excludes food and energy prices, then inflation rose by just 0.1%. This report is probably more ammo for the monetary hawks to raise rates in December.
Here’s the 12-month change in core CPI.
One correction: In the last CWS Market Review, I said that Signature Bank (SBNY) will report earnings today. That’s not right. They’ll be reporting on Thursday.
-
Morning News: October 18, 2016
Eddy Elfenbein, October 18th, 2016 at 7:13 amU.K. Consumer Prices Rise At Fastest Annual Pace in Nearly Two Years
Calling Tehran: Vodafone Leaps Into Iran With Internet-Service Deal
Saudi Arabia: Give Us Your Money and Stop Asking About Oil
Americans Work 25% More Than Europeans, Study Finds
Johnson & Johnson Earnings Top Estimates on Solid Pharmaceutical Sales
Netflix Shares Just Soared 20%
Why Twitter Is Actually a Media Company
IBM Shares Fall Despite Higher-Than-Expected Sales
UnitedHealth Raises 2016 Forecast, Trumps 3Q Expectations
Burberry Falls Most in a Year as Asian Woes Erode Brexit Gain
Ryanair Cuts Forecast Over a Fall in the British Pound
Remy Cointreau Q2 Sales Accelerate With China, U.S.
Bagel-Coffee Mashups Give Glimpse at JAB’s Caffeine Strategy
Cullen Roche: How Do Indexers Do Better Than Average?
Howard Lindzon: The New Stocktwits Website and Homepage – The Front Page of Finance
Be sure to follow me on Twitter.
-
Avoid Stockpickers’ Favorites
Eddy Elfenbein, October 17th, 2016 at 11:53 amResearch shows that the stocks managers love the most don’t do terribly well.
S&P 500 stocks owned in outsize chunks by mutual fund managers have consistently trailed behind the performance of S&P 500 stocks that are least favored, according to research from Bank of America Merrill Lynch. The pattern has been true since 2008 and has become more pronounced over the past three years, as the pace of redemptions has accelerated, said Savita Subramanian, an equity and quant strategist at Bank of America Merrill Lynch.
“The neglected stocks win by default while the over-owned ones get hammered by outflows,” Ms. Subramanian said.
(…)
Performance of the 10 S&P 500 stocks that active managers own most of, relative to their weight in the index, had trailed the 10 stocks that are least owned by a full 13.4 percentage points in 2016, through September 26. In 2015 and 2014, active managers’ favorite stocks lagged the least-owned ones by 12.6 percentage points and 17.8 percentage points, respectively. The most heavily owned stocks by active managers also trailed the S&P 500 in 2015 and 2014 as least-owned stocks bested the broader market.
-
September Industrial Production Rose 0.1%
Eddy Elfenbein, October 17th, 2016 at 9:36 amThe Federal Reserve said that industrial production rose 0.1% last month. Wall Street had been expecting an increase of 0.2%.
Overall manufacturing output, which accounts for more than three-quarters of all industrial production, rose 0.2% last month. Total factory production has increased in three of the past four months, but was flat in September from a year earlier.
Mining production rose 0.4%, its fourth rise in the past five months. The segment, which includes oil drilling, had been battered by a sustained drop in commodity prices. The latest figures suggest the energy sector has stabilized. Still, overall mining output remains 9.4% below its level from a year earlier.
Utilities output was down 1% from the prior month.
IP fell from November 2014 to March 2016. The scale of the graph makes the decline seem greater than it truly was.
-
Morning News: October 17, 2016
Eddy Elfenbein, October 17th, 2016 at 7:11 amOPEC Spat Over Production Data Grows as Iran Rejects Estimates
BOJ Kuroda: To Adjust Policy As Needed To Hit 2% Price Goal
Australian Casino Staff Detained in Chinese Gambling Probe
Big Winner From London’s Brexit Exodus Isn’t Even in Europe
Bank of America’s Profit Rises as Sales and Trading Revenue Climbs
Can Verizon Renege On Its Yahoo Deal?
Tesla, Panasonic to Collaborate on Solar Cells Production
PepsiCo Sets Global Target For Sugar Reduction
How Caterpillar’s Big Bet Backfired
Kyushu Railway on Track for Top-Price IPO
Lack of New Blood Casts Doubt Over Wells Fargo’s Change Plan
ICICI Surges Most Since March on Essar Debt-Recovery Hopes
Why Retailers Are Rethinking Thanksgiving Day
Weighing the Week Ahead: Has the Market Rotation Begun?
Josh Brown: Friends and Trends
Be sure to follow me on Twitter.
-
Retail Sales Climbs
Eddy Elfenbein, October 14th, 2016 at 11:53 amThis morning’s September retail sales report showed a 0.6% advance. That’s the most in three months. August’s figure was a revised 0.2% decline.
From Bloomberg:
Retail sales climbed in September by the most in three months, showing American shoppers began to spend freely again after shying away from merchants earlier in the quarter.
The 0.6 percent advance followed a revised 0.2 percent decline in August, Commerce Department figures showed Friday. So-called core sales, used to calculate gross domestic product, rose a smaller-than-projected 0.1 percent.
Years of increased hiring and a slow acceleration in worker pay have laid a foundation for steady household spending. While third-quarter purchases will probably fall short of the vigorous pace from April through June, the broad-based pickup across the retail spectrum shows household demand may be gathering pace.
“The combination of solid job growth, while slowing, modest pickup in wages, and pretty good measures of household net worth should continue to push consumer spending up over the next year,” said David Berson, chief economist at Nationwide Insurance in Columbus, Ohio.
The median forecast for retail sales in a survey of 77 economists was a 0.6 percent increase. Estimates ranged from gains of 0.2 percent to 1 percent. August was revised from an initially reported 0.3 percent decline.
The small gain in September retail control group sales, the figure that’s used to calculate gross domestic product and which excludes such categories as autos, gasoline stations and building materials, was weaker than the 0.4 percent median forecast and followed declines in the previous two months.
-
Wells Fargo Has Mixed Earnings
Eddy Elfenbein, October 14th, 2016 at 11:38 amWells Fargo (WFC) released mixed earnings this morning.
For Q3, the bank earned $1.03 per share which beat estimates by two cents per share. Total revenue of $22.328 billion was slightly higher than the expected $22.21 billion. Yet current-quarter net income fell to $5.64 billion from $5.8 billion in Q3 2015, a 3% decline.
WFC said total average loans were up $62.4 billion, or 7%, to $957.5 billion over the third quarter one year ago. Total average deposits were also up $62.7 billion to $1.3 trillion, 5% higher than Q3 2015.
-
CWS Market Review – October 14, 2016
Eddy Elfenbein, October 14th, 2016 at 7:08 am“Successful investing is anticipating the anticipations of others.” – J.M. Keynes
Earnings season has finally arrived. Everything we’re hearing about elections, the Fed and GDP — it all pales in comparison to earnings season. Over the next three weeks, 16 of our 20 Buy List stocks are due to report earnings. This is when we’ll learn how well our companies are performing.
Overall, I’m expecting very good results from our stocks. They’re generally much better than average. The only hitch is that you never know exactly what the market will do—even with a good earnings report. (I always find it amusing when a stock beats expectations, then falls. So what did traders expect?)
In this week’s CWS Market Review, we’ll preview five Buy List earnings reports coming our way next week. Before I get to that, I want to fill you in on the latest jobs report, as well as the minutes of the Fed’s September meeting.
The U.S. Economy Created 156,000 Jobs in September
Last Friday, the government reported that the U.S. economy created 156,000 net new jobs last month. That’s an okay report, but it’s nothing great. Wall Street had been expecting 176,000. The unemployment rate rose to 5.0%.
I was particularly curious to see how wages did. After all, that’s where future revenue comes from. According to the report, average hourly earnings rose by 0.2% in September. In the last year, average hourly earnings are up 2.6%. The wage numbers are getting better, but I want to see a lot more improvement.
On Wednesday, the Fed released the minutes from its September meeting. If you recall, the FOMC again decided against raising rates, but there were three dissenting votes. All of them wanted to raise rates immediately.
The minutes contained this line (as always, I apologize for the barely comprehensible dialect known as Fed-speak): “Members generally agreed that the case for an increase in the policy rate had strengthened.” Poker players call that a “tell.” I realize it sounds mild mannered, but that line wouldn’t have gone in there unless there’s a growing bloc of hawks inside the FOMC. That line is key.
Here’s my take: I strongly doubt that the last jobs report will deter the Fed. I still think that they’ll hold off raising rates next month but will go ahead with a hike in December. But I must stress that investors have nothing to fear from a rate hike. The danger is only when the Fed goes too far, and we’re a long way from that.
The Charting New Year Started on February 11
Financial markets are really all about trends. Once a trend is established, it can stay in place a long time, longer than you thought possible. But like all good things, trends come to an end.
As far as the stock market’s concerned, the new year began on February 11. I realize that sounds odd, but hear me out. That’s because February 11 is when all the current trends started—and these trends have been as trendy as ever lately. The old Wall Street saying is that the “trend is your friend.” Actually, I would say the “trend is your frenemy” because you never know when it will end.
On February 11, the S&P 500 touched a two-year low of 1,810. The index first tested and then dropped below the “Tchaikovsky Low” of 1,812 reached a few weeks before. The first six weeks of this year marked the worst start to a year in the history of the S&P 500. Not only did stocks bottom out on February 11, but so did oil. West Texas Crude closed at $27.30 per barrel. That was a 12-year low. In 20 months, oil fell roughly by three-fourths.
Along with the drop in oil, the junk-bond market fell flat on its face. Junk bonds were demanding a massive premium of nearly 9% over other bonds. That’s gigantic. At that time, the futures market had basically written off the idea of the Fed hiking rates in 2016 or 2017. Congress was even asking Janet Yellen about negative rates.
All of these events are connected by one factor—a dire fear of taking risk. The trend ever since then, when the technical new year began, has been a reversing of that. Over the last eight months, the constant trend has been one of investors warming up to more and more risk.
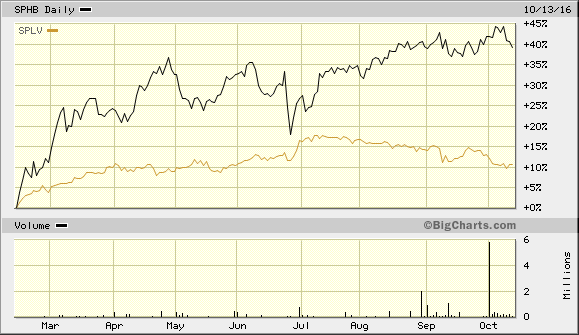
Not only is this true between the markets, but we also see it within the stock market. On February 11, high-beta stocks started leading the broader market, as did financial stocks. The chart above shows how soundly high beta has beaten low vol. In the weeks leading up to February 11, bank stocks had been demolished. No rate hikes means no profit for Johnny Lender. Small-cap stocks, which tend to be riskier, got a slight head start and started leading the market on February 10.
What’s also part of this trend is the shift away from conservative sectors like Utilities and high-quality stocks and towards economically cyclical sectors. In particular, this means Energy, Materials and Industrials. Oil recently broke above $51 per barrel. Frankly, the shift from high-quality areas is probably impacting our Buy List as a whole this year.
I won’t predict how long this trend will play out. That’s a game not worth playing. But I want investors to understand what’s happening. Overall, an appetite for more risk is a good thing. But like many things, too much of it can be very bad.
Next Week’s Buy List Earnings Reports
Wells Fargo (WFC) is due to report earnings later today. The big news is that late Wednesday, CEO John Stumpf decided to retire, effective immediately. I had been urging this for the last few issues. This needs to be the start of a house-cleaning, but it’s a good first step.
Not surprisingly, shares of WFC were trading higher in the after-hours market after news of Stumpf’s resignation came out. As a general rule, if news of your resignation causes your company’s stock to gain $4 billion in market value, you probably won’t be missed. Timothy J. Sloan will take over as the new CEO. Mr Stumpf will not be getting a severance package.
Bear in mind just how large an organization Wells Fargo is. For Q3, Wall Street expects earnings of $1.01 per share. That sounds about right; maybe it’s a tad low. Don’t give up just yet on Wells. The problem there is fixable, but they need to make the right moves now. Check the blog for an update on the earnings report.
We have five more Buy List earnings reports next week, plus eight for the week after that. Here’s a calendar showing each stock’s earnings date and Wall Street’s estimates.
Company Ticker Date Estimate Wells Fargo WFC 14-Oct $1.01 Signature Bank SBNY 18-Oct $2.03 Microsoft MSFT 20-Oct $0.68 Alliance Data ADS 20-Oct $4.44 Snap-on SNA 20-Oct $2.15 Wabtec WAB 20-Oct $0.99 CR Bard BCR 25-Oct $2.56 Fiserv FISV 25-Oct $1.13 Express Scripts ESRX 25-Oct $1.74 Biogen BIIB 26-Oct $5.01 AFLAC AFL 27-Oct $1.74 Stericycle SRCL 27-Oct $1.17 Stryker SYK 27-Oct $1.37 Ford Motor F 27-Oct $0.22 Cerner CERN 1-Nov $0.60 Cognizant Tech CTSH 2-Nov $0.84 Now let’s look at our earnings reports for next week.
On Tuesday, Signature Bank (SBNY) is due to report its Q3 earnings. I like SBNY a lot, but the stock has done very poorly this year. I like it when a good company has a poorly-performing stock. It’s not a guarantee of a winner, but it’s a good sign of one.
Signature’s Q2 earnings report was a dud. They missed estimates by seven cents per share. Overall, the bank is doing well, but they’ve been getting squeezed by bad taxi-medallion loans. Uber and ride-sharing companies have greatly impacted the cab industry, and by extension, medallion prices. SBNY used to have a nice business financing these medallions. It’s not so nice anymore.
The key here is that the problem is known. Signature said they’ll continue to have issues with this, but it’s hardly going to sink the bank. Wall Street’s estimate for Q3 is $2.01 per share.
Four Buy List Earnings Reports Due on Thursday
Next Thursday, October 20, will be a big day for earnings. Four of our Buy List stocks are due to report.
Alliance Data Systems (ADS) has had a difficult year so far. I thought that the impressive earnings report for Q2 would turn things around, but the shares haven’t done much. For Q3, Alliance said they project earnings of $4.42 per share. The Street had been expecting $4.58. The company sees full-year earnings coming in at $16.85 per share.
Microsoft (MSFT) has been one of the most impressive stocks on our Buy List. It’s odd how such a well-known stock can surprise you. I should say that I’ve been impressed with MSFT’s numbers, even if the shares haven’t been quite so impressive.
The last earnings report was very good—especially the company’s cloud business—and the stock rallied to $58 per share. But that price has been a brick wall ever since. The 52-week high is $58.70 from late August, and the stock sputters out every time it gets close to that. Why? Who knows! The market’s gods can be capricious. Perhaps another good earnings report could be a catalyst for a breakout. Wall Street expects 68 cents per share.
Shares of Snap-on (SNA) rallied impressively off the February low, but they’ve gradually slid back since the spring. The last earnings report was good, but the top-line number was a little weak. Wall Street’s current estimate is for $2.15 per share.
Wabtec (WAB) has been having a difficult year, but I still like the company. The problem is its freight business, which has been under pressure. WAB lowered its full-year earnings to a range of $4 to $4.20 per share. The previous range was $4.30 to $4.50 per share.
That’s all for now. Next week will be crowded with earnings. Also, on Monday we’ll get the latest report on industrial production. Tuesday is the CPI. On Wednesday, we’ll mercifully have the final presidential debate. That will also be the 29th anniversary of the 1987 crash. I’m sure that’s just a coincidence. The Fed will also release its Beige Book on Wednesday. Be sure to keep checking the blog for daily updates. I’ll have more market analysis for you in the next issue of CWS Market Review!
– Eddy
Morning News: October 14, 2016
Eddy Elfenbein, October 14th, 2016 at 7:03 amChina Inflation Relief Sends Stocks, Dollar Higher
Europe Car Sales Hit September Record
Treasury Tries Again To Keep American Firms’ Taxes In U.S.
Wells Fargo’s John Stumpf Is the Latest Victim of ‘CEO of the Year’ Curse
JPMorgan Posts $6.3 Billion Profit as Bond-Trading Revenue Rises
Verizon Puts Yahoo on Notice After Data Breach
Samsung Predicts 3 Billion Hit to Future Profits After Pulling Galaxy Note 7
Snapchat Heads For Possible $25 Billion Flotation
Softbank’s New $100B Tech Fund Shows Exactly How It’s Expanding Beyond Telco
HP Plans Up to 4,000 Job Cuts Over Three Years
Uber Drivers Secure Unemployment Benefits
The Cheap Airfare Party Is About to End
Josh Brown: When Did The Bull Market Begin, IRL?
Jeff Miller: Stock Exchange: Great Chart Ideas Include WB, DDD, DXCM, and APD
Be sure to follow me on Twitter.
-
Archives
- July 2026
- June 2026
- May 2026
- April 2026
- March 2026
- February 2026
- January 2026
- December 2025
- November 2025
- October 2025
- September 2025
- August 2025
- July 2025
- June 2025
- May 2025
- April 2025
- March 2025
- February 2025
- January 2025
- December 2024
- November 2024
- October 2024
- September 2024
- August 2024
- July 2024
- June 2024
- May 2024
- April 2024
- March 2024
- February 2024
- January 2024
- December 2023
- November 2023
- October 2023
- September 2023
- August 2023
- July 2023
- June 2023
- May 2023
- April 2023
- March 2023
- February 2023
- January 2023
- December 2022
- November 2022
- October 2022
- September 2022
- August 2022
- July 2022
- June 2022
- May 2022
- April 2022
- March 2022
- February 2022
- January 2022
- December 2021
- November 2021
- October 2021
- September 2021
- August 2021
- July 2021
- June 2021
- May 2021
- April 2021
- March 2021
- February 2021
- January 2021
- December 2020
- November 2020
- October 2020
- September 2020
- August 2020
- July 2020
- June 2020
- May 2020
- April 2020
- March 2020
- February 2020
- January 2020
- December 2019
- November 2019
- October 2019
- September 2019
- August 2019
- July 2019
- June 2019
- May 2019
- April 2019
- March 2019
- February 2019
- January 2019
- December 2018
- November 2018
- October 2018
- September 2018
- August 2018
- July 2018
- June 2018
- May 2018
- April 2018
- March 2018
- February 2018
- January 2018
- December 2017
- November 2017
- October 2017
- September 2017
- August 2017
- July 2017
- June 2017
- May 2017
- April 2017
- March 2017
- February 2017
- January 2017
- December 2016
- November 2016
- October 2016
- September 2016
- August 2016
- July 2016
- June 2016
- May 2016
- April 2016
- March 2016
- February 2016
- January 2016
- December 2015
- November 2015
- October 2015
- September 2015
- August 2015
- July 2015
- June 2015
- May 2015
- April 2015
- March 2015
- February 2015
- January 2015
- December 2014
- November 2014
- October 2014
- September 2014
- August 2014
- July 2014
- June 2014
- May 2014
- April 2014
- March 2014
- February 2014
- January 2014
- December 2013
- November 2013
- October 2013
- September 2013
- August 2013
- July 2013
- June 2013
- May 2013
- April 2013
- March 2013
- February 2013
- January 2013
- December 2012
- November 2012
- October 2012
- September 2012
- August 2012
- July 2012
- June 2012
- May 2012
- April 2012
- March 2012
- February 2012
- January 2012
- December 2011
- November 2011
- October 2011
- September 2011
- August 2011
- July 2011
- June 2011
- May 2011
- April 2011
- March 2011
- February 2011
- January 2011
- December 2010
- November 2010
- October 2010
- September 2010
- August 2010
- July 2010
- June 2010
- May 2010
- April 2010
- March 2010
- February 2010
- January 2010
- December 2009
- November 2009
- October 2009
- September 2009
- August 2009
- July 2009
- June 2009
- May 2009
- April 2009
- March 2009
- February 2009
- January 2009
- December 2008
- November 2008
- October 2008
- September 2008
- August 2008
- July 2008
- June 2008
- May 2008
- April 2008
- March 2008
- February 2008
- January 2008
- December 2007
- November 2007
- October 2007
- September 2007
- August 2007
- July 2007
- June 2007
- May 2007
- April 2007
- March 2007
- February 2007
- January 2007
- December 2006
- November 2006
- October 2006
- September 2006
- August 2006
- July 2006
- June 2006
- May 2006
- April 2006
- March 2006
- February 2006
- January 2006
- December 2005
- November 2005
- October 2005
- September 2005
- August 2005
- July 2005
 Eddy Elfenbein is a Washington, DC-based speaker, portfolio manager and editor of the blog Crossing Wall Street. His