The 2022 Buy List
The 2022 investing year is on the books!
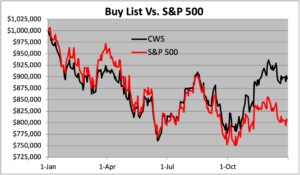
This was a difficult year for Wall Street. The stock market had its worst year since the financial crisis. The S&P 500 peaked on the first trading day of the year, and it was downhill from there.
Investors were rattled by the highest inflation in 40 years and seven Fed interest-rate hikes. Many of the former popular stocks were especially punished this year. The market reached its low in October (at least, its low so far). Along the way, investors were treated to a few bear-market rallies, and each one fizzled out.
The good news is that the 2022 Buy List held up well. We were down, but not as much as the rest of the market. This was our best year relative to the overall market in 12 years. This is especially impressive when you consider that we got off to a rocky start. By April, our Buy List was trailing the market by more than 4%.
Keeping calm paid off. Let’s look over the numbers. For the year, the S&P 500 lost 19.44%. Including dividends, it was down 18.11%. Our Buy List was down 10.42%. Including dividends, we were down 9.28%.
For the 17 years of the Buy List, the S&P 500 with dividends is up 333.17%, while our Buy List is up 435.73%.
The Buy List had a “beta” this year of 0.8274.
Our best stock of the year was FICO (FICO), which gained 38.03% (before dividends). Not far behind that was SAIC (SAIC), a newcomer, which was up 32.75%. In third place was AFLAC (AFL), which has been a fixture of all 18 Buy Lists. The duck stock was up 23.21%.
Seven of our 25 stocks closed higher this year. Our worst stock this year was Trex (TREX). The deck stock lost 68.65% this year. Even if Trex had jumped 90% on the final day of trading, it still would have been our worst stock. Ironically, Trex was our best stock last year and the year before.
I should give a special “Come from Behind” award to Ross Stores (ROST). The deep-discounter plunged during the first half of the year but staged a furious rally in the second to close just barely in the black for this year. ROST finished this year 67% above its 52-week low.
Ross Stores won’t be returning in 2023, but it’s been a big winner. In 10 years, shares of ROST gained 329% for us. Sherwin-Williams (SHW) made 165% in six years, and Church & Dwight (CHD) made 60% in five years.
How did our sells from last year do? Not so well. Middleby lost 32%. Ansys was down by 40%, and Disney lost 44%. Cerner was bought by Oracle, and Check Point Software gained 8%.
I always strive to be as transparent as possible when discussing our track record. Here’s a breakdown of how our Buy List performed in 2022. For tracking purposes, I assume the Buy List is a $1 million portfolio and all 25 stocks are equally weighted at the start of the year.
| Stock | Shares | 12/31/21 | Beginning | 12/30/22 | Ending | Profit/Loss |
| ABT | 284.212022 | $140.74 | $40,000.00 | $109.79 | $31,203.64 | -21.99% |
| AFL | 685.048810 | $58.39 | $40,000.00 | $71.94 | $49,282.41 | 23.21% |
| BR | 218.794443 | $182.82 | $40,000.00 | $134.13 | $29,346.90 | -26.63% |
| CARR | 737.463127 | $54.24 | $40,000.00 | $41.25 | $30,420.35 | -23.95% |
| CHD | 390.243902 | $102.50 | $40,000.00 | $80.61 | $31,457.56 | -21.36% |
| DHR | 121.576852 | $329.01 | $40,000.00 | $265.42 | $32,268.93 | -19.33% |
| FDS | 82.302833 | $486.01 | $40,000.00 | $401.21 | $33,020.72 | -17.45% |
| FICO | 92.236032 | $433.67 | $40,000.00 | $598.58 | $55,210.64 | 38.03% |
| FISV | 385.393583 | $103.79 | $40,000.00 | $101.07 | $38,951.73 | -2.62% |
| HEI | 277.354042 | $144.22 | $40,000.00 | $153.64 | $42,612.68 | 6.53% |
| HSY | 206.750401 | $193.47 | $40,000.00 | $231.57 | $47,877.19 | 19.69% |
| ICE | 292.461797 | $136.77 | $40,000.00 | $102.59 | $30,003.66 | -24.99% |
| MCO | 102.411798 | $390.58 | $40,000.00 | $278.62 | $28,533.98 | -28.67% |
| MLR | 1,197.604790 | $33.40 | $40,000.00 | $26.66 | $31,928.14 | -20.18% |
| OTIS | 459.400482 | $87.07 | $40,000.00 | $78.31 | $35,975.65 | -10.06% |
| REYN | 1,273.885350 | $31.40 | $40,000.00 | $29.98 | $38,191.08 | -4.52% |
| ROST | 350.017501 | $114.28 | $40,000.00 | $116.07 | $40,626.53 | 1.57% |
| SAIC | 478.526139 | $83.59 | $40,000.00 | $110.93 | $53,082.90 | 32.71% |
| SCL | 321.827983 | $124.29 | $40,000.00 | $106.46 | $34,261.81 | -14.35% |
| SHW | 113.584734 | $352.16 | $40,000.00 | $237.33 | $26,957.06 | -32.61% |
| SLGN | 933.706816 | $42.84 | $40,000.00 | $51.84 | $48,403.36 | 21.01% |
| SYK | 149.577444 | $267.42 | $40,000.00 | $244.49 | $36,570.19 | -8.57% |
| TMO | 59.948444 | $667.24 | $40,000.00 | $550.69 | $33,013.01 | -17.47% |
| TREX | 296.230467 | $135.03 | $40,000.00 | $42.33 | $12,539.44 | -68.65% |
| ZTS | 163.914273 | $244.03 | $40,000.00 | $146.55 | $24,021.64 | -39.95% |
| Total | $1,000,000.00 | $895,761.20 | -10.42% |
Here’s the data behind the dividend-adjusted returns. I’ve listed each stock’s beginning price, ending price and dividend-adjusted starting price.
 Eddy Elfenbein is a Washington, DC-based speaker, portfolio manager and editor of the blog Crossing Wall Street. His