CWS Market Review – July 11, 2023
(This is the free version of CWS Market Review. If you like what you see, then please sign up for the premium newsletter for $20 per month or $200 for the whole year. If you sign up today, you can see our two reports, “Your Handy Guide to Stock Orders” and “How Not to Get Screwed on Your Mortgage.”)
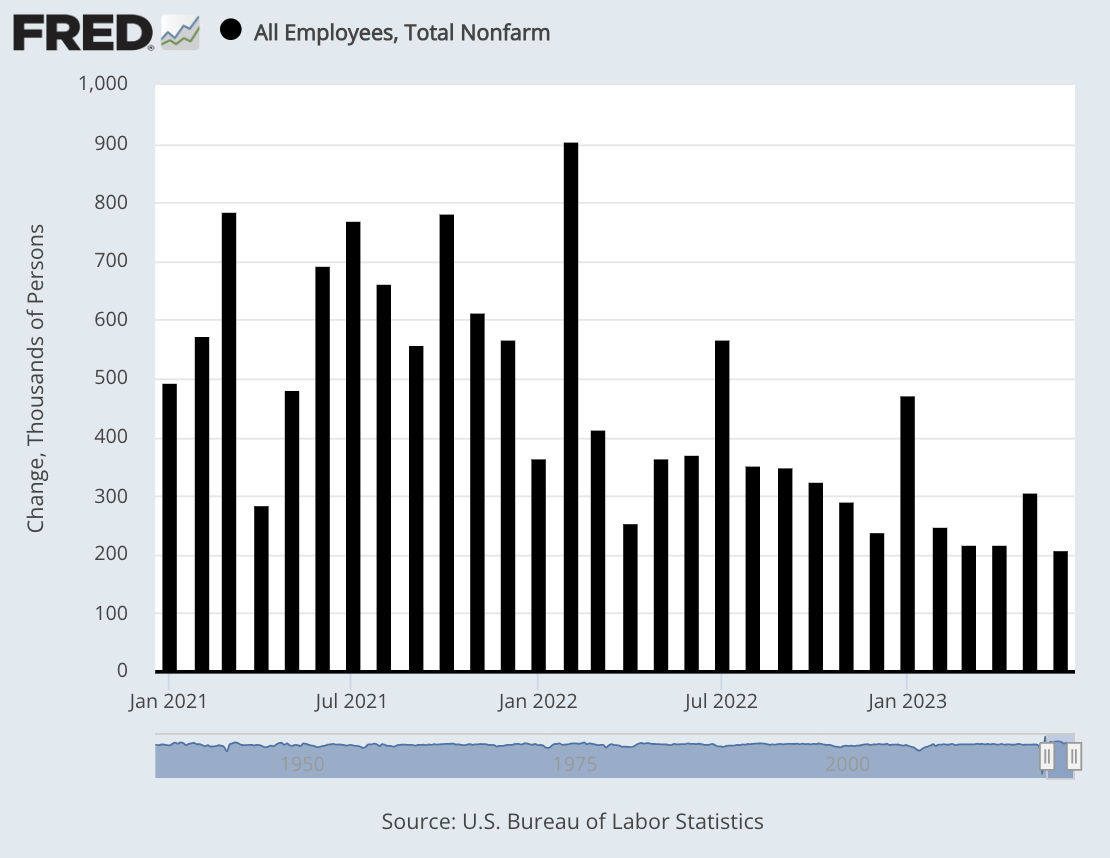
The U.S. Economy Added 209,000 Jobs in June
On Friday, the government released the big June jobs report. According to the Labor Department, the U.S. economy created 209,000 net new jobs last month. That was a little below Wall Street’s estimate for a gain of 240,000. June was the slowest month for job creation since December 2020.
The figure for May was revised downward by 33,000. April’s was reduced by 77,000.
The unemployment rate dropped by 0.1% to 3.6% but that’s still close to a multi-decade low. The broader U-6 rate fell to 6.9%. Importantly, the labor force participation rate for prime working age people (ages 25 to 54) increased to 83.5%. That’s a 21-year high. This suggests that people have largely returned to the workforce, undoing the mass exodus we saw during Covid.
The weak spot continues to be wage growth, although that’s improved a little. Last month, average hourly earnings increased by 0.4%. Over the last year, average hourly earnings are up by 4.4%, but there are some key details in the jobs report.
Job growth would have been even lighter without a boost in government jobs, which increased by 60,000, almost all of which came from the state and local levels.
Other sectors showing strong gains were health care (41,000), social assistance (24,000) and construction (23,000).
Leisure and hospitality, which had been the strongest job growth engine over the past three years, added just 21,000 jobs for the month. The sector has cooled off considerably, showing only muted gains for the past three months.
The retail sector lost 11,000 jobs in June, while transportation and warehousing saw a decline of 7,000.
Friday’s report was a mild disappointment especially after the very strong ADP payroll report from last Wednesday. Still, the overall signs look quite good.
The next test for the economy and markets comes tomorrow when the government releases the CPI data for June. Inflation has consistently trended lower for the last year. We’ll find out if that trend continued.
The consensus for Wednesday’s report is that inflation increased by 0.3% in June and prices are up by 5% over the last year. This could be the first report in several months where inflation accelerated.
Fed officials think that getting inflation below the current rate could prove to be a very difficult job. Chairman Powell has consistently stated his intention to get inflation down to the Fed’s goal of 2% per share.
So far, the Fed’s hawkish stance seems to be justified. The central bank won’t meet for another two more weeks, but it appears that another 0.25% is virtually a certainty. As of Tuesday, traders said there’s a 92% chance that the Fed will hike. This would bring the target range for the Fed funds rate up to 5.25% to 5.50%. After that, traders think the Fed will be on pause for the next eight months. The CPI might change that outlook.
The fact is that the forecast for the economy has improved. Not that long ago, Wall Street fully expected the economy to be off the rails by now. That hasn’t happened. Actually, the stock market has been signaling a stronger economy for a few weeks, for those willing to pay attention. For example, the S&P 500 Industrials Index has rallied quite nicely since early June.
It’s interesting to bring this up because Industrials are a key component in the cyclical sector. In our issue from June 6, I told you about the then-recent downturn in cyclicals. I even said that cyclicals would regain their leadership before the end of the year.
Apparently, I was too pessimistic because cyclicals have been acting much better, basically since the day I mentioned it to you. It’s not just Industrials, but Energy and Materials stocks have also rebounded quite well.
The chart below shows that Industrials, Materials and Energy stocks have all been leading the S&P 500 (black line) since early June. Financials have as well.
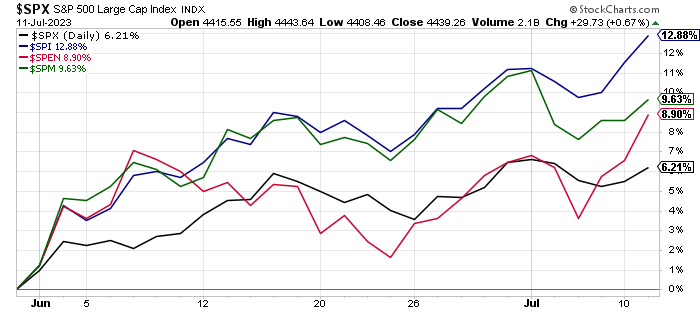
Take this as a signal that Wall Street is growing skeptical of the recession hypothesis. If pricing pressures remain in the economy, the Fed’s job may not be done. It’s as if everyone was prepared for a recession except the economy.
The Nasdaq 100 Is Due for a Rebalance
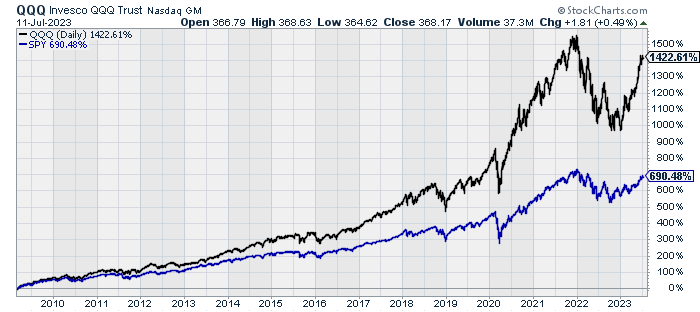
The Nasdaq 100 is a stock index of the 100 largest nonfinancial companies on the Nasdaq. It’s basically become a good proxy index for the large-cap tech sector. The ETF for the Nasdaq 100 (QQQ) became one of the first breakout stars in the ETF universe. It now has $200 billion in assets under management.
The problem the index has is that it’s grown too far too fast. The three largest stocks now make up 30% of the index. The index has largely become an index of Amazon, Apple, Nvidia, Microsoft and Tesla.
Earlier this month, Nasdaq said it will do a special rebalance to address this. They already rebalance the index once a quarter just for mechanics, but this will be a special rebalance. In other words, they’re actively tinkering with a passive strategy.
The top five stocks make up more than 40% of the index, and the top 10 make up 59% of the index. QQQ has been crushing it lately.
This brings up an important issue that I think many investors don’t realize which is how distorted by size Wall Street is. A small group of stocks comprises a very large part of the market while many hundreds of stocks barely make a peep.
To be sure, I’m not advocating for a different kind of distribution. After all, we have to deal with the market we have, not the one we wish to have. But there are a few important lessons to be drawn.
For example, it’s fairly easy to build a “good enough” index fund by yourself. I’ve run the numbers and you can track the S&P 500 reasonably well with as few as 10 stocks. You’ll need to rebalance every six months or so to be close.
Conversely, you can build a large portfolio of stocks that have little to no correlation with the rest of the market. On the Nasdaq in particular, there are hundreds of little banks that are barely noticed. If these banks theoretically all merged together, they still wouldn’t be as powerful as JPM.
Stock Focus: Farmer Mac
This week, we’re going to look at a stock known officially as the Federal Agricultural Mortgage Corporation (AGM) but it is better known as Farmer Mac. Farmer Mac was chartered by Congress in 1988, and five of the 15 members of the Board of Directors are appointed by the President.
The idea of Farmer Mac was to create a secondary market for agricultural loans like mortgages in rural areas. The company has a close working relationship with the Department of Agriculture. AGM was founded after the farm bust of the 1980s. The idea was to build an alternative source of credit for farmers, and it would be in the mold of Fannie Mae.
While Farmer Mac’s debts are not guaranteed by the federal government, much of the farm sector is protected by the government. In fact, farming may be one of the most state-protected industries in America.
Fannie Mae, of course, was thrashed by the big Financial Crisis of 2007-08. Farmer Mac got hit hard as well. The company owned a lot of shares of Fannie Mae before Fannie was taken over by the Feds.
In a 15-month span, shares of AGM fell from $37 to $2.28. Since then, AGM has been a huge winner. Last month, the stock reached a new high of $153 per share.
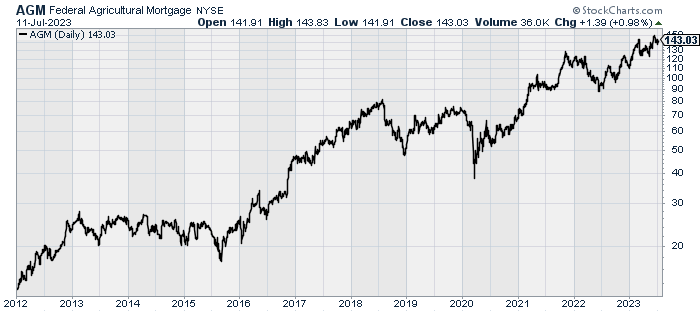
One side note: I don’t like to cherry-pick numbers, which is easy to do in finance, but I’ll note that AGM has grown at a steady clip since its low. The chart above begins after AGM plunged in 2007. I didn’t think including it added much. A steady chart often a good sign of a strong underlying business. Thanks to its close relationship to the government, Farmer Mac is able to have far lower interest-rate-risk than many major banks.
Farmer Mac’s quarterly dividend has steadily increased from a nickel per share in 2011 to $1.10 per share in 2023. The stock currently yields 3.1%.
This is a cool little stock to watch. Only two Wall Street analysts follow AGM and it has a market cap of just $1.5 billion. That’s tiny in Wall Street’s eyes. JPM is about 300 times the size of AGM. Still, you can’t argue with success.
That’s all for now. I’ll have more for you in the next issue of CWS Market Review.
– Eddy
P.S. If you want more info on our ETF, you can check out the ETF’s website.
Posted by Eddy Elfenbein on July 11th, 2023 at 6:53 pm
The information in this blog post represents my own opinions and does not contain a recommendation for any particular security or investment. I or my affiliates may hold positions or other interests in securities mentioned in the Blog, please see my Disclaimer page for my full disclaimer.
-
Archives
- July 2026
- June 2026
- May 2026
- April 2026
- March 2026
- February 2026
- January 2026
- December 2025
- November 2025
- October 2025
- September 2025
- August 2025
- July 2025
- June 2025
- May 2025
- April 2025
- March 2025
- February 2025
- January 2025
- December 2024
- November 2024
- October 2024
- September 2024
- August 2024
- July 2024
- June 2024
- May 2024
- April 2024
- March 2024
- February 2024
- January 2024
- December 2023
- November 2023
- October 2023
- September 2023
- August 2023
- July 2023
- June 2023
- May 2023
- April 2023
- March 2023
- February 2023
- January 2023
- December 2022
- November 2022
- October 2022
- September 2022
- August 2022
- July 2022
- June 2022
- May 2022
- April 2022
- March 2022
- February 2022
- January 2022
- December 2021
- November 2021
- October 2021
- September 2021
- August 2021
- July 2021
- June 2021
- May 2021
- April 2021
- March 2021
- February 2021
- January 2021
- December 2020
- November 2020
- October 2020
- September 2020
- August 2020
- July 2020
- June 2020
- May 2020
- April 2020
- March 2020
- February 2020
- January 2020
- December 2019
- November 2019
- October 2019
- September 2019
- August 2019
- July 2019
- June 2019
- May 2019
- April 2019
- March 2019
- February 2019
- January 2019
- December 2018
- November 2018
- October 2018
- September 2018
- August 2018
- July 2018
- June 2018
- May 2018
- April 2018
- March 2018
- February 2018
- January 2018
- December 2017
- November 2017
- October 2017
- September 2017
- August 2017
- July 2017
- June 2017
- May 2017
- April 2017
- March 2017
- February 2017
- January 2017
- December 2016
- November 2016
- October 2016
- September 2016
- August 2016
- July 2016
- June 2016
- May 2016
- April 2016
- March 2016
- February 2016
- January 2016
- December 2015
- November 2015
- October 2015
- September 2015
- August 2015
- July 2015
- June 2015
- May 2015
- April 2015
- March 2015
- February 2015
- January 2015
- December 2014
- November 2014
- October 2014
- September 2014
- August 2014
- July 2014
- June 2014
- May 2014
- April 2014
- March 2014
- February 2014
- January 2014
- December 2013
- November 2013
- October 2013
- September 2013
- August 2013
- July 2013
- June 2013
- May 2013
- April 2013
- March 2013
- February 2013
- January 2013
- December 2012
- November 2012
- October 2012
- September 2012
- August 2012
- July 2012
- June 2012
- May 2012
- April 2012
- March 2012
- February 2012
- January 2012
- December 2011
- November 2011
- October 2011
- September 2011
- August 2011
- July 2011
- June 2011
- May 2011
- April 2011
- March 2011
- February 2011
- January 2011
- December 2010
- November 2010
- October 2010
- September 2010
- August 2010
- July 2010
- June 2010
- May 2010
- April 2010
- March 2010
- February 2010
- January 2010
- December 2009
- November 2009
- October 2009
- September 2009
- August 2009
- July 2009
- June 2009
- May 2009
- April 2009
- March 2009
- February 2009
- January 2009
- December 2008
- November 2008
- October 2008
- September 2008
- August 2008
- July 2008
- June 2008
- May 2008
- April 2008
- March 2008
- February 2008
- January 2008
- December 2007
- November 2007
- October 2007
- September 2007
- August 2007
- July 2007
- June 2007
- May 2007
- April 2007
- March 2007
- February 2007
- January 2007
- December 2006
- November 2006
- October 2006
- September 2006
- August 2006
- July 2006
- June 2006
- May 2006
- April 2006
- March 2006
- February 2006
- January 2006
- December 2005
- November 2005
- October 2005
- September 2005
- August 2005
- July 2005
 Eddy Elfenbein is a Washington, DC-based speaker, portfolio manager and editor of the blog Crossing Wall Street. His