CWS Market Review – September 5, 2023
(This is the free version of CWS Market Review. If you like what you see, then please sign up for the premium newsletter for $20 per month or $200 for the whole year. If you sign up today, you can see our two reports, “Your Handy Guide to Stock Orders” and “How Not to Get Screwed on Your Mortgage.”)
This Is the Tough Time of Year for Stocks
I hope you had a relaxing weekend. Traditionally, Labor Day Weekend marks a big change for stock returns.
A few years ago, I took the entire 127-year history of the Dow Jones Industrial Average and broke down how the index performs for each day of the year. That’s about 35,000 daily figures.
This is what the average year has looked like for the Dow. The index starts at 100 on January 1.
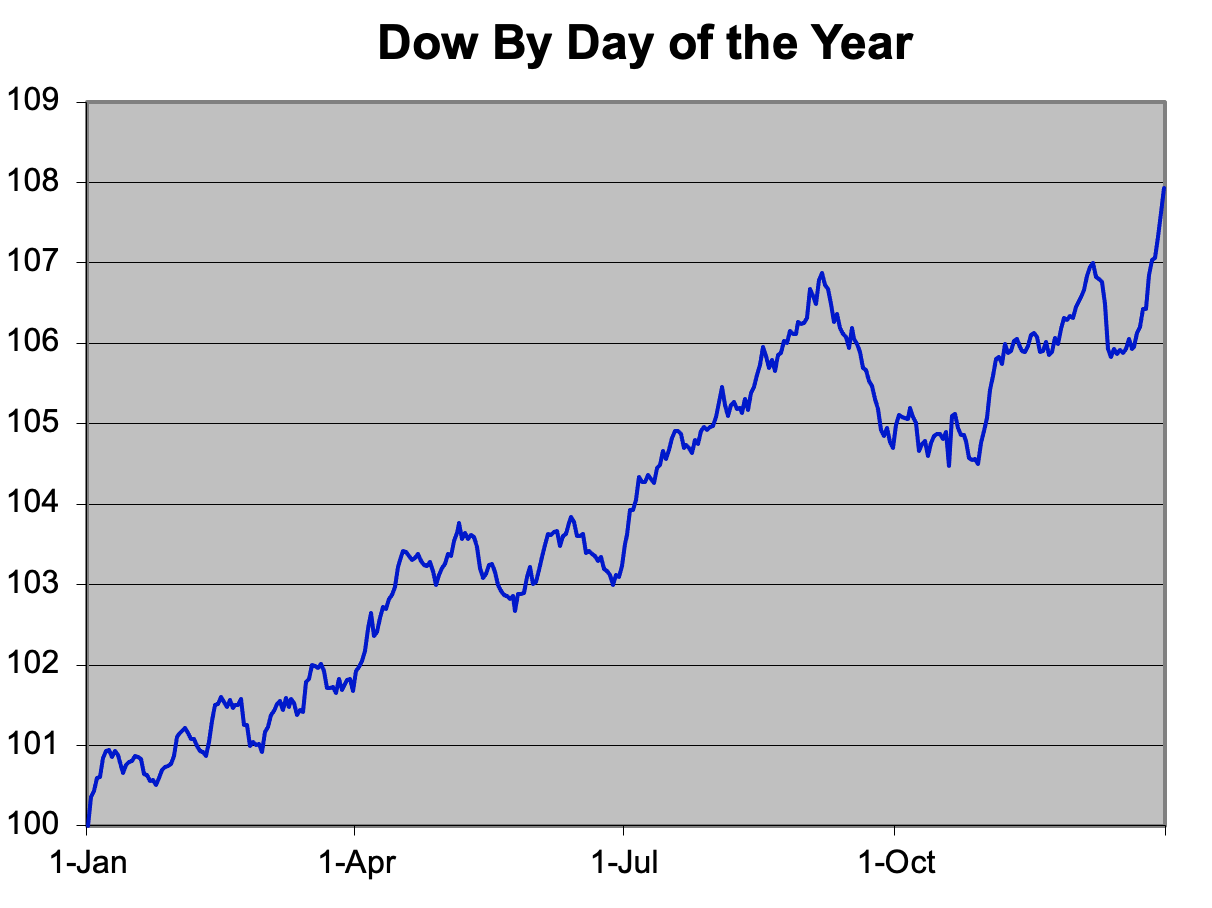
What I found is that historically, the Dow has reached a peak on September 6, shortly after Labor Day, and it’s fallen an average of 2.21% by October 29.
A drop of 2.21% may not sound like much, but it’s an unusually large drop when combining 127 years’ worth of data. That’s more than one-quarter of the Dow’s average annual gain.
Historically, the summer has been a very good time for stocks. From June 27 to September 6, the Dow has gained an average of 3.76%. That means that nearly half of the Dow’s annual gain has come over just 71 calendar days.
I want to stress that I don’t put a great deal of faith in these type of calendar effects. I would never make an investing decision based on one, but I do find them interesting. It seems very reasonable that summer has traditionally been good for stocks and that once the first hint of autumn comes, traders walk back some of those easy gains. This year, Wall Street had a good run from mid-March until late July, but investors may be growing more cautious. Speaking of growing caution, let’s look at last week’s job report.
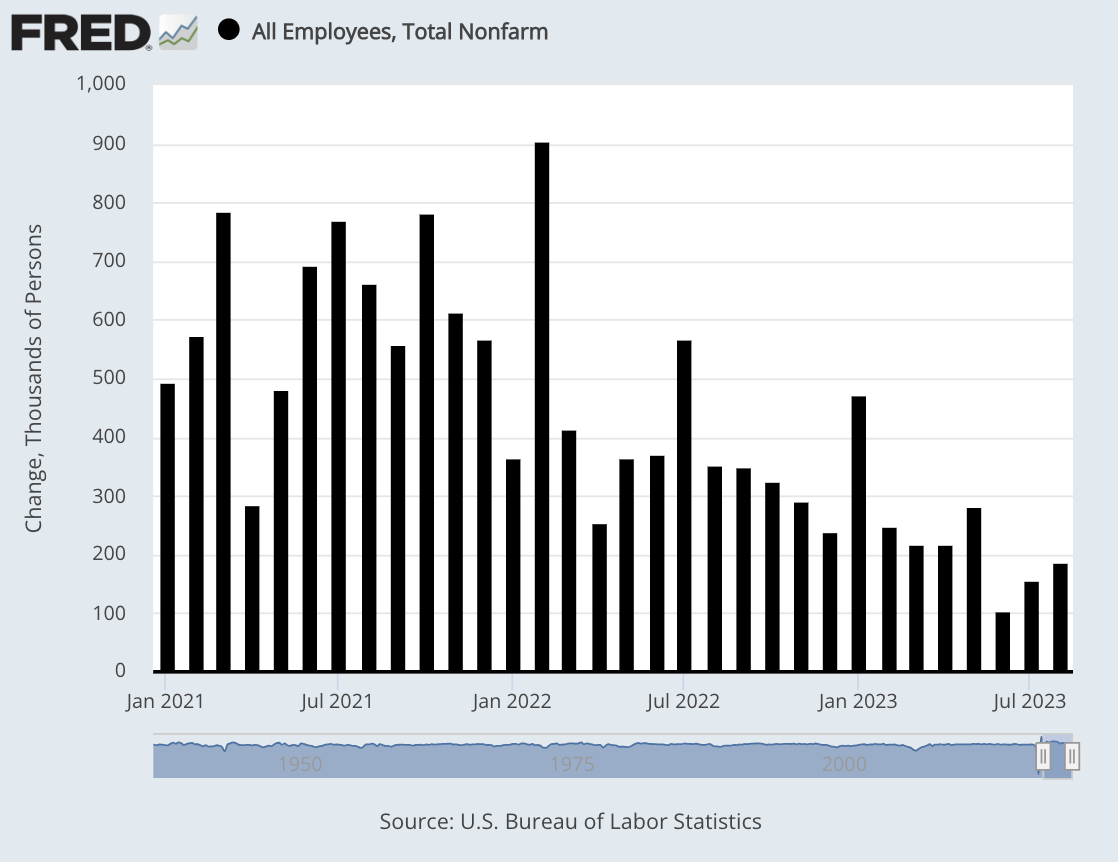
The Economy Created 187,000 Jobs Last Month
On Friday, the government reported that the U.S. economy created 187,000 net new jobs last month. While that’s higher than Wall Street’s consensus for 170,000 jobs, it did mark the third month in a row of sub-200,000 jobs. On top of that, the jobs numbers for June and July were revised lower. June was lowered by 30,000 and July was lowered by 80,000.
Before reading too much into this, I should caution you that the jobs numbers for August can be tricky. It’s a difficult month to track new jobs. As a result, the revisions to the August numbers can be unusually high. For example, two years ago, the August jobs number was eventually doubled from the initial report. With econ data, it’s more important to look at the overall trends.
For August, the unemployment rate rose to 3.8% which is the highest in 18 months. I also like to look at the “U-6” rate which is a broader measure of joblessness. For August, the U-6 rate rose by 0.4% to 7.1%. It’s now at its highest level since May 2022.
One good sign is that the labor force participation rate rose to 62.8%. That’s the highest in more than three years. In plain English, it means that more people are out there looking for jobs. Once you stop looking, the government stops counting you as unemployed.
Perhaps the most important figure is wages. For August, average hourly earnings increased by 0.2%. That was below expectations of 0.3%. Over the last year, average hourly earnings are up by 4.3%. Wall Street had been expecting 4.4%. Hours worked rose slightly to 34.4. This is important because higher earnings generally means more revenue for business.
Here are some details:
“The U.S. labor market continues to come back to earth but from a very high peak,” said Nick Bunker, head of economic research at the Indeed Hiring Lab. “The labor market was sprinting last year and now it’s getting closer to a marathon pace. A slowdown is welcome; it’s the only way to go the distance.”
Healthcare showed the biggest gain by sector, adding 71,000. Other leaders were leisure and hospitality (40,000), social assistance (26,000), and construction (22,000).
Transportation and warehousing lost 34,000, likely due to the Yellow trucking bankruptcy, and information declined by 15,000.
There could be some cracks showing in the labor market. Last week’s job openings report showed a decline of nearly nine million job openings in July. There are still 1.5 jobs for every unemployed person.
Last week, the Q2 GDP report was revised a bit lower to 2.1%. The day after the GDP report, we also got the personal income and spending data. For July, personal income increased by 0.2%. That was 0.1% below expectations. Personal spending increased by 0.8%. That beat expectations by 0.1%.
The PCE Price Index, which is the Fed’s preferred measure of inflation, rose by 0.2% in July. Over the last 12 months, the PCE has increased by 3.3%. The core PCE is up by 4.2%.
The Federal Reserve meets again in two weeks. I expect the Fed to pause again at this coming meeting, but the following meeting, in early November, is a different story. There’s a chance that the Fed will raise rates again, but it’s far from certain. In fact, it’s not out of bounds for the Fed to be finished with its rate hikes for this cycle. Goldman Sachs thinks so.
Traders currently place the odds of a pause in November at 59%. One week ago, the odds were at 65%.
I’m not ready to say that the Fed is done with its hikes just yet, but we’ll soon get more data. The next important date is Wednesday, September 13 when the next inflation report is due out. If we’re not at the end of the Fed’s rate cycle, then we’re getting very close. That’s good news for investors.
Looking at the Sahm Rule
The economist Claudia Sahm is known as the inventor of the “Sahm Rule” which tells us if we’re in a recession or not.
The rule is simple but the reasoning behind it is very clever. The idea is that if the unemployment rate rises by a little, then it’s likely to rise by a lot.
This is a smart insight because it recognizes that economic cycles tend to reinforce each other. For example, a recession may lead to corporate layoffs. Those layoffs lead to decreased consumer spending. In turn, that leads to lower profits, and so on. In other words, a recession leads to a recession and a recovery builds on a recovery.
This is also why it’s been very hard for the Fed to engineer soft landings.
Best of all, the Sahm Rule is easy to calculate. It says we’re in a recession when the rolling three-month average for unemployment is 0.5% or more higher than the rolling three-month low over the last 12 months.
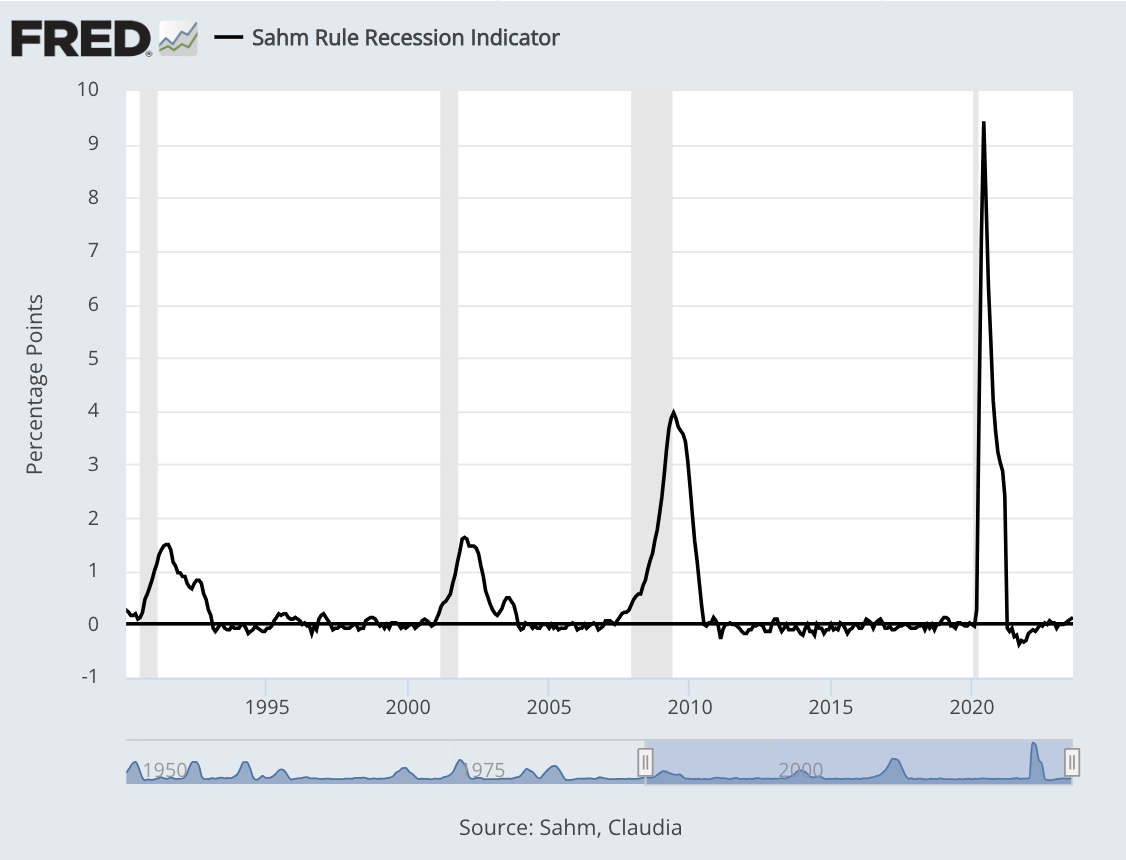
The rolling three-month average for unemployment reached 3.5% four months in a row (January through April). This means that the Sahm Rule would be triggered if the unemployment rate averages 4.0% for over a three-month period. This is why I took notice when last week’s report said that unemployment increased from 3.5% to 3.8%.
The math is easy. If we have an unemployment rate of 4.2% in September and October, then the Sahm Rule says we’re in a recession. Currently, the Sahm Rule is at 0.13%. Goldman Sachs just lowered its odds of a recession sometime in the next 12 months to 15%. This is the third time in three months that Goldman has lowered its recession odds.
To be clear, I agree that a recession right now is very unlikely. Also, this economy has proven to be far more resilient than a lot of experts thought.
That’s all for now. I’ll have more for you in the next issue of CWS Market Review.
– Eddy
P.S. If you want more info on our ETF, you can check out the ETF’s website.
Posted by Eddy Elfenbein on September 5th, 2023 at 8:09 pm
The information in this blog post represents my own opinions and does not contain a recommendation for any particular security or investment. I or my affiliates may hold positions or other interests in securities mentioned in the Blog, please see my Disclaimer page for my full disclaimer.
-
Archives
- July 2026
- June 2026
- May 2026
- April 2026
- March 2026
- February 2026
- January 2026
- December 2025
- November 2025
- October 2025
- September 2025
- August 2025
- July 2025
- June 2025
- May 2025
- April 2025
- March 2025
- February 2025
- January 2025
- December 2024
- November 2024
- October 2024
- September 2024
- August 2024
- July 2024
- June 2024
- May 2024
- April 2024
- March 2024
- February 2024
- January 2024
- December 2023
- November 2023
- October 2023
- September 2023
- August 2023
- July 2023
- June 2023
- May 2023
- April 2023
- March 2023
- February 2023
- January 2023
- December 2022
- November 2022
- October 2022
- September 2022
- August 2022
- July 2022
- June 2022
- May 2022
- April 2022
- March 2022
- February 2022
- January 2022
- December 2021
- November 2021
- October 2021
- September 2021
- August 2021
- July 2021
- June 2021
- May 2021
- April 2021
- March 2021
- February 2021
- January 2021
- December 2020
- November 2020
- October 2020
- September 2020
- August 2020
- July 2020
- June 2020
- May 2020
- April 2020
- March 2020
- February 2020
- January 2020
- December 2019
- November 2019
- October 2019
- September 2019
- August 2019
- July 2019
- June 2019
- May 2019
- April 2019
- March 2019
- February 2019
- January 2019
- December 2018
- November 2018
- October 2018
- September 2018
- August 2018
- July 2018
- June 2018
- May 2018
- April 2018
- March 2018
- February 2018
- January 2018
- December 2017
- November 2017
- October 2017
- September 2017
- August 2017
- July 2017
- June 2017
- May 2017
- April 2017
- March 2017
- February 2017
- January 2017
- December 2016
- November 2016
- October 2016
- September 2016
- August 2016
- July 2016
- June 2016
- May 2016
- April 2016
- March 2016
- February 2016
- January 2016
- December 2015
- November 2015
- October 2015
- September 2015
- August 2015
- July 2015
- June 2015
- May 2015
- April 2015
- March 2015
- February 2015
- January 2015
- December 2014
- November 2014
- October 2014
- September 2014
- August 2014
- July 2014
- June 2014
- May 2014
- April 2014
- March 2014
- February 2014
- January 2014
- December 2013
- November 2013
- October 2013
- September 2013
- August 2013
- July 2013
- June 2013
- May 2013
- April 2013
- March 2013
- February 2013
- January 2013
- December 2012
- November 2012
- October 2012
- September 2012
- August 2012
- July 2012
- June 2012
- May 2012
- April 2012
- March 2012
- February 2012
- January 2012
- December 2011
- November 2011
- October 2011
- September 2011
- August 2011
- July 2011
- June 2011
- May 2011
- April 2011
- March 2011
- February 2011
- January 2011
- December 2010
- November 2010
- October 2010
- September 2010
- August 2010
- July 2010
- June 2010
- May 2010
- April 2010
- March 2010
- February 2010
- January 2010
- December 2009
- November 2009
- October 2009
- September 2009
- August 2009
- July 2009
- June 2009
- May 2009
- April 2009
- March 2009
- February 2009
- January 2009
- December 2008
- November 2008
- October 2008
- September 2008
- August 2008
- July 2008
- June 2008
- May 2008
- April 2008
- March 2008
- February 2008
- January 2008
- December 2007
- November 2007
- October 2007
- September 2007
- August 2007
- July 2007
- June 2007
- May 2007
- April 2007
- March 2007
- February 2007
- January 2007
- December 2006
- November 2006
- October 2006
- September 2006
- August 2006
- July 2006
- June 2006
- May 2006
- April 2006
- March 2006
- February 2006
- January 2006
- December 2005
- November 2005
- October 2005
- September 2005
- August 2005
- July 2005
 Eddy Elfenbein is a Washington, DC-based speaker, portfolio manager and editor of the blog Crossing Wall Street. His