CWS Market Review – January 16, 2024
(This is the free version of CWS Market Review. If you like what you see, then please sign up for the premium newsletter for $20 per month or $200 for the whole year. If you sign up today, you can see our two reports, “Your Handy Guide to Stock Orders” and “How Not to Get Screwed on Your Mortgage.”)
Stocks Near a New High? Not Adjusting for Inflation
The S&P 500 has been getting very close to a new all-time high. This is exciting. We haven’t had a new high for more than two years. Earlier today, the index broke above 4,800, something it hasn’t done in two years. Unfortunately, we couldn’t hold on and the market closed down a bit today.
The all-time record close came on January 3, 2022, at 4,796.56. That was the first day of trading of 2022. Last Friday, the S&P 500 closed at 4,783.83. That’s less than 0.3% from a new all-time high.
Still, calling this a new all-time high is a little deceiving because we’ve had an unpleasant bout of inflation over the last two years.
Here’s a look at the S&P 500 but this time it’s divided by the Consumer Price Index, in other words, inflation:
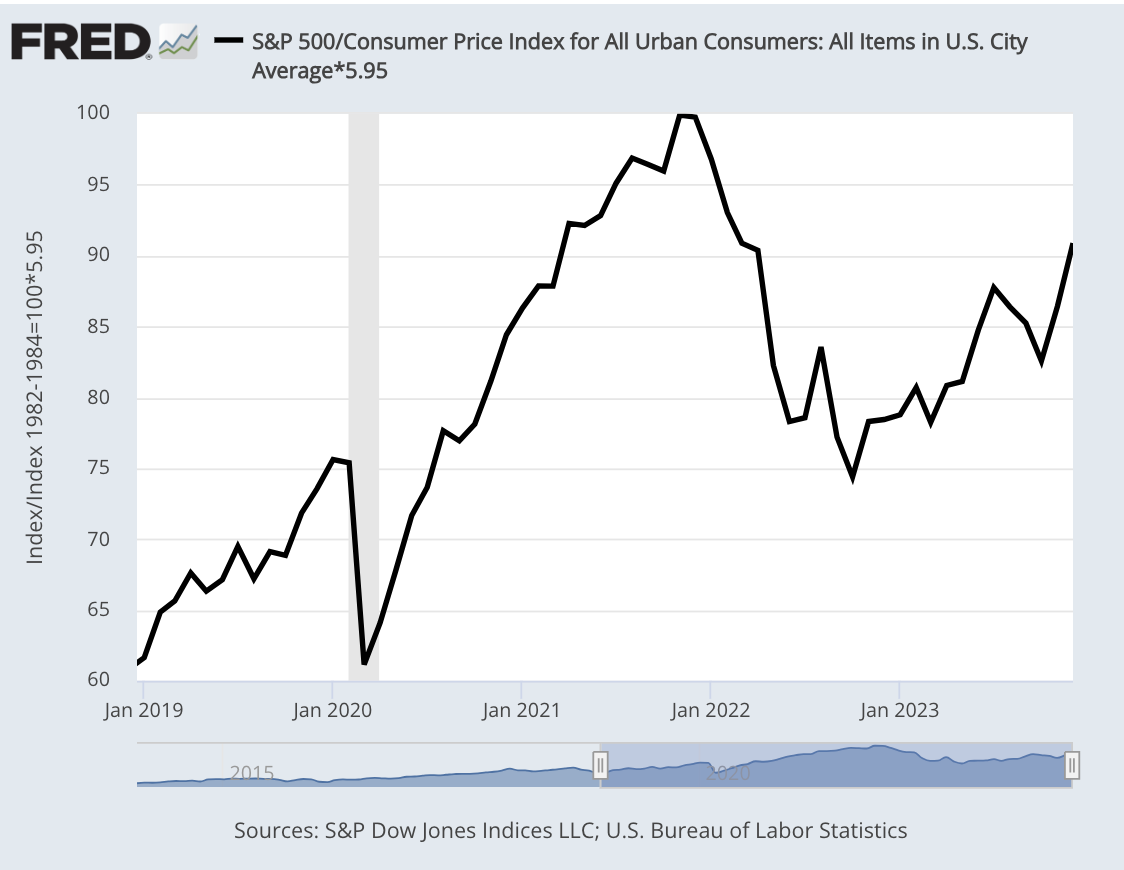
Looking at it this way, you can see that we’re still well below the peak from two years ago. We need another 10% to reach a real new high. (To make the chart easier to read, I adjusted the index so its peak level is 100 on the chart.)
The chart above shows just how destructive inflation is to financial markets. Not only do stocks and bonds go down in value, but those values are diminished by inflation as well.
In retrospect, it’s interesting to note that stocks started to fall once inflation exceeded 7%, and stock prices didn’t rally again until inflation fell back below 7%. On Wall Street, there are plenty of sophisticated models trying to predict share prices, but a simple 7% level did the trick pretty well.
The S&P 500 reached its closing low on October 12, 2022 at 3,577.03. From head to toe, the index lost 25.4% in a little over nine months. Since then, the S&P 500 has rallied back more than 33%.
We could also add another important stat which is that the stock market has gained, on average, about 7% per year over the long pull once you include dividends and inflation. In plain English, that means the stock market needs to climb about 20% or so just to reach the long-term trend line.
Traders appear to be looking for an excuse to push the market up to a new all-time high. The latest opportunity is earnings season which started last week.
Taking a Look at Bank Earnings
There’s no official opening to earnings season. No one fires off a canon or anything, but the unofficial start came on Friday when several major banks reported their earnings. All told, the banks didn’t do very well last year.
Here’s a look at how the S&P 500 Financials ETF (XLF) did compared with the S&P 500 ETF (SPY):
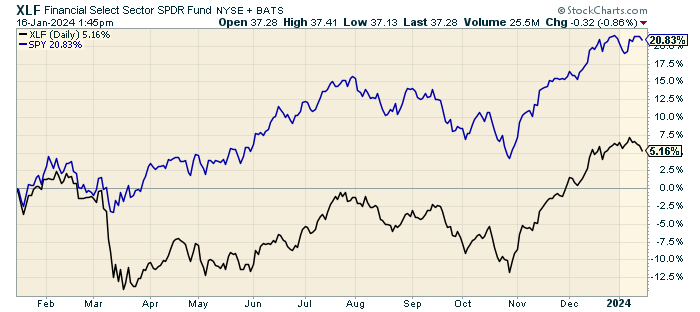
See that drop in March? That’s when Silicon Valley Bank went kablooey.
To be fair, the banks handled a very difficult climate as well as you could expect. Despite the troubles, JPMorgan, Bank of America, Wells Fargo and Citigroup earned a combined $104 billion last year. That’s 11% more than 2022. At the same time, Wells Fargo, Bank of America and Citigroup together culled their workforces by a combined 17,700 in 2023.
Here’s a brief summary of some of the major earnings reports:
Bank of America (BAC) got dinged on Friday after the bank said it made 70 cents per share last quarter which was a two-cent beat.
The problem is that BAC’s revenue came in below expectations ($22.1 billion versus $23.74 billion). For the quarter, revenue was down 10%. The bank also had a pre-tax charge of $1.2 billion. Shares of BAC closed lower today for the sixth session in a row. The bank is currently going for about 10 times forward earnings.
BlackRock (BLK) had another very good quarter. These folks seem to make money in any environment. The company is the largest asset manager in the world. Last quarter, BLK made $9.66 per share while Wall Street had been expecting $8.84 per share. Revenue was $4.63 billion which matched expectations. The company now manages more than $10 trillion in assets.
Bank of New York Mellon (BK) also had a big one-time charge. That seems to be the theme this season. To be fair, many banks had to help replenish the FDIC after the regional bank troubles from last year. Excluding that, BK made $1.28 per share last quarter. That was a 15-cent beat. Revenues were up 10% to $4.31 billion. The stock got a nice 4% jump in Friday’s trading, and it hit a new 52-week high today.
Wells Fargo (WFC) made 86 cents per share but once that’s adjusted for charges, then the bank made $1.29 per share last quarter. That beat expectations by 12 cents per share. Revenue came in at $20.48 billion which was a little bit below expectations.
I like to look at net interest income which is the core of what a bank does. For last quarter, net interest income fell 5% to $12.78 billion. Wells warned that net interest income would come in lower this year. The shares pulled back after Friday’s report. I haven’t been terribly impressed by Wells recently.
JPMorgan Chase (JPM) is the Grand Poobah of banking. Its market value is close to half a trillion, so it’s worth seeing what it had to say. Also, Jamie Dimon, the CEO, is never shy about his beliefs. JPM has nearly $4 trillion in assets and a very strong balance sheet.
For Q3, JPM made $9.3 billion or $3.04 a share, but there was a big $2.9 billion payment to the FDIC. The bank said its merger business fell 18% last year. For the quarter, JPM earned $3.04 per share. That compares with Wall Street’s increase of $3.32 per share. (That may not be the exact comparison. There appears to be some uncertainty here.) JPM had revenues of $39.94 billion which was a little more than expectations of $39.78 billion.
Citigroup (C) said it lost $1.8 billion last quarter, but that’s after (you guessed it) several large charges. Clearing all that away, Citi said it made 84 cents per share last quarter. Revenues came in at $17.44 billion which was $1.3 billion below expectations. CEO Jane Fraser said the results were “very disappointing.” Citigroup also said it’s cutting 20,000 jobs.
We had a few more banks report this morning. Goldman Sachs (GS) shredded expectations. The Wall Street powerhouse said it made $5.48 per share last quarter. Expectations were for $3.51. (As with JPMorgan, there appears to be some doubt over which figure is the final profit figure.)
Last year was a tough year for many Wall Street firms as major deals dried up. That’s another effect of higher interest rates. At Goldman, investment banking fees fell 12% to $1.65 billion.
Shares of Morgan Stanley (MS) took a hit today even though its earnings report wasn’t as bad at it looks on the surface. Last quarter, Morgan made 85 cents per share where the Street was expecting $1.01 per share. The bank had quarterly revenues of $12.90 billion which beat expectations of $12.75 billion. Morgan’s investment banking revenue edged up 5% thanks to a big lift from fixed income. The stock fell 4.9% today.
PNC Financial Services (PNC) made $3.16 in Q4 compared with estimates of $2.71 per share. One year ago, PNC made $3.47 per share for last year’s Q4. The stock dropped sharply at today’s open, but it gradually made back most of what it lost. PNC’s CEO said, “We grew revenue, controlled core expenses, added to our loan portfolio and maintained strong credit metrics.”
Earnings for Our Buy List Stocks
We still don’t have all the earnings dates for our Buy List, but it looks like our first stocks to report will come next Wednesday, January 24, from Amphenol (APH) and Abbott Labs (ABT). (I’ll have more on these on Thursday for our premium subscribers.)
I’m especially looking forward to Abbott’s report. The stock is very close to breaking its 52-week high from July. A new high may come any day now.
If you’re not familiar with Abbott, check out this long-term chart:
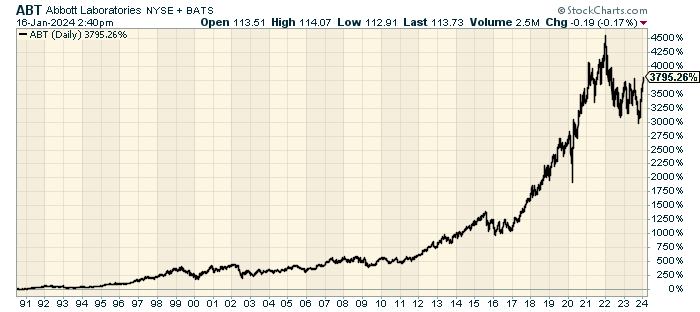
That’s a very impressive chart. Abbott is up 38-fold in 33 years. Note also how consistent it’s been.
In October, Abbott’s Q3 report beat Wall Street’s consensus, and it narrowed its full-year guidance to a range of $4.42 to $4.46 per share. If you want to be technical, that’s an increase to the mid-point of its previous range.
Let’s do a little math. For the first three quarters of this year, Abbott made $3.25 per share. With the updated guidance, that implies Q4 earnings of $1.17 to $1.21 per share. That’s quite good. For its part, Wall Street is playing it safe and the consensus is for $1.19 per share.
Abbott is as blue chippy as they get. Last month, the company increased its dividend for the last 52 years in a row. The dividend was increased from 51 to 55 cents per share. There aren’t many companies that can boast of a track record like that. I’m looking forward to more good news from Abbott next week.
That’s all for now. I’ll have more for you in the next issue of CWS Market Review.
– Eddy
P.S. If you want more info on our ETF, you can check out the ETF’s website.
Posted by Eddy Elfenbein on January 16th, 2024 at 6:36 pm
The information in this blog post represents my own opinions and does not contain a recommendation for any particular security or investment. I or my affiliates may hold positions or other interests in securities mentioned in the Blog, please see my Disclaimer page for my full disclaimer.
-
Archives
- July 2026
- June 2026
- May 2026
- April 2026
- March 2026
- February 2026
- January 2026
- December 2025
- November 2025
- October 2025
- September 2025
- August 2025
- July 2025
- June 2025
- May 2025
- April 2025
- March 2025
- February 2025
- January 2025
- December 2024
- November 2024
- October 2024
- September 2024
- August 2024
- July 2024
- June 2024
- May 2024
- April 2024
- March 2024
- February 2024
- January 2024
- December 2023
- November 2023
- October 2023
- September 2023
- August 2023
- July 2023
- June 2023
- May 2023
- April 2023
- March 2023
- February 2023
- January 2023
- December 2022
- November 2022
- October 2022
- September 2022
- August 2022
- July 2022
- June 2022
- May 2022
- April 2022
- March 2022
- February 2022
- January 2022
- December 2021
- November 2021
- October 2021
- September 2021
- August 2021
- July 2021
- June 2021
- May 2021
- April 2021
- March 2021
- February 2021
- January 2021
- December 2020
- November 2020
- October 2020
- September 2020
- August 2020
- July 2020
- June 2020
- May 2020
- April 2020
- March 2020
- February 2020
- January 2020
- December 2019
- November 2019
- October 2019
- September 2019
- August 2019
- July 2019
- June 2019
- May 2019
- April 2019
- March 2019
- February 2019
- January 2019
- December 2018
- November 2018
- October 2018
- September 2018
- August 2018
- July 2018
- June 2018
- May 2018
- April 2018
- March 2018
- February 2018
- January 2018
- December 2017
- November 2017
- October 2017
- September 2017
- August 2017
- July 2017
- June 2017
- May 2017
- April 2017
- March 2017
- February 2017
- January 2017
- December 2016
- November 2016
- October 2016
- September 2016
- August 2016
- July 2016
- June 2016
- May 2016
- April 2016
- March 2016
- February 2016
- January 2016
- December 2015
- November 2015
- October 2015
- September 2015
- August 2015
- July 2015
- June 2015
- May 2015
- April 2015
- March 2015
- February 2015
- January 2015
- December 2014
- November 2014
- October 2014
- September 2014
- August 2014
- July 2014
- June 2014
- May 2014
- April 2014
- March 2014
- February 2014
- January 2014
- December 2013
- November 2013
- October 2013
- September 2013
- August 2013
- July 2013
- June 2013
- May 2013
- April 2013
- March 2013
- February 2013
- January 2013
- December 2012
- November 2012
- October 2012
- September 2012
- August 2012
- July 2012
- June 2012
- May 2012
- April 2012
- March 2012
- February 2012
- January 2012
- December 2011
- November 2011
- October 2011
- September 2011
- August 2011
- July 2011
- June 2011
- May 2011
- April 2011
- March 2011
- February 2011
- January 2011
- December 2010
- November 2010
- October 2010
- September 2010
- August 2010
- July 2010
- June 2010
- May 2010
- April 2010
- March 2010
- February 2010
- January 2010
- December 2009
- November 2009
- October 2009
- September 2009
- August 2009
- July 2009
- June 2009
- May 2009
- April 2009
- March 2009
- February 2009
- January 2009
- December 2008
- November 2008
- October 2008
- September 2008
- August 2008
- July 2008
- June 2008
- May 2008
- April 2008
- March 2008
- February 2008
- January 2008
- December 2007
- November 2007
- October 2007
- September 2007
- August 2007
- July 2007
- June 2007
- May 2007
- April 2007
- March 2007
- February 2007
- January 2007
- December 2006
- November 2006
- October 2006
- September 2006
- August 2006
- July 2006
- June 2006
- May 2006
- April 2006
- March 2006
- February 2006
- January 2006
- December 2005
- November 2005
- October 2005
- September 2005
- August 2005
- July 2005
 Eddy Elfenbein is a Washington, DC-based speaker, portfolio manager and editor of the blog Crossing Wall Street. His