CWS Market Review – February 10, 2026
(This is the free version of CWS Market Review. If you like what you see, then please sign up for the premium newsletter for $20 per month or $200 for the whole year. If you sign up today, you can see our two reports, “Your Handy Guide to Stock Orders” and “How Not to Get Screwed on Your Mortgage.”)
On Friday, the Dow Jones Industrial Average closed above 50,000 for the first time in its history. This comes almost 70 years to the day from when the Dow first breeched 500. In other words, the Dow has risen 100-fold in nearly 70 years. That works out to an average gain of 6.8% per year, or 1% every eight weeks, and that doesn’t include dividends.
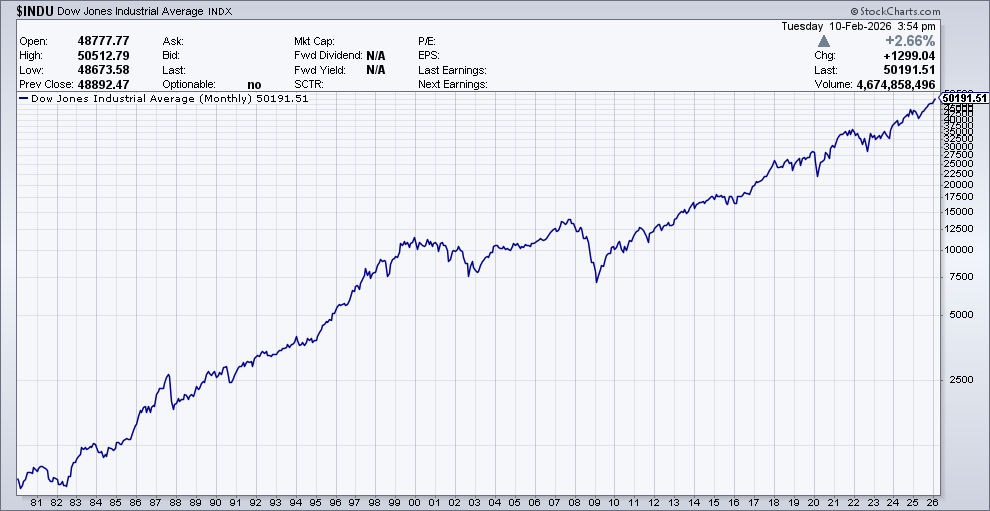
As impressive as that sounds, the Dow has actually been the laggard in recent years. The Dow’s holding of mega-cap tech isn’t quite as hefty as the overall market’s weighting. The Dow currently holds Amazon, Nvidia, Microsoft and Apple.
An important fact here is that the Dow is price-weighted which means the index is calculated by adding up the prices of the 30 stocks and adjusting by a divisor. Roughly speaking, each dollar move in a Dow stock is worth about 6.16 points in the Dow. How large the company is doesn’t matter. Of the four mega-cap stocks I just mentioned, only Microsoft is ranked among the top 12 in the Dow going by price weighting.
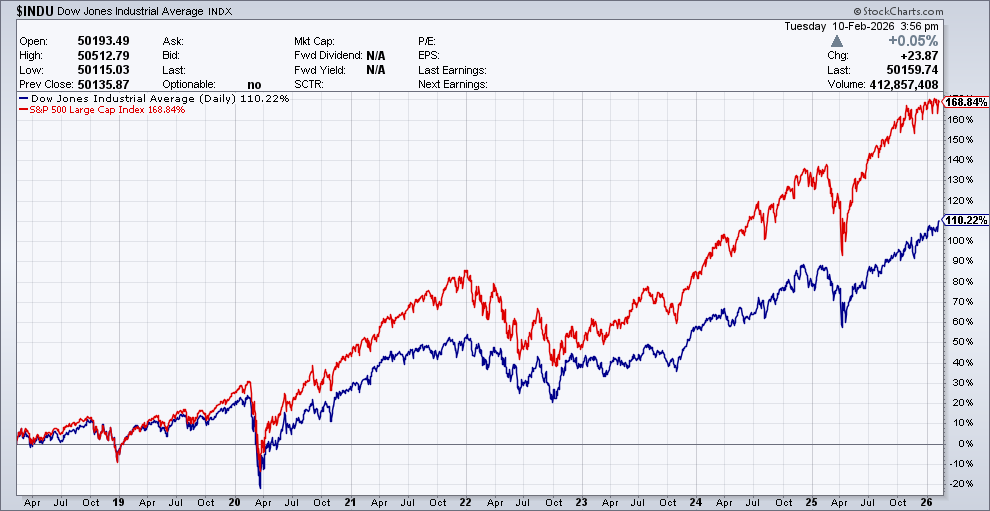
In the chart below, you can really see how badly the Dow (in blue) has lagged the S&P 500 (red). If the Dow had merely kept pace with the S&P 500 over the last eight years, the index would be around 63,000 today instead of 50,000.
Right about the time the Dow was breaking 500, the index made its first change in 17 years. In 1956, International Paper was added and Loews Theaters was dropped. Before that, we’d have to go back to 1939 when Nash Motors and IBM were dropped.
The dropping of IBM was a huge mistake, and it completely altered the Dow’s history. All the major milestones would have come years earlier. IBM was added back to the Dow in 1979. Over those 40 years, shares of IBM soared 22,000%.
The Market’s Inflation-Adjusted Peak
Speaking of Wall Street history, yesterday was an important, and largely overlooked, anniversary for Wall Street. Yesterday marked the 60th anniversary of the stock market’s inflation-adjusted peak.
Some explanation is needed. On February 9, 1966, the S&P 500 closed at 94.06. Going by nominal terms, the S&P 500 passed that high as early as 1967. By 1968, the S&P 500 traded over 100, but after adjusting for inflation, the market was in a tailspin that lasted for several years.
Here’s a look at the inflation-adjusted S&P for nearly the entire 20th century. I got this data from Robert Shiller’s data library. To make it easier to read, I set February 1966 to 100.
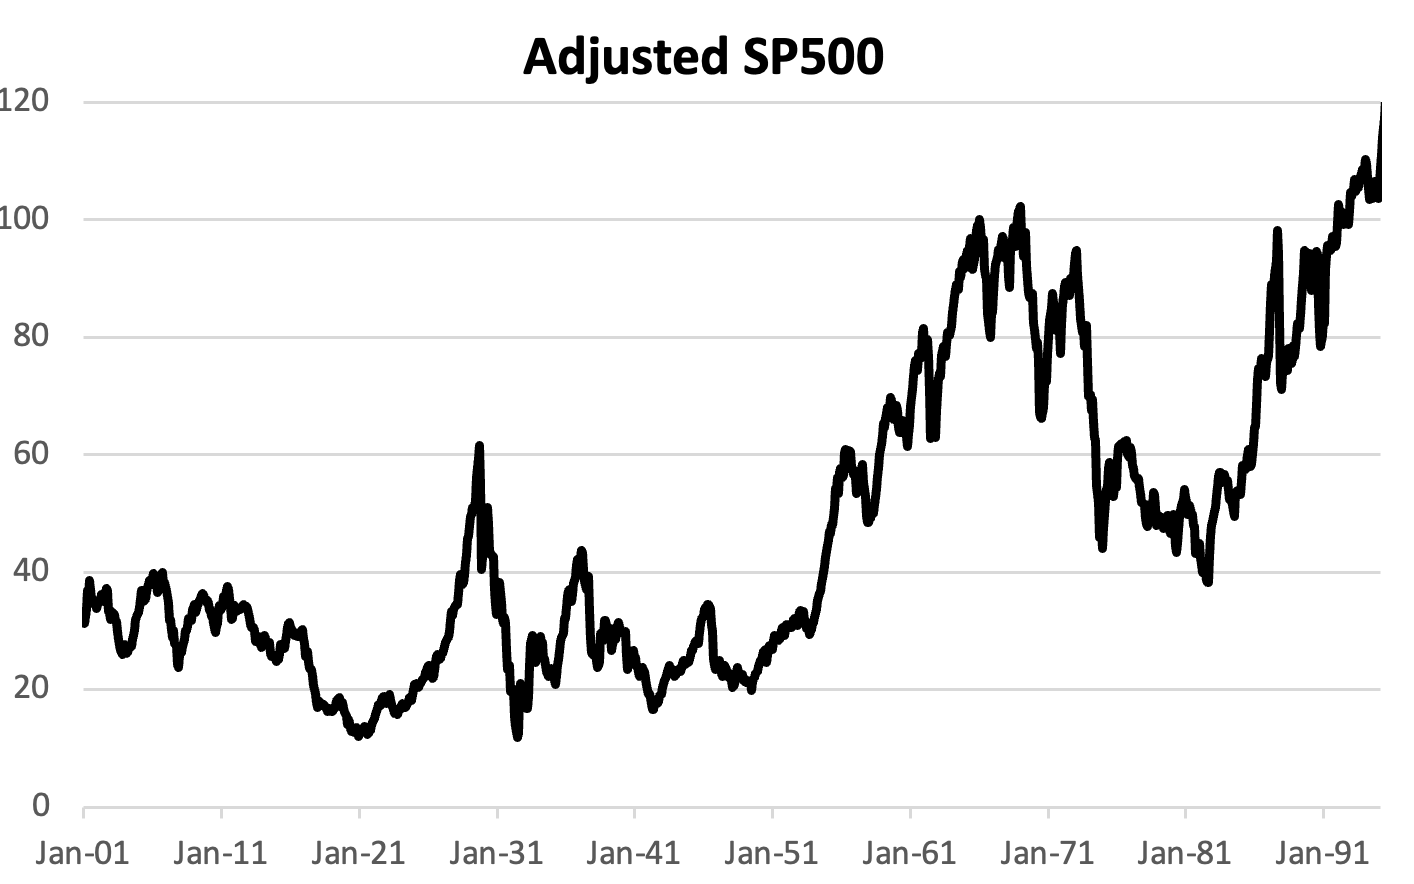
By 1982, the S&P 500 was down more than 60% from its peak sixteen years prior. Think about that! As late as October 1992, the market was still trading below its inflation-adjusted peak from 26 years before.
The key lesson from this data is how dangerous inflation is to the stock market. Inflation is a tax on capital. When inflation appears, bonds quickly lose value, and stocks fall as well to keep pace with fixed-income investments. From 1966 to 1982, inflation in the United States tripled. That took a huge toll on financial markets.
Inflation was finally cured by the Fed in the 1980s, but it took a brutal recession to slay the beast. Once that was out of the way, the stock market soared. From a long-term perspective, stocks weren’t really climbing as much as they were making back a lot of lost ground.
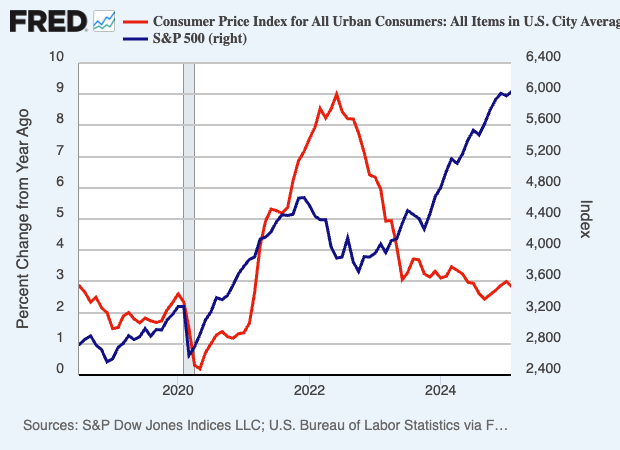
Here’s a chart looking at stocks and inflation from the early part of this decade. Notice that a sharp rise in inflation (the red line, left scale) sparked a big loss in stocks (the blue line, right scale). Again, stocks hate inflation.
IES Teaches Us a Good Investing Lesson
One of the lessons I stress to investors, especially newer investors, is how irrational the stock market can be. Warren Buffett once said, “If markets were rational, I’d be waiting tables for a living.”
From a distance, the stock market can appear to be rational. It has all these numbers, and all these experts giving their expertise on all sorts of things. But in the short-term, it’s pure chaos. No one likes to admit that, but it’s true.
We got a good lesson in the market’s behavior recently with one of our Buy List stocks.
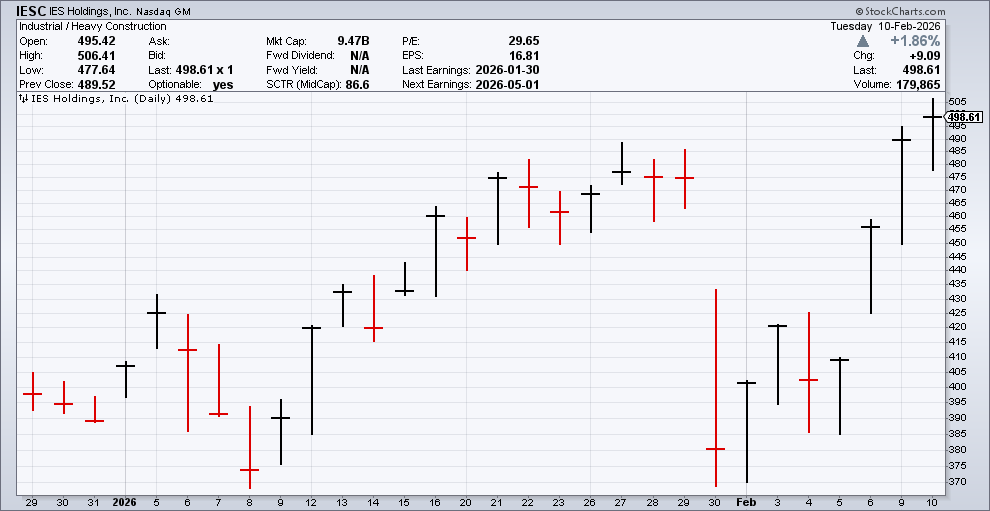
On January 30, IES Holdings, Inc. (IESC) released its fiscal-Q1 earnings report. This was for the three months ending in December. IES has been a great stock for us. I added it to the Buy List last year, and it gained over 90% for us in 2025. I especially like IES because it’s virtually unfollowed by any Wall Street analysts.
I decided to keep the stock on the 2026 Buy List as well. IES is having another solid year for us. By January 30, IES was a 22% winner for us. That’s not bad for less than one month’s work.
According to the earnings report, IES’s quarterly revenues rose 16% to $871 million, and operating income was up 31% to $97.7 million. Diluted adjusted EPS attributable to common stockholders was up 40% to $3.71. With so little analyst coverage, there’s no real consensus to speak of.
At the end of the quarter, IES had a backlog of $2.6 billion. The company ended the quarter with $88.8 million in cash, no debt, and $169.9 million in marketable securities.
IESC has four reporting segments. Communications’ revenue grew 51% to $351 million. Residential was down 11% to $284 million. Infrastructure Solutions had 30% revenue growth to $140 million. Commercial & Industrial was up 7% to $95 million.
You would think this was good news. Not so. Once trading opened on Friday, January 30, shares of IES got absolutely clobbered. Whatever the expectations were, IES quite obviously didn’t meet them. By the end of trading, shares of IES were down 20% on the day. Ouch!
I thought the drop was extreme, but it’s hard to argue with a mob. Did they even look at the earnings report? It said nothing that should have been a surprise.
Now here’s the odd part. Since IES reached its low, the stock has been in a blistering rally. Over the last seven trading days, IESC has gained more than 31%. It’s made up everything it lost and then some. IESC is now a 28% winner on the year. The stock reached another new all-time high in today’s trading.
I don’t get it. We made a tidy profit, and we didn’t do anything except not panic. This is a good reminder of why it pays to ignore the market’s short-term bumps and bruises.
Tomorrow’s Jobs Report
Earlier today we got the delayed retail sales report for December. The Commerce Department said that retail sales were flat during the month of December. Economists had expected an increase of 0.4%. Excluding autos, sales also were unchanged compared to the estimate for a 0.3% increase. That comes on top of a 0.6% increase for November.
We’re getting several excuses for the poor report including inflation, tariffs and the weather. For the year, retail sales were up by 2.4%. That’s a little bit below the rate of inflation. Not including autos, sales were up 3.3% over the last 12 months.
Miscellaneous retailers and furniture stores posted declines of 0.9%, while clothing and accessories stores were off 0.7%, and electronics and appliances saw a drop of 0.4%. Online outlets sales rose just 0.1%, while building materials and garden centers saw the strongest gain, up 1.2%.
I need to apologize for an error. In last week’s issue, I said the January jobs report was coming out on Friday. That was incorrect. The report is due out tomorrow. My apologies. In my defense, the government shutdown screwed up many of these reporting dates.
For tomorrow, Wall Street expects to see a gain of 55,000 new jobs for January. The last few reports haven’t been that strong. I think a disappointing report could upset the market. Wall Street expects the unemployment rate to stay at 4.4%.
My biggest concern is average hourly earnings. For January, Wall Street expects to see a gain of 0.3%. Wage growth is running ahead of inflation but not by much.
A big question for tomorrow’s jobs report is that the annual revisions are also due out. There’s a good chance that the numbers will show that the labor market is doing a lot worse than originally thought.
As it looks right now, the Fed under Jerome Powell won’t touch interest rates again. We may have to wait until June, and a new Fed chair, for the central bank to cut rates again.
That’s all for now. Expect more earnings news this week. I’ll have more for you in the next issue of CWS Market Review.
– Eddy
Posted by Eddy Elfenbein on February 10th, 2026 at 6:17 pm
The information in this blog post represents my own opinions and does not contain a recommendation for any particular security or investment. I or my affiliates may hold positions or other interests in securities mentioned in the Blog, please see my Disclaimer page for my full disclaimer.
-
Archives
- October 2026
- September 2026
- August 2026
- July 2026
- June 2026
- May 2026
- April 2026
- March 2026
- February 2026
- January 2026
- December 2025
- November 2025
- October 2025
- September 2025
- August 2025
- July 2025
- June 2025
- May 2025
- April 2025
- March 2025
- February 2025
- January 2025
- December 2024
- November 2024
- October 2024
- September 2024
- August 2024
- July 2024
- June 2024
- May 2024
- April 2024
- March 2024
- February 2024
- January 2024
- December 2023
- November 2023
- October 2023
- September 2023
- August 2023
- July 2023
- June 2023
- May 2023
- April 2023
- March 2023
- February 2023
- January 2023
- December 2022
- November 2022
- October 2022
- September 2022
- August 2022
- July 2022
- June 2022
- May 2022
- April 2022
- March 2022
- February 2022
- January 2022
- December 2021
- November 2021
- October 2021
- September 2021
- August 2021
- July 2021
- June 2021
- May 2021
- April 2021
- March 2021
- February 2021
- January 2021
- December 2020
- November 2020
- October 2020
- September 2020
- August 2020
- July 2020
- June 2020
- May 2020
- April 2020
- March 2020
- February 2020
- January 2020
- December 2019
- November 2019
- October 2019
- September 2019
- August 2019
- July 2019
- June 2019
- May 2019
- April 2019
- March 2019
- February 2019
- January 2019
- December 2018
- November 2018
- October 2018
- September 2018
- August 2018
- July 2018
- June 2018
- May 2018
- April 2018
- March 2018
- February 2018
- January 2018
- December 2017
- November 2017
- October 2017
- September 2017
- August 2017
- July 2017
- June 2017
- May 2017
- April 2017
- March 2017
- February 2017
- January 2017
- December 2016
- November 2016
- October 2016
- September 2016
- August 2016
- July 2016
- June 2016
- May 2016
- April 2016
- March 2016
- February 2016
- January 2016
- December 2015
- November 2015
- October 2015
- September 2015
- August 2015
- July 2015
- June 2015
- May 2015
- April 2015
- March 2015
- February 2015
- January 2015
- December 2014
- November 2014
- October 2014
- September 2014
- August 2014
- July 2014
- June 2014
- May 2014
- April 2014
- March 2014
- February 2014
- January 2014
- December 2013
- November 2013
- October 2013
- September 2013
- August 2013
- July 2013
- June 2013
- May 2013
- April 2013
- March 2013
- February 2013
- January 2013
- December 2012
- November 2012
- October 2012
- September 2012
- August 2012
- July 2012
- June 2012
- May 2012
- April 2012
- March 2012
- February 2012
- January 2012
- December 2011
- November 2011
- October 2011
- September 2011
- August 2011
- July 2011
- June 2011
- May 2011
- April 2011
- March 2011
- February 2011
- January 2011
- December 2010
- November 2010
- October 2010
- September 2010
- August 2010
- July 2010
- June 2010
- May 2010
- April 2010
- March 2010
- February 2010
- January 2010
- December 2009
- November 2009
- October 2009
- September 2009
- August 2009
- July 2009
- June 2009
- May 2009
- April 2009
- March 2009
- February 2009
- January 2009
- December 2008
- November 2008
- October 2008
- September 2008
- August 2008
- July 2008
- June 2008
- May 2008
- April 2008
- March 2008
- February 2008
- January 2008
- December 2007
- November 2007
- October 2007
- September 2007
- August 2007
- July 2007
- June 2007
- May 2007
- April 2007
- March 2007
- February 2007
- January 2007
- December 2006
- November 2006
- October 2006
- September 2006
- August 2006
- July 2006
- June 2006
- May 2006
- April 2006
- March 2006
- February 2006
- January 2006
- December 2005
- November 2005
- October 2005
- September 2005
- August 2005
- July 2005
 Eddy Elfenbein is a Washington, DC-based speaker, portfolio manager and editor of the blog Crossing Wall Street. His